

Find and interpret the values of r and r 2 for the given data. Exercise 13 Data
Question:
Find and interpret the values of r and r2 for the given data.
Exercise 13
Data from Exercises 13
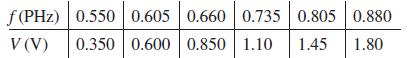
In an experiment on the photoelectric effect, the frequency of light being used was measured as well as the stopping potential (the voltage just sufficient to stop the photoelectric effect) with the results given below. Use a calculator to find the least-squares line for V as a function of f. The frequency for V = 0 is known as the threshold frequency. From the graph determine the threshold frequency.
Fantastic news! We've Found the answer you've been seeking!
Step by Step Answer:
To find the values of r and r2 we first need to find the correlation coefficient r Using a calc...View the full answer

Answered By
Mary Boke
I have teached the student upto class 12th as well as my fellow mates.I have a good command in engineering,maths and science.I scored 90+ marks in 10th and 12th in maths.
0 Reviews
10+ Question Solved
Related Book For 

Basic Technical Mathematics
ISBN: 9780137529896
12th Edition
Authors: Allyn J. Washington, Richard Evans
Question Posted:
