

Draw the graph of the function in a viewing rectangle that contains all the important features of
Question:
Draw the graph of the function
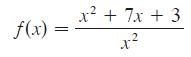
in a viewing rectangle that contains all the important features of the function. Estimate the maximum and minimum values and the intervals of concavity. Then use calculus to find these quantities exactly.
Fantastic news! We've Found the answer you've been seeking!
Step by Step Answer:
Figure 6 produced by a computer with automatic scaling is a disaster Some graphing calculators use 1...View the full answer

Answered By
Mohammad Zafar
I have worked in E-Learning companies for five years with 4 years of teaching experience. As far as offline tutoring experience is concerned I have 14 years of teaching experience. I have taught11th, 12th Indian students, and IITJEE (An entrance Test to enter into elite engineering colleges ) aspirants. I also teach mathematics to international students doing their graduation in Mathematics. I have five years of experience as a Q&A expert and one year of experience as an online tutor.
0 Reviews
10+ Question Solved
Related Book For 
Question Posted:
