

The following graph shows how the body mass index-for-age percentile for girls varies from the age of
Question:
The following graph shows how the body mass index-for-age percentile for girls varies from the age of 2 to 20 years.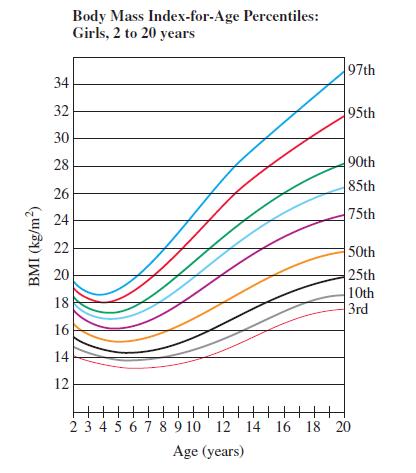
(a) Sketch a graph of the rate of change of the 95th percentile as a function of age.
(b) Sketch a graph of the rate of change of the 50th percentile as a function of age.
Fantastic news! We've Found the answer you've been seeking!
Step by Step Answer:
a b Rate o...View the full answer

Answered By
PALASH JHANWAR
I am a Chartered Accountant with AIR 45 in CA - IPCC. I am a Merit Holder ( B.Com ). The following is my educational details.
PLEASE ACCESS MY RESUME FROM THE FOLLOWING LINK: https://drive.google.com/file/d/1hYR1uch-ff6MRC_cDB07K6VqY9kQ3SFL/view?usp=sharing
3+ Reviews
10+ Question Solved
Related Book For 

Question Posted:
