

The graph of y = f(x) is shown. It cuts the axes at (0, 4) and (4,
Question:
The graph of y = f(x) is shown. It cuts the axes at (0, 4) and (4, 0).
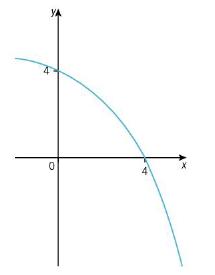
a) Sketch y = − 3f(x) and give the coordinates where the graph cuts the axes.
b) The graph of y = f(x) is transformed to the graph of y = f(− 1/2x). Describe fully
the two single transformations that have
been combined to give the resulting
transformation.
Fantastic news! We've Found the answer you've been seeking!
Step by Step Answer:
a To sketch the graph of y 3fx we need to reflect the original graph of y fx about the xaxis and str...View the full answer

Answered By
User l_917591
As a Business Management graduate from Moi University, I had the opportunity to work as a tutor for undergraduate students in the same field. This experience allowed me to apply the theoretical knowledge I had gained in a practical setting, while also honing my teaching and communication skills.
As a tutor, I was responsible for conducting tutorial sessions, grading assignments and exams, and providing feedback and support to my students. I also assisted with the preparation of course materials and collaborated with other tutors and professors to ensure consistency in teaching and assessment.
0 Reviews
10+ Question Solved
Related Book For 
Complete Pure Mathematics 1 For Cambridge International AS & A Level
ISBN: 9780198427438
2nd Edition
Authors: Jean Linsky, Brian Western, James Nicholson
Question Posted:
