

The following table presents the numbers of employees, by age group, who were promoted, or not promoted,
Question:
The following table presents the numbers of employees, by age group, who were promoted, or not promoted, in a sample drawn from a certain industry during the past year.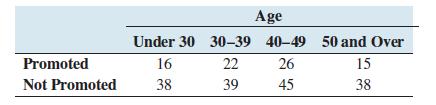
Can you conclude that the people in some age groups are more likely to be promoted than those in other age groups? Use the α = 0.05 level of significance.
Fantastic news! We've Found the answer you've been seeking!
Step by Step Answer:

Answered By
Sigei Kipngeno
I am a professional writer with more than 2 years of writing experience. I will always deliver a grade A paper with zero plagiarism . Thanks in advance.
175+ Reviews
311+ Question Solved
Related Book For 

Question Posted:
