

Draw a graph to illustrate the market equilibrium. On your graph, show the efficient quantity of water
Question:
Draw a graph to illustrate the market equilibrium. On your graph, show the efficient quantity of water taken.
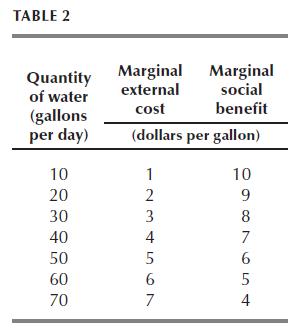
A natural spring runs under land owned by ten people. Each person has the right to sink a well and can take water from the spring at a constant marginal cost of $5 a gallon. Table 2 sets out the marginal external cost and the marginal social benefit from the water.
Fantastic news! We've Found the answer you've been seeking!
Step by Step Answer:
T he data points based on the provided information Quantity gallons per day 10 20 30 40 50 60 70 ...View the full answer

Answered By
Loise Ndungu
I have five years of experience as a writer. As I embark on writing your papers from the prologue to the epilogue, my enthusiasm is driven by the importance of producing a quality product. I put premium product delivery as my top priority, as this is what my clients are seeking and what makes me different from other writers. My goal is to craft a masterpiece each time I embark on a freelance work task! I'm a freelance writer who provides his customers with outstanding and remarkable custom writings on various subjects. Let's work together for perfect grades.
82+ Reviews
231+ Question Solved
Related Book For 

Question Posted:
