

The following table represents the observed frequencies for hypothetical data on housing status and having a car.
Question:
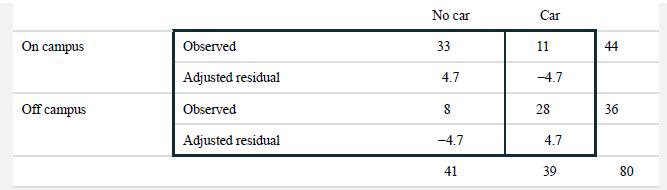
The following table represents the observed frequencies for hypothetical data on housing status and having a car. The table also includes the adjusted standardized residuals for each of the cells. Using this information and the criterion of 2, indicate for which of these cells there is a significant difference between the observed and the expected frequencies.
Fantastic news! We've Found the answer you've been seeking!
Step by Step Answer:
ANSWER To determine which cells have a significant difference between the observed and expected freq...View the full answer

Answered By
Abdul Wahab Qaiser
Before working at Mariakani, I volunteered at a local community center, where I tutored students from diverse backgrounds. I helped them improve their academic performance and develop self-esteem and confidence. I used creative teaching methods, such as role-playing and group discussions, to make the learning experience more engaging and enjoyable.
In addition, I have conducted workshops and training sessions for educators and mental health professionals on various topics related to counseling and psychology. I have presented research papers at conferences and published articles in academic journals.
Overall, I am passionate about sharing my knowledge and helping others achieve their goals. I believe that tutoring is an excellent way to make a positive impact on people's lives, and I am committed to providing high-quality, personalized instruction to my students.
0 Reviews
10+ Question Solved
Related Book For 

Statistics For The Behavioral Sciences
ISBN: 9781319190743
5th Edition
Authors: Susan A. Nolan, Thomas Heinzen
Question Posted:
