

Draw a graph to show the relationship between the price and the number of rides when the
Question:
Draw a graph to show the relationship between the price and the number of rides when the temperature is 20°C. Describe this relationship.
The table gives the price of a balloon ride, the temperature, and the number of rides a day.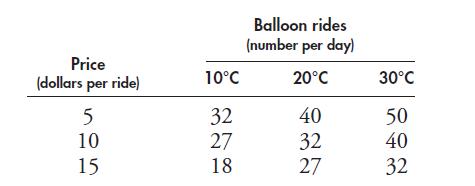
Fantastic news! We've Found the answer you've been seeking!
Step by Step Answer:
I can provide a description of the graph since Im not able to create visual content To graph the rel...View the full answer

Answered By
Muhammad Umair
I have done job as Embedded System Engineer for just four months but after it i have decided to open my own lab and to work on projects that i can launch my own product in market. I work on different softwares like Proteus, Mikroc to program Embedded Systems. My basic work is on Embedded Systems. I have skills in Autocad, Proteus, C++, C programming and i love to share these skills to other to enhance my knowledge too.
1+ Reviews
10+ Question Solved
Related Book For 

Microeconomics Canada In The Global Environment
ISBN: 9780321931184
9th Edition
Authors: Robin Bade, Michael Parkin
Question Posted:
