

Consider the graph shown in Figure 14.13. Figure 14. 13 a. What is being illustrated in this
Question:
Consider the graph shown in Figure 14.13.
Figure 14.13
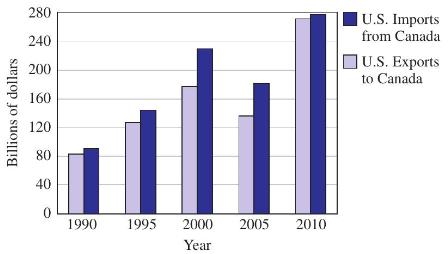
a. What is being illustrated in this graph?
b. Did the United States have more imports or exports for the years 1990-2010?
Fantastic news! We've Found the answer you've been seeking!
Step by Step Answer:
a The graph appears to be a bar chart that illustrates the trade between the United Sta...View the full answer

Answered By
Sidharth Jain
My name is Sidharth. I completed engineering from National Institute of Technology Durgapur which is one of the top college in India. I am currently working as an Maths Faculty in one of the biggest IITJEE institute in India. Due to my passion in teaching and Maths, I came to this field. I've been teaching for almost 3 years.
Apart from it I also worked as an Expert Answerer on Chegg.com. I have many clients from USA to whom I teach online and help them in their assignments. I worked on many online classes on mymathlab and webassign. I guarantee for grade 'A'.
3+ Reviews
10+ Question Solved
Related Book For 

Question Posted:
