Many populations grow exponentially. Here are the data for the estimated population of North America (in millions)
Question:
Many populations grow exponentially. Here are the data for the estimated population of North America (in millions) from 1700 to 2012. The dates are recorded as years since 1700 so that x = 312 is the year 2012.
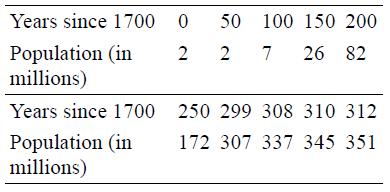
a. Use a logarithm to transform population size. Then calculate and state the least-squares regression line using the transformed variable.
b. Use your model from part (a) to predict the population size of North America in 2020.
Transcribed Image Text:
Years since 1700 0 50 100 150 200 Population (in millions) 2 2 7 26 82 Years since 1700 250 299 308 310 312 Population (in millions) 172 307 337 345 351
Fantastic news! We've Found the answer you've been seeking!
Step by Step Answer:
Answer rating: 90% (10 reviews)
a To find the leastsquares regression line using the transformed variable we can use linear regressi...View the full answer
Answered By
Dulal Roy
As a tutor, I have gained extensive hands-on experience working with students one-on-one and in small group settings. I have developed the ability to effectively assess my students' strengths and weaknesses, and to customize my teaching approach to meet their individual needs.
I am proficient at breaking down complex concepts into simpler, more digestible pieces, and at using a variety of teaching methods (such as visual aids, examples, and interactive exercises) to engage my students and help them understand and retain the material.
I have also gained a lot of experience in providing feedback and guidance to my students, helping them to develop their problem-solving skills and to become more independent learners. Overall, my hands-on experience as a tutor has given me a deep understanding of how to effectively support and encourage students in their learning journey.
0.00
0 Reviews
10+ Question Solved
Related Book For
Question Posted:
Students also viewed these Mathematics questions
-
Given here are the data for a dependent variable, y, and independent variables. Use these data to develop a regression model to predict y. Discuss theoutput. 643105180707 X-565465746796 412951829095...
-
Given here are the data for a dependent variable, y, and independent variables. Use these data to develop a regression model to predict y. Discuss theoutput. x1 14 51 17 48 29 29 16.4 56 17.164 18.2...
-
Given here are the data for a dependent variable, y, and independent variables. Use these data to develop a regression model to predict y. Discuss the output. Which variable is an indicator variable?...
-
Graph the solution sets in Problems 316. x 100
-
Explain carefully why your answers to Exercise 18 are both correct even though there appear to be differences. In Exercise 18 121 101
-
When PPE is acquired through issuing common stock, how is the acquisition recorded? Select one: a. The par or stated value of the stock is the amount credited to the Common Stock account. b. The...
-
Summarize ways you can lower lender risk to increase your chances of getting a loan at a lower interest rate?
-
Tiger Corporation purchases 1,200,000 units per year of one component. The fixed cost per order is $25. The annual carrying cost of the item is 27% of its $2 cost. a. Determine the EOQ under each of...
-
On the first day of the fiscal year, a company issues a $2,000,000, 8%, 5 year bond that pays semiannual interest of $80,000 ($2,000,000 X 8% X 1/2), receiving cash of $2,170,604. Journalize the bond...
-
After looking at the projections of the HomeNet project, you decide that they are not realistic. It is unlikely that sales will be constant over the four-year life of the project. Furthermore, other...
-
Many populations grow exponentially. Here are the data for the estimated population of Europe (in millions) from 1700 to 2012. The dates are recorded as years since 1700 so that x = 312 is the year...
-
Ecologists look at data to learn about natures patterns. One pattern they have identified relates the size of a carnivore (body mass in kilograms) to how many of those carnivores exist in an area. A...
-
Refer to Question 15-13. What type of responsibility center would you recommend the company make Alpha Division? Beta Division? Explain your reasons. Data From Question 15-13: Alpha Division and Beta...
-
A converging lens with a focal length of 9.50 cm forms an image of a 4.40-mm-tall real object that is to the left of the lens. The image is 1.20 cm tall and erect. a. Where is the object located? b....
-
What reasons might exist for initiating a Project evaluation? When might a Project evaluation be inappropriate? What steps or activities are involved in planning how to conduct a Project evaluation?
-
A flat slab of styrofoam, with a density of 45 kg/m, floats on a lake. (Assume this is a freshwater lake so the water's density is 1000 kg/m.) What minimum volume must the slab have so that a 35 kg...
-
A galaxy cluster has a galaxy behind it whose image we see as being smeared out and curved, with an angular radius of curvature on the sky of E. The background galaxy is at redshift zgal and the...
-
When someone is working on understanding themselves, what component of authentic leadership is being practiced? Give examples.
-
Sonya worked cleaning homes for 30 years so she could send her two children to college. Several times, she had been forced to call her employers to tell them she could not come in to work because one...
-
How can a promoter avoid personal liability for pre-incorporation contracts?
-
An integrated circuit contains 10 million logic gates (each can be a logical AND or OR circuit). Assume the probability of a gate failure is p and that the failures are independent. The integrated...
-
The following table provides data on wafers categorized by location and contamination levels. Let A denote the event that contamination is low, and let B denote the event that the location is center....
-
The following table provides data on wafers categorized by location and contamination levels. More generally, let the number of wafers with low contamination from the center and edge locations be...
-
Lab 3 Computer and Network Security INFO24178 Description For this lab, we seek to practice Chapter 6 and 7 concepts. For this lab use the installed Windows 10 in Lab 1. Task 1-30 marks Chapter 6:...
-
If a cyclone damages cotton crop, which is used for making sweatshirts, Question 2 5 options: The demand curve will shift to the right. The supply curve will shift to the left. The supply curve will...
-
The aggregate demand curve shows the relationship between planned purchases of Group of answer choices all final goods and services and interest rates. all final goods and services and total planned...
Study smarter with the SolutionInn App