

1. Refer to the travel-time graph. What is the distance from the epicenter to the station that...
Question:
1. Refer to the travel-time graph. What is the distance from the epicenter to the station that recorded the earthquake in Figure 3?
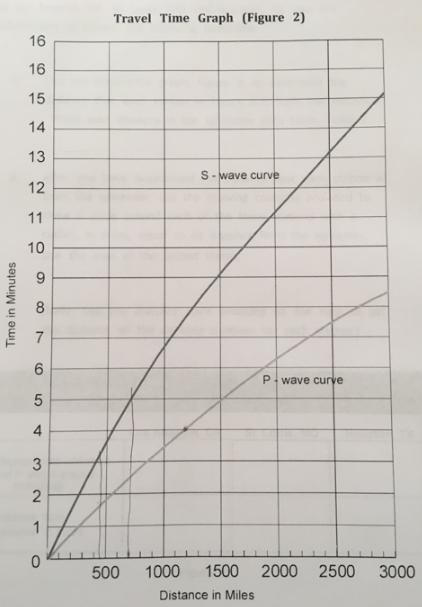
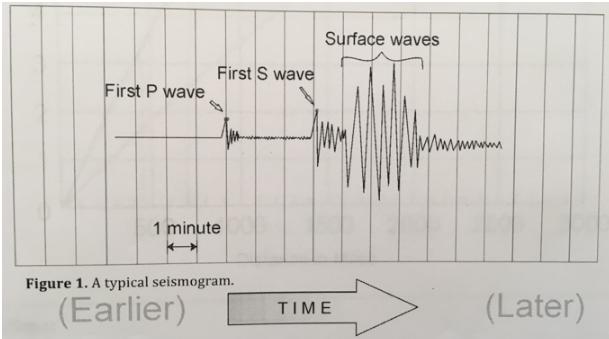
2. From the travel-time (minutes) axis of the travel-time graph, the first P waves from the seismographs in Figure 3 arrived at the recording station approximately (3, 7, 14) minutes after the earth-quake occurred. Circle your answer.
3. If the first P wave was recorded at 1039 P.M. local time at the station in Figure 3, what was the local time when the earthquake actually occurred? P.M. local time Figure 7 illustrates seismographs for the same earthquake recorded at New York, Seattle, and Mexico City. Use this information to answer questions]2-16.
4. Use the travel-time graph, Figure 5, to determine the distance that each station in Figure 7 is from the epicenter. Write your answers in the epicenter data table, Table 1.
5. After referring to an atlas or wall map, accurately place a small dot showing the location of each of the three stations on the map provided in Figure 8. Also label each of the three cities.
6. On Figure 8, use a drawing compass to draw a circle around each of the three stations with a radius, in miles, equal to its distance from the epicenter. (Note: Use the distance scale provided on the map to set the distance on the drawing com-pass for each station.)
7. What is the approximate latitude and longitude of the epicenter of the earthquake that was recorded by the three stations?
8. Note on the seismographs that the first P wave was recorded in New York at 9:01 Coordinated Universal lime (UTC, the international standard on which most nations base their civil time). At what time (UTC) did the earthquake actually occur? ________UTC
Expert Answer:


Fundamentals of Physics
ISBN: 978-0471758013
8th Extended edition
Authors: Jearl Walker, Halliday Resnick
