

Suppose that the market for sports watches is a competitive market. The following graph shows the daily
Question:
Suppose that the market for sports watches is a competitive market. The following graph shows the daily cost curves of a firm operating in this market
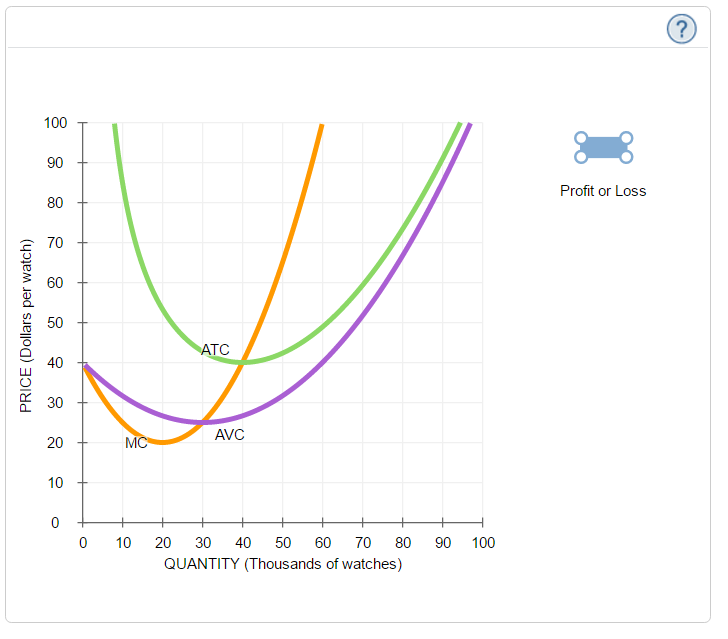
In the short run, at a market price of $80 per watch, this firm will choose to produce 10000/30000/40000/55000watches per day.
On the previous graph, use the blue rectangle (circle symbols) to shade the area representing the firm's profit or loss if the market price is $80 and the firm chooses to produce the quantity you already selected.
Note: In the following question, you should enter a positive number in the numeric entry field.
The area of this rectangle indicates that the firm?s profit /economic loss would be $ per day.
Expert Answer:
The market price is 80 The marginal cost is 80 when the quantity level is 550... View the full answer


Microeconomics Theory and Applications
ISBN: 978-1118758878
12th edition
Authors: Edgar K. Browning, Mark A. Zupan
