The following graph shown the daily market for jeans. Suppose the government institutes a tax of $40.60
Question:
The following graph shown the daily market for jeans. Suppose the government institutes a tax of $40.60 per pair. The places a wedge between the price buyers pay and the price sellers receive.
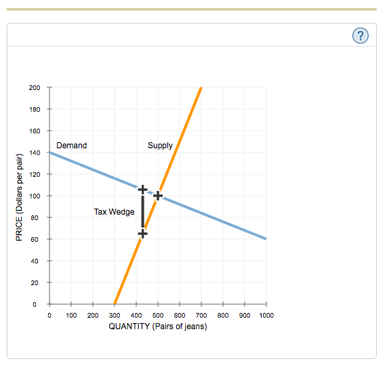
Fill in the following table with the quantity sold, the price buyers pay, and the price sellers receive before and after the tax.
| Quantity | Price Buyers Pay | Price Sellers Receive | |
| (Pairs of jeans) | (Dollars per pair) | (Dollars per pair) | |
| Before Tax | |||
| After Tax |
Using the data you entered in the previous table, calculate the tax burden that falls on buyers and on sellers, respectively, and calculate the price elasticity of demand and supply over the relevant ranges using the midpoint method. Enter your results in the following table.
| Tax Burden | Elasticity | |
| (Dollars per pair) | ||
| Buyers | ||
| Sellers |
The burden of the tax falls more heavily on the---------- elastic side of the market.
Expert Answer:
Values in the graph are not clear so I am taking values written in the graph and market it as A ... View the full answer