

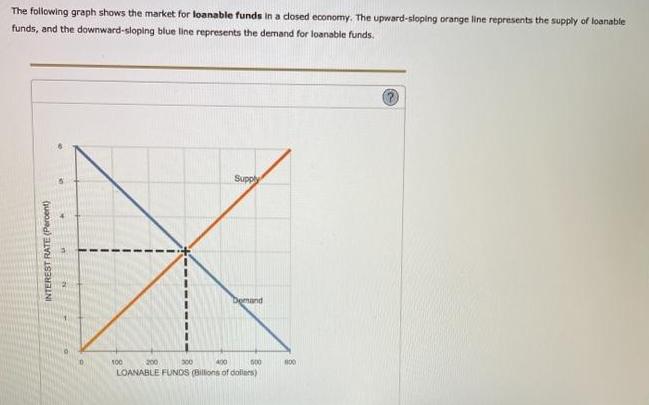
The following graph shows the market for loanable funds in a dosed economy. The upward-sloping orange...
Fantastic news! We've Found the answer you've been seeking!
Question:
Transcribed Image Text:
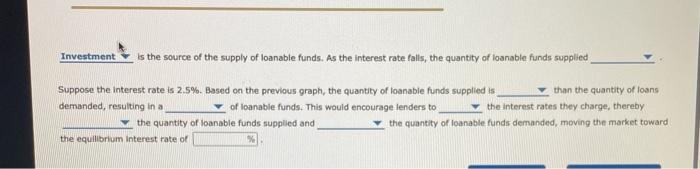
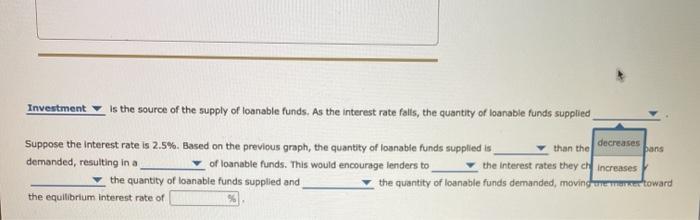
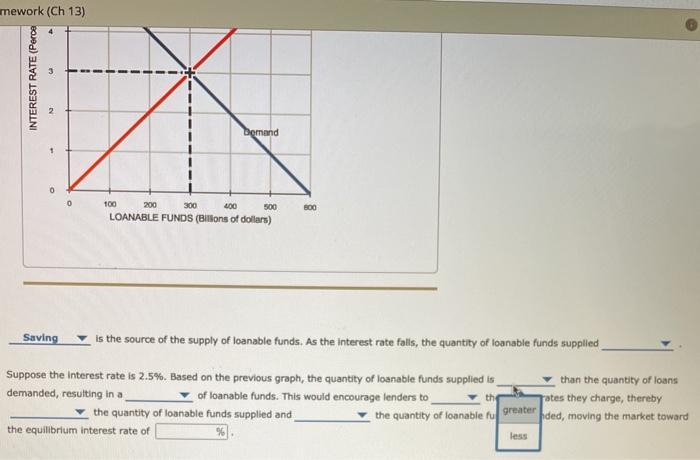
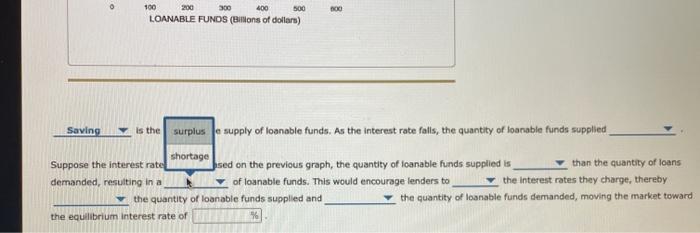
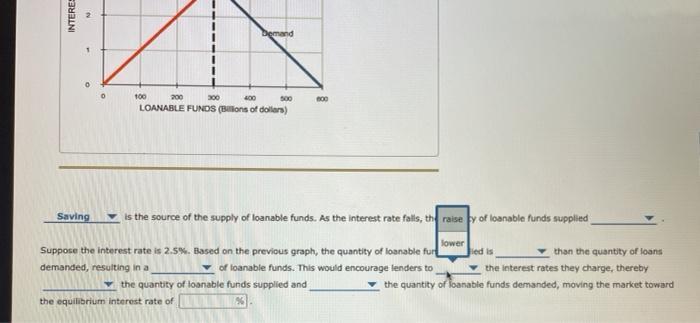
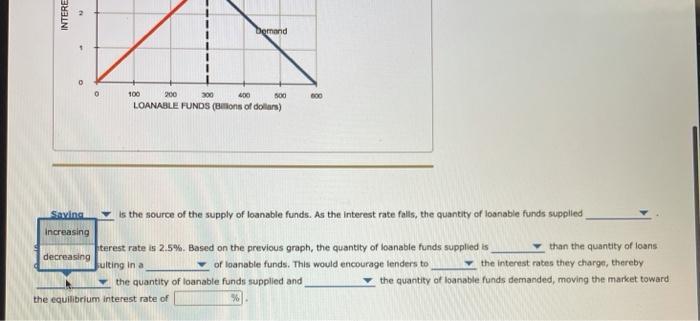
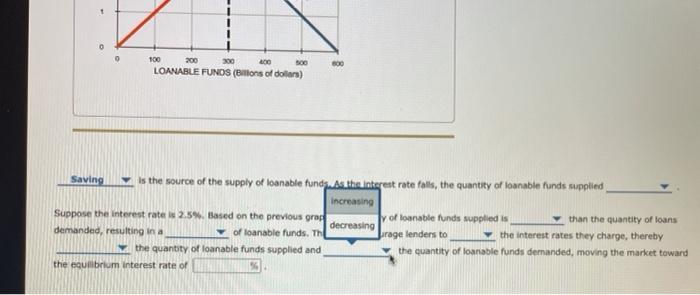
The following graph shows the market for loanable funds in a dosed economy. The upward-sloping orange line represents the supply of loanable funds, and the downward-sloping blue line represents the demand for loanable funds. Supply Demand 100 200 300 400 s00 LOANABLE FUNDS (BIllons of dollars) INTEREST RATE (Percent) Investment is the source of the supply of loanable funds. As the interest rate falls, the quantity of loanable funds supplied Suppose the interest rate is 2.5%. Based on the previous graph, the quantity of loanable funds supplied is demanded, resulting in a than the quantity of loans v of loanable funds. This would encourage lenders to v the interest rates they charge, thereby V the quantity of loanable funds supplied and the quantity of loanable funds demanded, moving the market toward the equilibrium interest rate of Investment Is the source of the supply of loanable funds. As the interest rate falls, the quantity of loanable funds supplied Suppose the Interest rate is 2.5%. Based on the previous graph, the quantity of loanable funds supplied is than the decreases pans demanded, resulting in a of loanable funds. This would encourage lenders to the interest rates they ch increases the quantity of loanable funds supplied and the quantity of loanable funds demanded, moving emanertoward the equilibrium Interest rate of mework (Ch 13) bemand 100 200 300 400 500 600 LOANABLE FUNDS (BIllons of dollars) Saving is the source of the supply of loanable funds. As the interest rate falls, the quantity of loanable funds supplied Suppose the interest rate is 2.5%. Based on the previous graph, the quantity of loanable funds supplied is than the quantity of loans demanded, resulting in a of loanable funds. This would encourage lenders to the greater rates they charge, thereby the quantity of loanable funds supplied and the quantity of loanable fu ded, moving the market toward the equilibrlum interest rate of less INTEREST RATE (Perce 100 200 300 400 500 LOANABLE FUNDS (BIlons of dollars) Saving is the surplus e supply of loanable funds. As the interest rate falls, the quantity of loanable funds supplied shortage Suppose the interest rate sed on the previous graph, the quantity of loanable funds supplied is than the quantity of loans demanded, resulting in a v of loanable funds. This would encourage lenders to the interest rates they charge, thereby v the quantity of loanable funds supplied and the quantity of loanable funds demanded, moving the market toward the equilibrium interest rate of Demand 100 200 300 400 500 LOANABLE FUNDS (Blons of dollars) Saving is the source of the supply of loanable funds. As the interest rate falls, the raise y of loanable funds supplied lower Suppose the interest rate is 2.5%. Based on the previous graph, the quantity of loanable fur ied is than the quantity of loans demanded, resulting in a v of loanable funds. This would encourage lenders to v the interest rates they charge, thereby - the quantity of loanable funds demanded, moving the market toward Y the quantity of loanable funds supplied and the equilibrium interest rate of INTERE Demand 100 200 300 400 500 600 LOANABLE FUNDS (Blons of dollars) Saving is the source of the supply of loanable funds. As the interest rate falls, the quantity of loanable funds supplied increasing terest rate is 2.5%. Based on the previous graph, the quantity of loanable funds supplied is v of loanable funds. This would encourage lenders to than the quantity of loans decreasing sulting in a v the interest rates they charge, thereby the quantity of loanable funds supplied and the quantity of loanable funds demanded, moving the market toward the equilibrium interest rate of INTERE 100 200 300 400 s00 600 LOANABLE FUNDS (BIllons of dollars) Saving is the source of the supply of loanable funds. As the interest rate falls, the quantity of loanable funds supplied increasing Suppose the interest rate is 2.5%. Based on the previous grap y of loanable funds supplied is than the quantity of loans v the interest rates they charge, thereby the quantity of loanable funds demanded, moving the market toward decreasing demanded, resulting in a v of loanable funds. Th Jarage lenders to the quantity of loanable funds supplied and the equilibrium interest rate of The following graph shows the market for loanable funds in a dosed economy. The upward-sloping orange line represents the supply of loanable funds, and the downward-sloping blue line represents the demand for loanable funds. Supply Demand 100 200 300 400 s00 LOANABLE FUNDS (BIllons of dollars) INTEREST RATE (Percent) Investment is the source of the supply of loanable funds. As the interest rate falls, the quantity of loanable funds supplied Suppose the interest rate is 2.5%. Based on the previous graph, the quantity of loanable funds supplied is demanded, resulting in a than the quantity of loans v of loanable funds. This would encourage lenders to v the interest rates they charge, thereby V the quantity of loanable funds supplied and the quantity of loanable funds demanded, moving the market toward the equilibrium interest rate of Investment Is the source of the supply of loanable funds. As the interest rate falls, the quantity of loanable funds supplied Suppose the Interest rate is 2.5%. Based on the previous graph, the quantity of loanable funds supplied is than the decreases pans demanded, resulting in a of loanable funds. This would encourage lenders to the interest rates they ch increases the quantity of loanable funds supplied and the quantity of loanable funds demanded, moving emanertoward the equilibrium Interest rate of mework (Ch 13) bemand 100 200 300 400 500 600 LOANABLE FUNDS (BIllons of dollars) Saving is the source of the supply of loanable funds. As the interest rate falls, the quantity of loanable funds supplied Suppose the interest rate is 2.5%. Based on the previous graph, the quantity of loanable funds supplied is than the quantity of loans demanded, resulting in a of loanable funds. This would encourage lenders to the greater rates they charge, thereby the quantity of loanable funds supplied and the quantity of loanable fu ded, moving the market toward the equilibrlum interest rate of less INTEREST RATE (Perce 100 200 300 400 500 LOANABLE FUNDS (BIlons of dollars) Saving is the surplus e supply of loanable funds. As the interest rate falls, the quantity of loanable funds supplied shortage Suppose the interest rate sed on the previous graph, the quantity of loanable funds supplied is than the quantity of loans demanded, resulting in a v of loanable funds. This would encourage lenders to the interest rates they charge, thereby v the quantity of loanable funds supplied and the quantity of loanable funds demanded, moving the market toward the equilibrium interest rate of Demand 100 200 300 400 500 LOANABLE FUNDS (Blons of dollars) Saving is the source of the supply of loanable funds. As the interest rate falls, the raise y of loanable funds supplied lower Suppose the interest rate is 2.5%. Based on the previous graph, the quantity of loanable fur ied is than the quantity of loans demanded, resulting in a v of loanable funds. This would encourage lenders to v the interest rates they charge, thereby - the quantity of loanable funds demanded, moving the market toward Y the quantity of loanable funds supplied and the equilibrium interest rate of INTERE Demand 100 200 300 400 500 600 LOANABLE FUNDS (Blons of dollars) Saving is the source of the supply of loanable funds. As the interest rate falls, the quantity of loanable funds supplied increasing terest rate is 2.5%. Based on the previous graph, the quantity of loanable funds supplied is v of loanable funds. This would encourage lenders to than the quantity of loans decreasing sulting in a v the interest rates they charge, thereby the quantity of loanable funds supplied and the quantity of loanable funds demanded, moving the market toward the equilibrium interest rate of INTERE 100 200 300 400 s00 600 LOANABLE FUNDS (BIllons of dollars) Saving is the source of the supply of loanable funds. As the interest rate falls, the quantity of loanable funds supplied increasing Suppose the interest rate is 2.5%. Based on the previous grap y of loanable funds supplied is than the quantity of loans v the interest rates they charge, thereby the quantity of loanable funds demanded, moving the market toward decreasing demanded, resulting in a v of loanable funds. Th Jarage lenders to the quantity of loanable funds supplied and the equilibrium interest rate of
Expert Answer:
Answer rating: 100% (QA)
a Saving is the source of the loanable funds b As the interest rate falls the quantity ... View the full answer

Posted Date:
Students also viewed these marketing questions
-
The most likely reason is because of our supply and demand for questions. There are two scenarios: You have skipped through all available questions Once a question is skipped, it will never come back...
-
The following graph represents the domestic supply and demand for coal. a. In the absence of trade, what is the equilibrium price and equilibrium quantity? b. The government opens the market to free...
-
The weekly supply and demand for fast-food cheeseburgers in your city is shown in Figure 6P-3. In an effort to curb a looming budget deficit, the mayor recently proposed a tax that would be levied on...
-
Given the following data: Calculate ÎH for the reaction On the basis of enthalpy change, is this a useful reaction for the synthesis of ammonia? AH - 92 kJ () + AH = -484 k (g) ON OH 88
-
The Urban Florist is a wholesale shop that sells flowers, plants, and plant supplies. Transactions involving sales and cash receipts for the firm during May 2016 follow. The firm sells its...
-
Record the following note receivable transactions in the journal of Coral Realty. How much interest revenue did Coral earn this year? Use a 365-day year for interest computations, and round interest...
-
Why do short-term decisions have long-term implications for an organisation?
-
On March 1, 2015, Zephur Winds Ltd. purchased a machine for $80,000 by paying $20,000 down and issuing a note for the balance. The machine had an estimated useful life of nine years and an estimated...
-
Find the length of segment XY. X 6 Z nswer: 6 12
-
Harold earns a salary of $200,000 from EMK enterprises as an officer during this year for the first 11 months of the year. Harold withholds OASDI (Social Security) taxes in the amount of $9,932.40....
-
An organisation should be capable to tolerate a fault in its network and information system. How can fault tolerance be achieved through redundancy? How can redundancy be implemented in servers,...
-
John and Julie Waters are both employed. John is a credit analyst with City Bank and Julie is a speech therapist. Both work for employers that offer 401(k) plans. John will make $92,500 as a credit...
-
Giancarlo has received a special order for 500 units of its product at a special price of $3,800. The product normally sells for $5,000 and has the following manufacturing CostS-Direct...
-
13. Transmissible spongiform encephalopathies are caused by a. flavoviruses. U S N T O b. virusoids. c. prions. d. orthomyxoviruses. 14.The most common viruses causing respiratory illness belong to...
-
What differences are there in unemployment rates by gender, age and educational attainment. What explanation is there for the variations in unemployment over time and the variation in unemployment by...
-
10. Brown algae are commonly referred to as a. Phaeophyta. b. Rhodophyta. c. Chlorophyta. d. Chrysophyta. 11. Which of the following microorganisms require a moist environment to survive and most...
-
Required information [The following information applies to the questions displayed below] The following information is available for ADT Company, which produces special-order security products and...
-
A sample statistic will not change from sample to sample. Determine whether the statement is true or false. If it is false, rewrite it as a true statement.
-
The Luxon Company produces industrial and residential lighting fixtures at its manufacturing facility in Calgary. Shipment of company products to an eastern warehouse is presently handled by common...
-
Tsumagari Company, an electronics company in Kobe, Japan, is planning to buy new equipment to produce a new product. Estimated data (monetary amounts are in thousands of Japanese yen) are: Assume a...
-
Assume that income tax rates are 30 percent and that the asset qualifies for a 25 percent declining balance, and the required rate of return is 10 percent. 1. The book value of an old machine is...

Study smarter with the SolutionInn App