

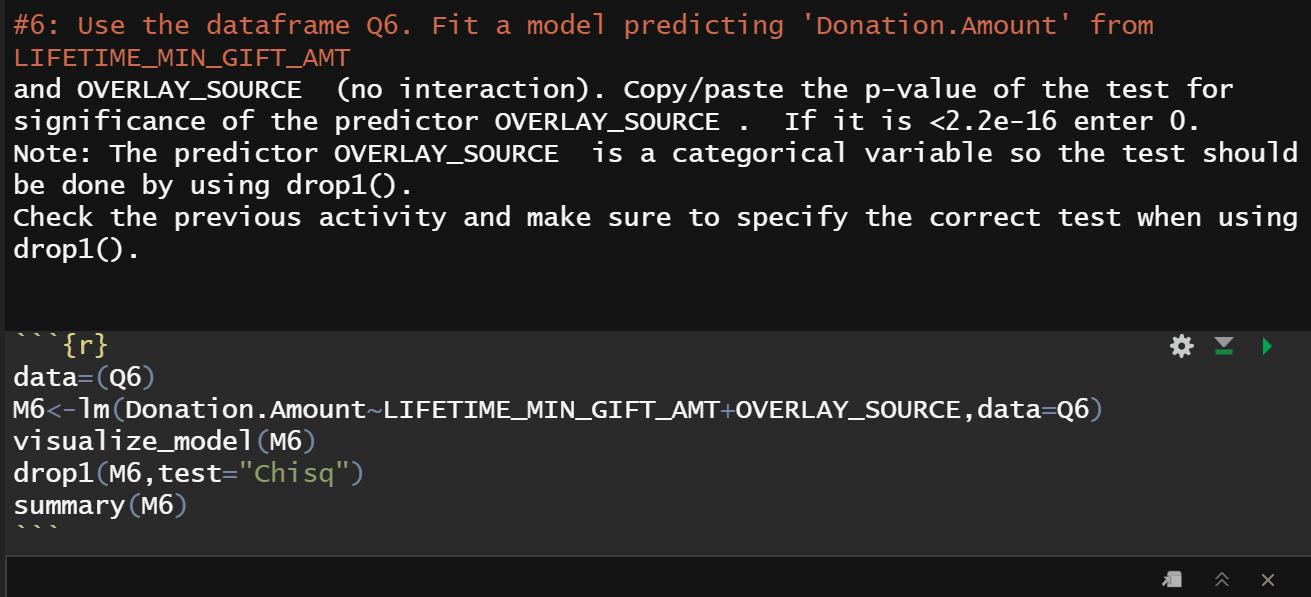
#6: Use the dataframe Q6. Fit a model predicting 'Donation. Amount' from LIFETIME_MIN_GIFT_AMT and OVERLAY_SOURCE (no...
Fantastic news! We've Found the answer you've been seeking!
Question:
Transcribed Image Text:
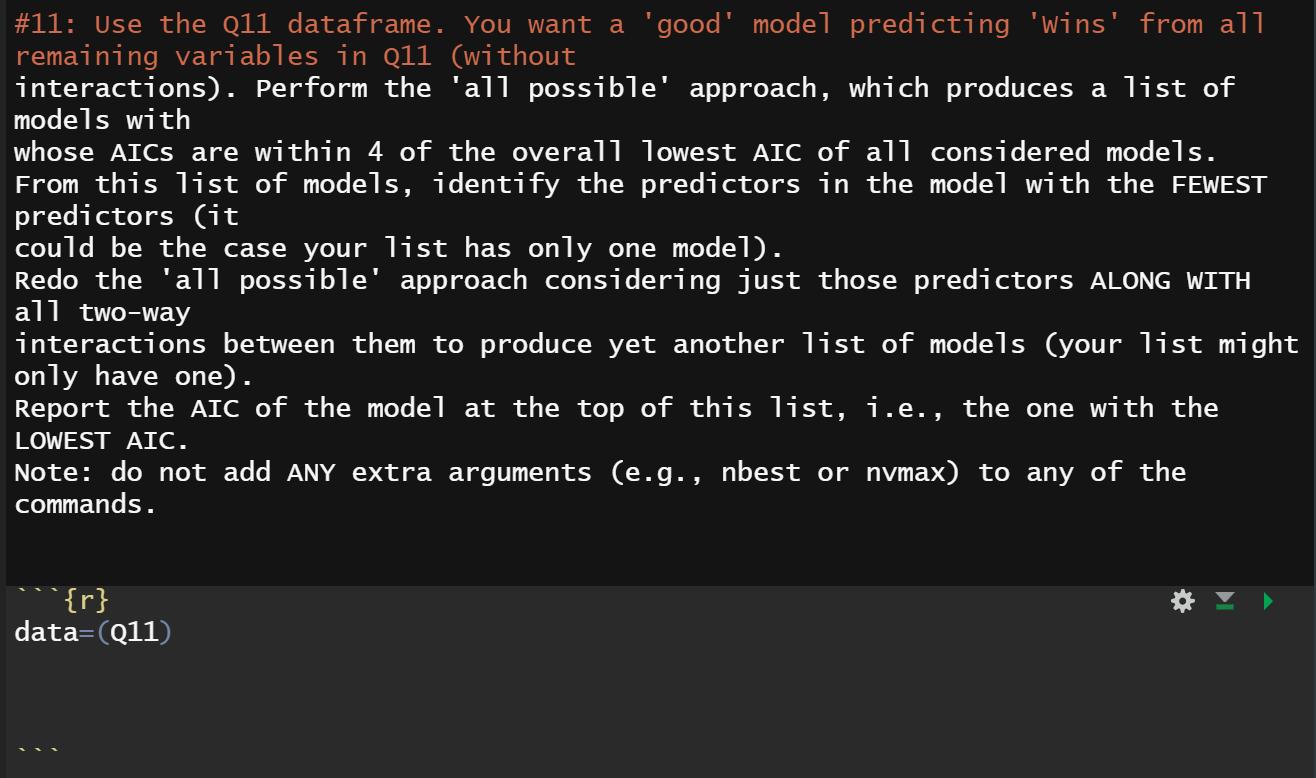
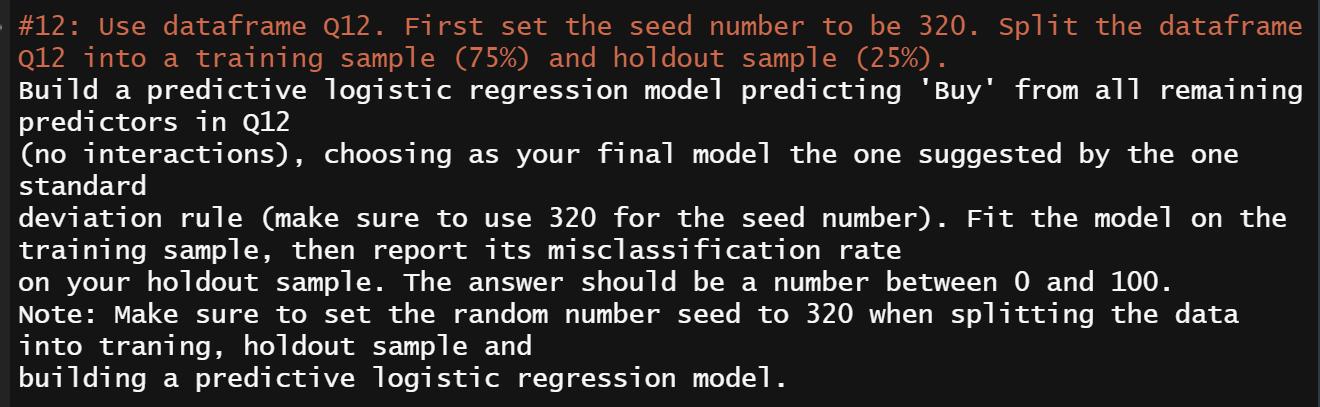
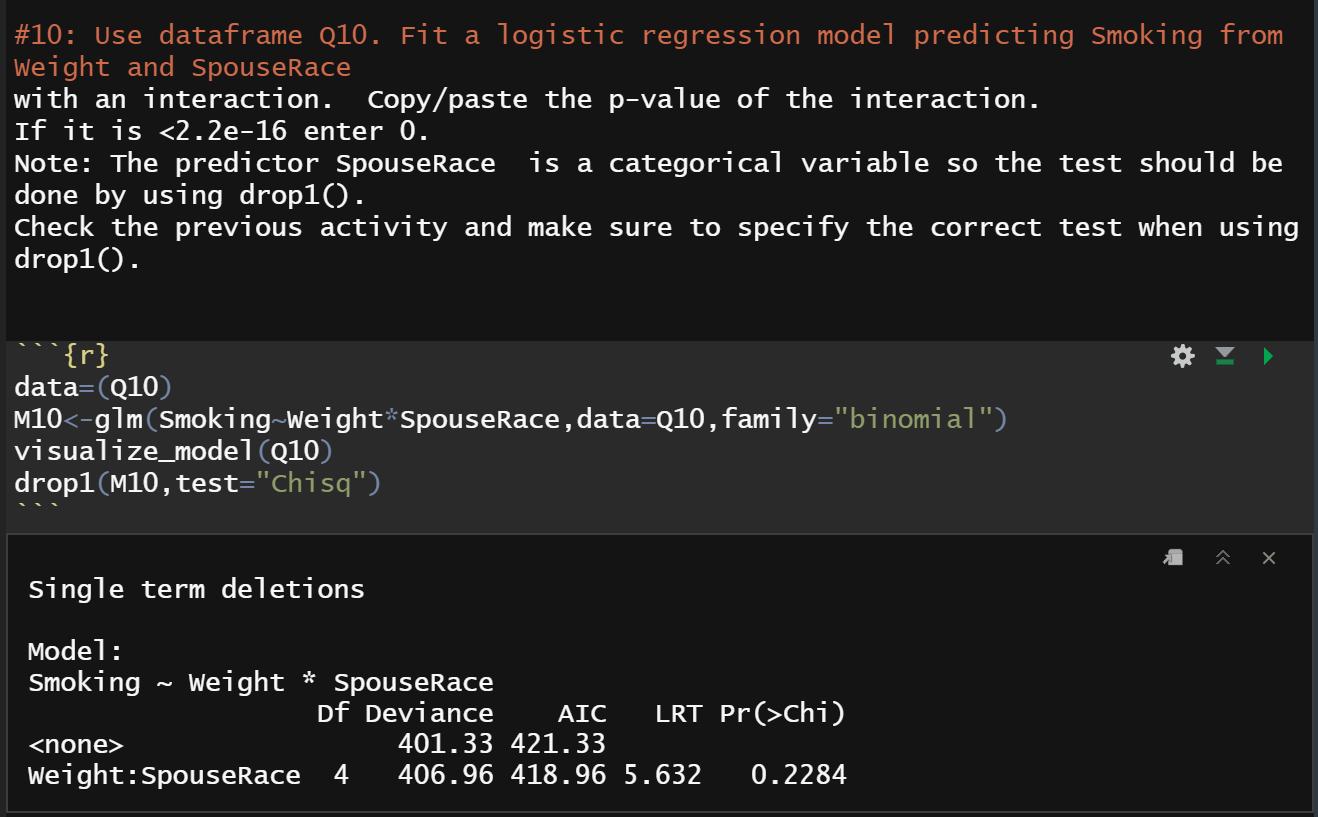
#6: Use the dataframe Q6. Fit a model predicting 'Donation. Amount' from LIFETIME_MIN_GIFT_AMT and OVERLAY_SOURCE (no interaction). Copy/paste the p-value of the test for If it is <2.2e-16 enter 0. is a categorical variable so the test should significance of the predictor OVERLAY_SOURCE Note: The predictor OVERLAY_SOURCE be done by using drop1(). Check the previous activity and make sure to specify the correct test when using drop1(). {r} data=(Q6) M6<-1m(Donation.Amount-LIFETIME_MIN_GIFT_AMT+OVERLAY_SOURCE, data=Q6) visualize_model (M6) drop1(M6, test="chisq") summary (M6) #11: Use the Q11 dataframe. You want a 'good' model predicting 'wins' from all remaining variables in Q11 (without interactions). Perform the 'all possible' approach, which produces a list of models with whose AICS are within 4 of the overall lowest AIc of all considered models. From this list of models, identify the predictors in the model with the FEWEST predictors (it could be the case your list has only one model). Redo the 'al1 possible' approach considering just those predictors ALONG WITH all two-way interactions between them to produce yet another list of models (your list might only have one). Report the AIC of the model at the top of this list, i.e., the one with the LOWEST AIC. Note: do not add ANY extra arguments (e.g., nbest or nvmax) to any of the commands. ` {r} data=(Q11) #12: Use dataframe Q12. First set the seed number to be 320. Split the dataframe Q12 into a training sample (75%) and holdout sample (25%). Build a predictive logistic regression model predicting 'Buy' from all remaining predictors in Q12 (no interactions), choosing as your final model the one suggested by the one standard deviation rule (make sure to use 320 for the seed number). Fit the model on the training sample, then report its misclassification rate on your holdout sample. The answer should be a number between 0 and 100. Note: Make sure to set the random number seed to 320 when splitting the data into traning, holdout sample and building a predictive logistic regression model. #10: Use dataframe Q10. Fit a logistic regression model predicting Smoking from Weight and SpouseRace with an interaction. Copy/paste the p-value of the interaction. If it is <2.2e-16 enter 0. Note: The predictor SpouseRace is a categorical variable so the test should be done by using drop1(). Check the previous activity and make sure to specify the correct test when using drop1(). `{r} data=(Q10) M10<-glm(Smoking-Weight*SpouseRace, data=Q10,family="binomial") visualize_model (Q10) drop1 (M10, test="chisq") Single term deletions Model: Smoking - Weight * SpouseRace Df Deviance AIC LRT Pr(>Chi) <none> 401.33 421.33 Weight:SpouseRace 4 406.96 418.96 5.632 0.2284 #6: Use the dataframe Q6. Fit a model predicting 'Donation. Amount' from LIFETIME_MIN_GIFT_AMT and OVERLAY_SOURCE (no interaction). Copy/paste the p-value of the test for If it is <2.2e-16 enter 0. is a categorical variable so the test should significance of the predictor OVERLAY_SOURCE Note: The predictor OVERLAY_SOURCE be done by using drop1(). Check the previous activity and make sure to specify the correct test when using drop1(). {r} data=(Q6) M6<-1m(Donation.Amount-LIFETIME_MIN_GIFT_AMT+OVERLAY_SOURCE, data=Q6) visualize_model (M6) drop1(M6, test="chisq") summary (M6) #11: Use the Q11 dataframe. You want a 'good' model predicting 'wins' from all remaining variables in Q11 (without interactions). Perform the 'all possible' approach, which produces a list of models with whose AICS are within 4 of the overall lowest AIc of all considered models. From this list of models, identify the predictors in the model with the FEWEST predictors (it could be the case your list has only one model). Redo the 'al1 possible' approach considering just those predictors ALONG WITH all two-way interactions between them to produce yet another list of models (your list might only have one). Report the AIC of the model at the top of this list, i.e., the one with the LOWEST AIC. Note: do not add ANY extra arguments (e.g., nbest or nvmax) to any of the commands. ` {r} data=(Q11) #12: Use dataframe Q12. First set the seed number to be 320. Split the dataframe Q12 into a training sample (75%) and holdout sample (25%). Build a predictive logistic regression model predicting 'Buy' from all remaining predictors in Q12 (no interactions), choosing as your final model the one suggested by the one standard deviation rule (make sure to use 320 for the seed number). Fit the model on the training sample, then report its misclassification rate on your holdout sample. The answer should be a number between 0 and 100. Note: Make sure to set the random number seed to 320 when splitting the data into traning, holdout sample and building a predictive logistic regression model. #10: Use dataframe Q10. Fit a logistic regression model predicting Smoking from Weight and SpouseRace with an interaction. Copy/paste the p-value of the interaction. If it is <2.2e-16 enter 0. Note: The predictor SpouseRace is a categorical variable so the test should be done by using drop1(). Check the previous activity and make sure to specify the correct test when using drop1(). `{r} data=(Q10) M10<-glm(Smoking-Weight*SpouseRace, data=Q10,family="binomial") visualize_model (Q10) drop1 (M10, test="chisq") Single term deletions Model: Smoking - Weight * SpouseRace Df Deviance AIC LRT Pr(>Chi) <none> 401.33 421.33 Weight:SpouseRace 4 406.96 418.96 5.632 0.2284
Expert Answer:

Related Book For 

Statistics Unlocking the Power of Data
ISBN: 978-1118583104
1st edition
Authors: Robin H. Lock, Patti Frazer Lock, Kari Lock Morgan, Eric F. Lock, Dennis F. Lock
Posted Date:
Students also viewed these mathematics questions
-
Is this an effective model for predicting horse prices? Write down the relevant hypotheses as well as a conclusion based on the ANOVA table. Use information in the ANOVA table below, which comes from...
-
If P = 6 kN, x = 0.75 m and y = 1 m, determine the tension developed in cables AB, CD, and EF. Neglect the weight of theplate. D. 2 m
-
The model using 12 squared and interaction variables has the smallest s. However, if we desire a somewhat simpler model, note that s does not increase substantially until we move from a model having...
-
Why would you use a prospective overhead rate to accumulate the overhead costs of a job?
-
Explain why Web-based customer interaction centers are critical for successful CRM systems?
-
3. (17 points) You are doing a corporate valuation of Mistletoe Corporation and have the following information on the company: Number of shares of common stock outstanding (million): 10.0 Current...
-
Visit the Web sites listed here and write a report describing the information provided on each site about information security that would be most useful to an auditor: The SANS Institute...
-
Calculating Project Cash Flow from Assets In the previous problem, suppose the project requires an initial investment in net working capital of $300,000 and the fixed asset will have a market value...
-
According to Modigliani and Miller s Proposition II without taxes: According to Modigliani and Miller s Proposition II without taxes: Corporate leverage is determined by balancing the tax - saving...
-
Alexander Smith and his wife Allison are married and file a joint tax return for 2019. The Smiths live at 1234 Buena Vista Drive, Orlando, FL 32830. Alexander is a commuter airline pilot but took 6...
-
For the following symmetrical distributions, evaluate each for the type of kurtosis: a. M=50, Mdn=50, Mo=50, R=100, SD=2 b. M=500, Mdn=500, Mo=500, R=600, SD=100 c. M=100, Mdn=100, Mo=100, R=60, SD=25
-
Explain the nature and advantages of experimentation in health psychology and epidemiological research.?
-
John Fleming, chief administrator for Valley View Hospital, is concerned about the costs for tests in the hospital's lab. Charges for lab tests are consistently higher at Valley View than other...
-
Sunland Company incurs these expenditures in purchasing a truck: cash price $ 2 7 , 2 0 0 , accident insurance ( during use ) $ 1 , 5 7 0 , sales taxes $ 1 , 2 2 4 , motor vehicle license $ 6 7 0 ,...
-
In C++ Create an object oriented template custom array that uses inheritance to create ordered and unordered array implementations. To clarify, you should have some Array base class and the...
-
For the vectors A, B, C in the figure below (8 = 33, 03 = 59), find the following scalar products. (a) A.B (b) B.C (c) A-C B (15.0 m) 82 Z 83 (12.0 m) m m 3 m A (8.00 m)
-
Use the information in the table to find the expected loss amount for a borrower in risk class 7, assuming that loss-given- default is in class 2. The loan amount is $250,000. Expected Loss Rate LGD...
-
The tractor is used to lift the 150-kg load B with the 24-mlong rope, boom, and pulley system. If the tractor travels to the right at a constant speed of 4 m/s, determine the tension in the rope when...
-
Using the data in NutritionStudy, we show computer output for a model to predict calories consumed in a day based on fat grams consumed in a day, cholesterol consumed in mg per day, and age in years:...
-
Test whether people with a specific genetic marker are more likely to have suffered from clinical depression than people without the genetic marker, using the information that 38% of the 42 people in...
-
Indicate whether the five number summary corresponds most likely to a distribution that is skewed to the left, skewed to the right, or symmetric. (15, 25, 30, 35, 45)
-
Match the concept listed in items 1 through 6 with the most appropriate description listed in items a through \(f\). Description Concept 1. Enterprise Resource Planning (ERP) a. system 2. Brands of...
-
Indicate which type of data analytics, 1 through 4, is described in each of the following statements, a through \(h\). Data Analytics 1. Descriptive analytics 2. Diagnostic analytics 3. Predictive...
-
Match each item in the value chain, 1 through 7 , with an impact of an artificial intelligence initiative, choosing from items a through g. Value Chain 1. Research and development 2. Design 3. Supply...

Study smarter with the SolutionInn App