

a) A researcher investigating the factors determining wages estimates models (1) and (2) below using information...
Fantastic news! We've Found the answer you've been seeking!
Question:
Transcribed Image Text:
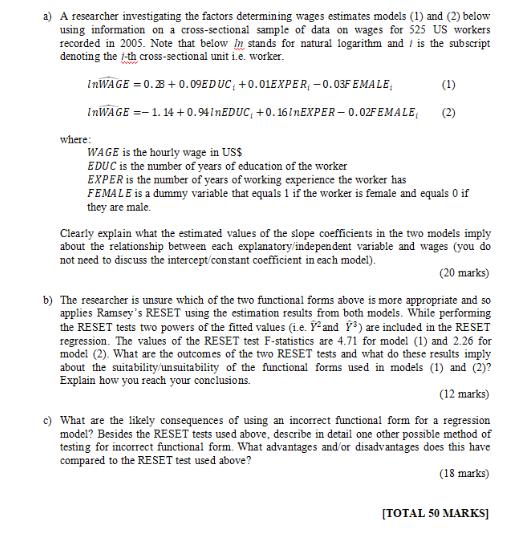
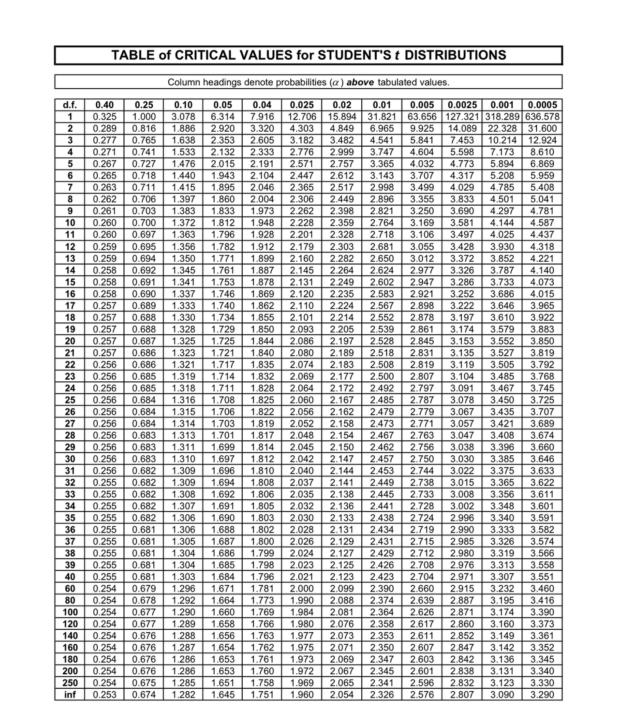
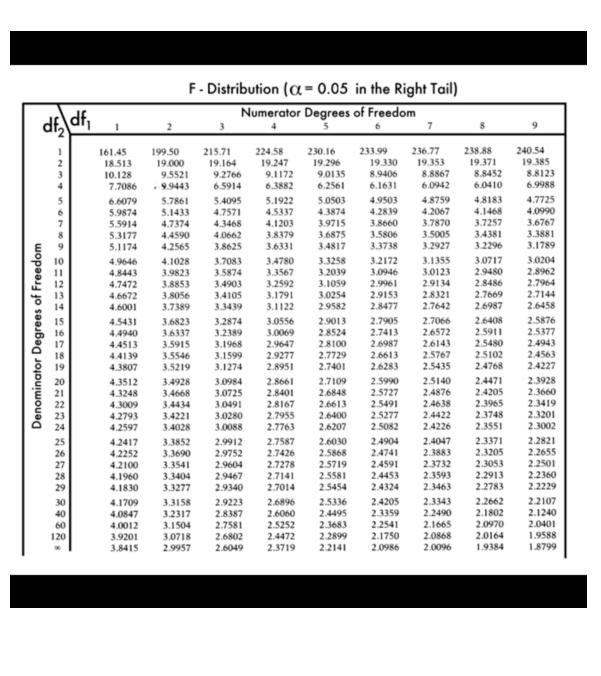
a) A researcher investigating the factors determining wages estimates models (1) and (2) below using information on a cross-sectional sample of data on wages for 525 US workers recorded in 2005. Note that below In stands for natural logarithm and is the subscript denoting the i-th cross-sectional unit i.e. worker. InWAGE=0.28 +0.09EDUC +0.01EXPER, -0.03FEMALE InWAGE =-1.14 +0.941nEDUC, +0.16 InEXPER-0.02FEMALE where: WAGE is the hourly wage in US$ EDUC is the number of years of education of the worker (1) (2) EXPER is the number of years of working experience the worker has FEMALE is a dummy variable that equals 1 if the worker is female and equals 0 if they are male. Clearly explain what the estimated values of the slope coefficients in the two models imply about the relationship between each explanatory/independent variable and wages (you do not need to discuss the intercept/constant coefficient in each model). (20 marks) b) The researcher is unsure which of the two functional forms above is more appropriate and so applies Ramsey's RESET using the estimation results from both models. While performing the RESET tests two powers of the fitted values (i.e. and Y³) are included in the RESET regression. The values of the RESET test F-statistics are 4.71 for model (1) and 2.26 for model (2). What are the outcomes of the two RESET tests and what do these results imply about the suitability/unsuitability of the functional forms used in models (1) and (2)? Explain how you reach your conclusions. (12 marks) c) What are the likely consequences of using an incorrect functional form for a regression model? Besides the RESET tests used above, describe in detail one other possible method of testing for incorrect functional form. What advantages and/or disadvantages does this have compared to the RESET test used above? (18 marks) [TOTAL 50 MARKS] TABLE of CRITICAL VALUES for STUDENT'S t DISTRIBUTIONS Column headings denote probabilities (a) above tabulated values. 0.40 0.25 0.10 0.325 1.000 3.078 0.05 0.04 0.025 6.314 7.916 12.706 2.920 3.320 4.303 2.353 2.605 0.289 0.816 1.886 0.277 0.765 1.638 3 3.182 4.849 3.482 2.999 3.747 4.604 4 0.271 0.741 1.533 2.132 2.333 2.776 8.610 5 0.267 0.727 1.476 2.015 2.191 2.571 2.757 6.869 6 5.959 7 5.408 8 9 0.02 0.01 0.005 0.0025 0.001 0.0005 15.894 31.821 63.656 127.321 318.289 636.578 6.965 9.925 14.089 22.328 31.600 4.541 5.841 7.453 10.214 12.924 5.598 7.173 3.365 4.032 4.773 5.894 0.265 0.718 1.440 1.943 2.104 2.447 2.612 3.143 3.707 4.317 5.208 0.263 0.711 1.415 1.895 2.046 2.365 2.517 2.998 3.499 4.029 4.785 0.262 0.706 1.397 1.860 2.004 2.306 2.449 2.896 3.355 0.261 0.703 1.383 1.833 1.973 2.262 2.398 2.821 3.250 0.260 0.700 1.372 1.812 2.359 2.764 3.169 0.260 0.697 1.363 1.796 2.328 2.718 3.106 0.695 1.356 1.782 2.303 2.681 3.055 1.350 2.282 2.650 3.012 1.345 2.264 2.624 2.977 0.258 0.691 1.341 2.249 2.602 2.947 2.235 2.583 2.921 2.224 2.567 2.214 2.552 10 1.948 2.228 1.928 2.201 11 12 0.259 13 0.259 0.694 14 0.258 0.692 1.771 1.912 2.179 1.899 2.160 1.761 1.887 2.145 1.878 2.131 1.869 2.120 15 16 0.258 0.690 1.337 1.753 1.746 1.740 17 0.257 0.689 1.333 2.898 3.222 3.646 18 0.257 0.688 1.330 3.610 19 0.257 0.688 3.174 3.579 3.153 3.552 3.850 3.135 3.527 3.819 3.119 3.505 3.792 0.256 0.685 3.768 0.256 0.685 1.711 1.828 3.745 25 0.256 0.684 1.316 1.708 1.825 26 0.256 0.684 1.706 1.822 2.056 2.763 3.047 27 0.256 0.684 28 0.256 0.683 29 0.256 0.683 30 0.256 0.683 31 0.256 0.682 32 0.255 0.682 33 0.255 0.682 34 0.255 0.682 35 0.255 0.682 1.862 2.110 1.734 1.855 2.101 2.878 3.197 1.328 1.729 1.850 2.093 2.205 2.539 2.861 0.257 0.687 1.325 1.725 1.844 2.086 2.197 2.528 2.845 0.257 0.686 1.323 1.721 1.840 2.080 2.189 2.518 2.831 0.256 0.686 1.321 1.717 1.835 2.074 2.183 2.508 2.819 1.319 1.714 1.832 2.069 2.177 2.500 2.807 3.104 3.485 1.318 2.064 2.172 2.492 2.797 3.091 3.467 2.060 2.167 2.485 2.787 3.078 3.450 3.725 1.315 2.162 2.479 2.779 3.067 3.435 3.707 1.314 1.703 1.819 2.052 2.158 2.473 2.771 3.057 3.421 3.689 1.313 1.701 1.817 2.048 2.154 2.467 3.408 3.674 1.311 1.699 1.814 2.045 2.150 2.462 2.756 3.038 3.396 3.660 1.310 1.697 1.812 2.042 2.147 2.457 2.750 3.030 3.385 1.309 1.696 1.810 2.040 2.144 2.453 1.309 1.694 1.808 2.037 2.141 2.449 1.308 1.692 1.806 2.035 2.138 2.445 1.307 1.691 1.805 2.032 2.136 2.441 1.306 1.690 1.803 2.030 2.133 2.438 1.306 1.688 1.802 2.028 1.687 1.800 2.026 1.686 1.799 2.024 2.023 1.796 2.021 3.646 3.633 2.744 3.022 3.375 2.738 3.015 3.365 3.622 2.733 3.008 3.356 3.611 2.728 3.002 3.348 36 0.255 0.681 37 0.255 0.681 2.724 2.996 2.131 2.434 2.719 2.990 2.129 2.431 2.715 2.985 2.127 2.429 2.125 2.426 2.708 2.976 2.123 38 1.305 1.304 1.304 1.685 1.798 0.255 0.681 0.255 0.681 2.712 2.980 39 0.255 0.681 1.303 1.684 2.423 2.704 2.971 3.307 3.551 2.099 2.660 2.915 3.232 3.460 3.416 3.390 40 60 0.254 0.679 1.296 1.671 1.781 2.000 2.390 80 0.254 0.678 1.292 1.664 1.773 1.990 2.088 2.374 2.639 2.887 3.195 100 0.254 0.677 1.290 1.660 1.769 1.984 2.081 2.364 2.626 2.871 3.174 120 0.254 0.677 1.289 1.658 1.766 1.980 2.076 2.358 2.617 2.860 3.160 3.373 140 0.254 0.676 1.288 1.656 1.763 1.977 2.073 2.353 160 0.254 0.676 1.287 1.654 1.762 1.975 2.071 2.350 180 0.254 0.676 1.286 1.653 1.761 1.973 2.069 2.347 200 0.254 0.676 1,286 1.653 1.760 1.972 2.067 2.345 250 0.254 0.675 1.285 1.651 1.758 1.969 2.065 2.341 inf 0.253 0.674 1.282 1.645 1.751 1.960 2.611 2.852 3.149 3.361 3.352 2.607 2.847 3.142 2.603 2.842 3.136 3.345 2.601 2.838 3.131 3.340 2.596 2.832 3.123 3.330 2.576 2.807 3.090 3.290 2.054 2.326 d.f. 1 2 20 21 22 23 24 3.833 4.501 5.041 3.690 4.297 4.781 3.581 4.144 4.587 3.497 4.025 4.437 3.428 3.930 4.318 3.372 3.852 4.221 3.326 3.787 4.140 3.286 3.733 4.073 3.252 3.686 4.015 3.965 3.922 3.883 3.601 3.340 3.591 3.333 3.582 3.326 3.574 3.319 3.566 3.313 3.558 dfdf, Denominator Degrees of Freedom SHEMASA522 85832 38532 2982, 13 14 15 16 17 18 19 20 21 22 24 26 27 29 30 40 60 120 1 161.45 18.513 10.128 9.5521 7.7086 -9.9443 4.9646 4.1028 4.7472 4.6672 4.6001 199.50 4.5431 4.4940 4.4513 4.4139 4.3807 19.000 4.2417 4.2252 F- Distribution (α-0.05 in the Right Tail) Numerator Degrees of Freedom 4 6 4.2100 4.1960 4.1830 4.1709 4.0847 4.0012 3.9201 3.8415 5.4095 5.1922 6.6079 5.7861 5.9874 5.1433 4.7571 4.5337 5.5914 4.7374 4.3468 4.1203 5.3177 4.4590 5.1174 4.2565 3.7083 4.8443 3.9823 3.5874 3.8853 3.8056 3.7389 3 215.71 3.4434 3.4221 3.4028 19.164 4.3512 3.4928 3.4668 4.3248 4.3009 4.2793 4.2597 3.3852 3.3690 3.3541 3.3404 3.3277 9.2766 6.5914 3.1504 3.0718 2.9957 224.58 3.6823 3.2874 3.0556 3.6337 3.2389 3.0069 3.5915 3.1968 2.9647 3.5546 3.1599 2.9277 3.5219 3.1274 2.8951 3.0984 3.0725 3.0491 19.247 3.4780 3.3567 3.4903 3.2592 3.4105 3.3439 9.1172 6.3882 2.9912 2.9752 2.9604 2.9467 2.9340 3.3158 2.9223 3.2317 2.8387 2.7581 5.0503 4.9503 4.3874 4.2839 3.9715 3.8660 4.0662 3.8379 3.6875 3.5806 3.8625 3.6331 3.4817 3.3738 2.8661 2.8401 2.8167 3.0280 2.7955 3.0088 2.7763 230.16 2.7587 2.7426 19.296 3.3258 3.2172 3.2039 3.0946 3.1059 2.9961 3.1791 3.0254 2.9153 3.1122 2.9582 2.8477 2.7278 2.7141 2.7014 9.0135 6.2561 2.7109 2.6848 233.99 2.6613 2.6400 2.6207 19.330 8.9406 6.1631 2.9013 2.7905 2.8524 2.7413 2.8100 2.6987 2.7729 2.6613 2.7401 2.5719 2.5581 2.5454 2.6896 2.5336 2.6060 2.4495 2.5252 2.3683 2.6802 2.4472 2.2899 2.6049 2.3719 2.2141 2.5990 2.5727 2.6030 2.4904 2.5868 2.4741 7 236.77 19.353 8.8867 6.0942 2.4205 2.3359 8 238.88 2.7066 2.6572 2.6143 2.5767 2.5102 2.6283 2.5435 2.4768 2.4047 2.3883 2.4591 2.3732 2.4453 2.3593 2.4324 2.3463 19.371 4.8759 4.8183 4.2067 4.1468 3.7257 8.8452 6.0410 3.7870 3.5005 3.4381 3.2927 3.2296 2.3343 2.2490 2.2541 2.1665 2.1750 2.0868 2.0986 2.0096 3.1355 3.0717 3.0123 2.9480 2.9134 2.8486 2.8321 2.7669 2.7642 2.6987 2.5140 2.4471 2.4876 2.4205 2.5491 2.4638 2.3965 2.5277 2.4422 2.3748 2.5082 2.4226 2.3551 2.6408 2.5911 2.5480 2.3371 2.3205 2.3053 2.2913 2.2783 2.2662 2.1802 2.0970 2.0164 1.9384 9 240.54 19.385 8.8123 6.9988 4.7725 4.0990 3.6767 3.3881 3.1789 3.0204 2.8962 2.7964 2.7144 2.6458 2.5876 2.5377 2.4943 2.4563 2.4227 2.3928 2.3660 2.3419 2.3201 2.3002 2.2821 2.2655 2.2501 2.2360 2.2229 2.2107 2.1240 2.0401 1.9588 1.8799 a) A researcher investigating the factors determining wages estimates models (1) and (2) below using information on a cross-sectional sample of data on wages for 525 US workers recorded in 2005. Note that below In stands for natural logarithm and is the subscript denoting the i-th cross-sectional unit i.e. worker. InWAGE=0.28 +0.09EDUC +0.01EXPER, -0.03FEMALE InWAGE =-1.14 +0.941nEDUC, +0.16 InEXPER-0.02FEMALE where: WAGE is the hourly wage in US$ EDUC is the number of years of education of the worker (1) (2) EXPER is the number of years of working experience the worker has FEMALE is a dummy variable that equals 1 if the worker is female and equals 0 if they are male. Clearly explain what the estimated values of the slope coefficients in the two models imply about the relationship between each explanatory/independent variable and wages (you do not need to discuss the intercept/constant coefficient in each model). (20 marks) b) The researcher is unsure which of the two functional forms above is more appropriate and so applies Ramsey's RESET using the estimation results from both models. While performing the RESET tests two powers of the fitted values (i.e. and Y³) are included in the RESET regression. The values of the RESET test F-statistics are 4.71 for model (1) and 2.26 for model (2). What are the outcomes of the two RESET tests and what do these results imply about the suitability/unsuitability of the functional forms used in models (1) and (2)? Explain how you reach your conclusions. (12 marks) c) What are the likely consequences of using an incorrect functional form for a regression model? Besides the RESET tests used above, describe in detail one other possible method of testing for incorrect functional form. What advantages and/or disadvantages does this have compared to the RESET test used above? (18 marks) [TOTAL 50 MARKS] TABLE of CRITICAL VALUES for STUDENT'S t DISTRIBUTIONS Column headings denote probabilities (a) above tabulated values. 0.40 0.25 0.10 0.325 1.000 3.078 0.05 0.04 0.025 6.314 7.916 12.706 2.920 3.320 4.303 2.353 2.605 0.289 0.816 1.886 0.277 0.765 1.638 3 3.182 4.849 3.482 2.999 3.747 4.604 4 0.271 0.741 1.533 2.132 2.333 2.776 8.610 5 0.267 0.727 1.476 2.015 2.191 2.571 2.757 6.869 6 5.959 7 5.408 8 9 0.02 0.01 0.005 0.0025 0.001 0.0005 15.894 31.821 63.656 127.321 318.289 636.578 6.965 9.925 14.089 22.328 31.600 4.541 5.841 7.453 10.214 12.924 5.598 7.173 3.365 4.032 4.773 5.894 0.265 0.718 1.440 1.943 2.104 2.447 2.612 3.143 3.707 4.317 5.208 0.263 0.711 1.415 1.895 2.046 2.365 2.517 2.998 3.499 4.029 4.785 0.262 0.706 1.397 1.860 2.004 2.306 2.449 2.896 3.355 0.261 0.703 1.383 1.833 1.973 2.262 2.398 2.821 3.250 0.260 0.700 1.372 1.812 2.359 2.764 3.169 0.260 0.697 1.363 1.796 2.328 2.718 3.106 0.695 1.356 1.782 2.303 2.681 3.055 1.350 2.282 2.650 3.012 1.345 2.264 2.624 2.977 0.258 0.691 1.341 2.249 2.602 2.947 2.235 2.583 2.921 2.224 2.567 2.214 2.552 10 1.948 2.228 1.928 2.201 11 12 0.259 13 0.259 0.694 14 0.258 0.692 1.771 1.912 2.179 1.899 2.160 1.761 1.887 2.145 1.878 2.131 1.869 2.120 15 16 0.258 0.690 1.337 1.753 1.746 1.740 17 0.257 0.689 1.333 2.898 3.222 3.646 18 0.257 0.688 1.330 3.610 19 0.257 0.688 3.174 3.579 3.153 3.552 3.850 3.135 3.527 3.819 3.119 3.505 3.792 0.256 0.685 3.768 0.256 0.685 1.711 1.828 3.745 25 0.256 0.684 1.316 1.708 1.825 26 0.256 0.684 1.706 1.822 2.056 2.763 3.047 27 0.256 0.684 28 0.256 0.683 29 0.256 0.683 30 0.256 0.683 31 0.256 0.682 32 0.255 0.682 33 0.255 0.682 34 0.255 0.682 35 0.255 0.682 1.862 2.110 1.734 1.855 2.101 2.878 3.197 1.328 1.729 1.850 2.093 2.205 2.539 2.861 0.257 0.687 1.325 1.725 1.844 2.086 2.197 2.528 2.845 0.257 0.686 1.323 1.721 1.840 2.080 2.189 2.518 2.831 0.256 0.686 1.321 1.717 1.835 2.074 2.183 2.508 2.819 1.319 1.714 1.832 2.069 2.177 2.500 2.807 3.104 3.485 1.318 2.064 2.172 2.492 2.797 3.091 3.467 2.060 2.167 2.485 2.787 3.078 3.450 3.725 1.315 2.162 2.479 2.779 3.067 3.435 3.707 1.314 1.703 1.819 2.052 2.158 2.473 2.771 3.057 3.421 3.689 1.313 1.701 1.817 2.048 2.154 2.467 3.408 3.674 1.311 1.699 1.814 2.045 2.150 2.462 2.756 3.038 3.396 3.660 1.310 1.697 1.812 2.042 2.147 2.457 2.750 3.030 3.385 1.309 1.696 1.810 2.040 2.144 2.453 1.309 1.694 1.808 2.037 2.141 2.449 1.308 1.692 1.806 2.035 2.138 2.445 1.307 1.691 1.805 2.032 2.136 2.441 1.306 1.690 1.803 2.030 2.133 2.438 1.306 1.688 1.802 2.028 1.687 1.800 2.026 1.686 1.799 2.024 2.023 1.796 2.021 3.646 3.633 2.744 3.022 3.375 2.738 3.015 3.365 3.622 2.733 3.008 3.356 3.611 2.728 3.002 3.348 36 0.255 0.681 37 0.255 0.681 2.724 2.996 2.131 2.434 2.719 2.990 2.129 2.431 2.715 2.985 2.127 2.429 2.125 2.426 2.708 2.976 2.123 38 1.305 1.304 1.304 1.685 1.798 0.255 0.681 0.255 0.681 2.712 2.980 39 0.255 0.681 1.303 1.684 2.423 2.704 2.971 3.307 3.551 2.099 2.660 2.915 3.232 3.460 3.416 3.390 40 60 0.254 0.679 1.296 1.671 1.781 2.000 2.390 80 0.254 0.678 1.292 1.664 1.773 1.990 2.088 2.374 2.639 2.887 3.195 100 0.254 0.677 1.290 1.660 1.769 1.984 2.081 2.364 2.626 2.871 3.174 120 0.254 0.677 1.289 1.658 1.766 1.980 2.076 2.358 2.617 2.860 3.160 3.373 140 0.254 0.676 1.288 1.656 1.763 1.977 2.073 2.353 160 0.254 0.676 1.287 1.654 1.762 1.975 2.071 2.350 180 0.254 0.676 1.286 1.653 1.761 1.973 2.069 2.347 200 0.254 0.676 1,286 1.653 1.760 1.972 2.067 2.345 250 0.254 0.675 1.285 1.651 1.758 1.969 2.065 2.341 inf 0.253 0.674 1.282 1.645 1.751 1.960 2.611 2.852 3.149 3.361 3.352 2.607 2.847 3.142 2.603 2.842 3.136 3.345 2.601 2.838 3.131 3.340 2.596 2.832 3.123 3.330 2.576 2.807 3.090 3.290 2.054 2.326 d.f. 1 2 20 21 22 23 24 3.833 4.501 5.041 3.690 4.297 4.781 3.581 4.144 4.587 3.497 4.025 4.437 3.428 3.930 4.318 3.372 3.852 4.221 3.326 3.787 4.140 3.286 3.733 4.073 3.252 3.686 4.015 3.965 3.922 3.883 3.601 3.340 3.591 3.333 3.582 3.326 3.574 3.319 3.566 3.313 3.558 dfdf, Denominator Degrees of Freedom SHEMASA522 85832 38532 2982, 13 14 15 16 17 18 19 20 21 22 24 26 27 29 30 40 60 120 1 161.45 18.513 10.128 9.5521 7.7086 -9.9443 4.9646 4.1028 4.7472 4.6672 4.6001 199.50 4.5431 4.4940 4.4513 4.4139 4.3807 19.000 4.2417 4.2252 F- Distribution (α-0.05 in the Right Tail) Numerator Degrees of Freedom 4 6 4.2100 4.1960 4.1830 4.1709 4.0847 4.0012 3.9201 3.8415 5.4095 5.1922 6.6079 5.7861 5.9874 5.1433 4.7571 4.5337 5.5914 4.7374 4.3468 4.1203 5.3177 4.4590 5.1174 4.2565 3.7083 4.8443 3.9823 3.5874 3.8853 3.8056 3.7389 3 215.71 3.4434 3.4221 3.4028 19.164 4.3512 3.4928 3.4668 4.3248 4.3009 4.2793 4.2597 3.3852 3.3690 3.3541 3.3404 3.3277 9.2766 6.5914 3.1504 3.0718 2.9957 224.58 3.6823 3.2874 3.0556 3.6337 3.2389 3.0069 3.5915 3.1968 2.9647 3.5546 3.1599 2.9277 3.5219 3.1274 2.8951 3.0984 3.0725 3.0491 19.247 3.4780 3.3567 3.4903 3.2592 3.4105 3.3439 9.1172 6.3882 2.9912 2.9752 2.9604 2.9467 2.9340 3.3158 2.9223 3.2317 2.8387 2.7581 5.0503 4.9503 4.3874 4.2839 3.9715 3.8660 4.0662 3.8379 3.6875 3.5806 3.8625 3.6331 3.4817 3.3738 2.8661 2.8401 2.8167 3.0280 2.7955 3.0088 2.7763 230.16 2.7587 2.7426 19.296 3.3258 3.2172 3.2039 3.0946 3.1059 2.9961 3.1791 3.0254 2.9153 3.1122 2.9582 2.8477 2.7278 2.7141 2.7014 9.0135 6.2561 2.7109 2.6848 233.99 2.6613 2.6400 2.6207 19.330 8.9406 6.1631 2.9013 2.7905 2.8524 2.7413 2.8100 2.6987 2.7729 2.6613 2.7401 2.5719 2.5581 2.5454 2.6896 2.5336 2.6060 2.4495 2.5252 2.3683 2.6802 2.4472 2.2899 2.6049 2.3719 2.2141 2.5990 2.5727 2.6030 2.4904 2.5868 2.4741 7 236.77 19.353 8.8867 6.0942 2.4205 2.3359 8 238.88 2.7066 2.6572 2.6143 2.5767 2.5102 2.6283 2.5435 2.4768 2.4047 2.3883 2.4591 2.3732 2.4453 2.3593 2.4324 2.3463 19.371 4.8759 4.8183 4.2067 4.1468 3.7257 8.8452 6.0410 3.7870 3.5005 3.4381 3.2927 3.2296 2.3343 2.2490 2.2541 2.1665 2.1750 2.0868 2.0986 2.0096 3.1355 3.0717 3.0123 2.9480 2.9134 2.8486 2.8321 2.7669 2.7642 2.6987 2.5140 2.4471 2.4876 2.4205 2.5491 2.4638 2.3965 2.5277 2.4422 2.3748 2.5082 2.4226 2.3551 2.6408 2.5911 2.5480 2.3371 2.3205 2.3053 2.2913 2.2783 2.2662 2.1802 2.0970 2.0164 1.9384 9 240.54 19.385 8.8123 6.9988 4.7725 4.0990 3.6767 3.3881 3.1789 3.0204 2.8962 2.7964 2.7144 2.6458 2.5876 2.5377 2.4943 2.4563 2.4227 2.3928 2.3660 2.3419 2.3201 2.3002 2.2821 2.2655 2.2501 2.2360 2.2229 2.2107 2.1240 2.0401 1.9588 1.8799
Expert Answer:
Answer rating: 100% (QA)
a Model 1 implies A 1 increase in education is associated with a 009 increase in the logarithm of wa... View the full answer

Related Book For 

Marketing Research
ISBN: 978-1118156636
11th edition
Authors: David A. Aaker, V. Kumar, Robert Leone, George S. Day
Posted Date:
Students also viewed these finance questions
-
List three specific parts of the Case Guide, Objectives and Strategy Section (See below) that you had the most difficulty understanding. Describe your current understanding of these parts. Provide...
-
Case Study: Quick Fix Dental Practice Technology requirements Application must be built using Visual Studio 2019 or Visual Studio 2017, professional or enterprise. The community edition is not...
-
A store that sells custom-made lampshades has 3 shades that have remained in inventory for more than two years. Each shade cost $50, originally retailed for $100, and now has a current selling price...
-
Write using only positive exponents and then evaluate. Assume that all variables represent nonzero real numbers. 5 -2
-
A long, thin solenoid has 900 turns per meter and radius 250 cm. The current in the solenoid is increasing at a uniform rate of 60.0 A/s. What is the magnitude of the induced electric field at a...
-
In a test of independence, the expected number is equal to the row total multiplied by the column total divided by the total surveyed.
-
Four independent situations are given below. Assume partners of the existing partnership are Maria Heath and Lisa Curtis. The new partner is Wade Torres. For each situation, prepare the appropriate...
-
4. Sleekfon and Sturdyfon are two major cell phone manufacturers that have recently merged. Their current market sizes are as shown in Table 5-9. All demand is in millions of units. Sleekfon has...
-
The Kumar Corpotation, a firm in the 3 4 % marginal taxbracket with a 1 5 % required rate of return or cost of capital, is considering a new project. This project involves the introduction of a new...
-
Valencia Products makes automobile radar detectors and assembles two models LaserStop and SpeedBuster. Both models use the same electronic components. After reviewing the components required and the...
-
Transaction data for Monty Real Estate Agency are presented as follows. Oct. 1 Diane Lexington begins business as a real estate agent with a cash investment of $22,710 in exchange for common stock. 2...
-
Which method of legal description divides property into a variety of smaller parcels, including sections, each of which has 640 acres?
-
Which term refers to a form of malicious code or software that attaches itself to other pieces of code in order to replicate? Which term refers to a form of malicious code or software that attaches...
-
Which result set requires a JOIN? Showing invoice totals, invoice_dates, and customer_id's Showing invoice_dates with invoice totals Showing customer names with invoice_dates Showing invoice_dates...
-
A prosperous school district was subject to a court-ordered desegregation plan involving busing. After receiving the court order recognizing that the district had achieved unitary status, the...
-
Let f(x)=7x+8. Determine the derivative f'(x).
-
Your bank card has an APR of 18% and there is a 2% fee for cash advances. The bank starts charging interest on cash advances immediately. You get a cash advance of $1,200 on the first day of the...
-
Solve the relation Exz:Solve therelation ne %3D
-
Write a cover letter for a mail survey of householders that contains a number of questions regarding the utilization of various kinds of burglary- protection devices.
-
In the Winona Wildcats study presented in Chapter 14 (question 17), Pete Thames, the team's general manager, has decided to use a stratified sample. One sample group includes only those who attended...
-
The sampling efficiency of systematic sampling can be greater than, less than, or equal to single random sampling. Discuss.
-
Presented below are the beginning-of-year common share price (P t-1 ), the end-of-year common share price (P t ), and the annual dividend (D t ) for three competitorsGeneral Electric, Philipps...
-
Compute the missing amounts in the following financial statements. You may assume that accounts receivable relate only to credit sales and that accounts payable relate only to credit purchases of...
-
Compute the missing amounts in the following financial statements. You may assume that accounts receivable relate only to credit sales and that accounts payable relate only to credit purchases of...

Study smarter with the SolutionInn App