

A B D F Dayton, Inc. Annual Income Statement (Values in Millions) Common Size 2012 2011...
Fantastic news! We've Found the answer you've been seeking!
Question:
Transcribed Image Text:
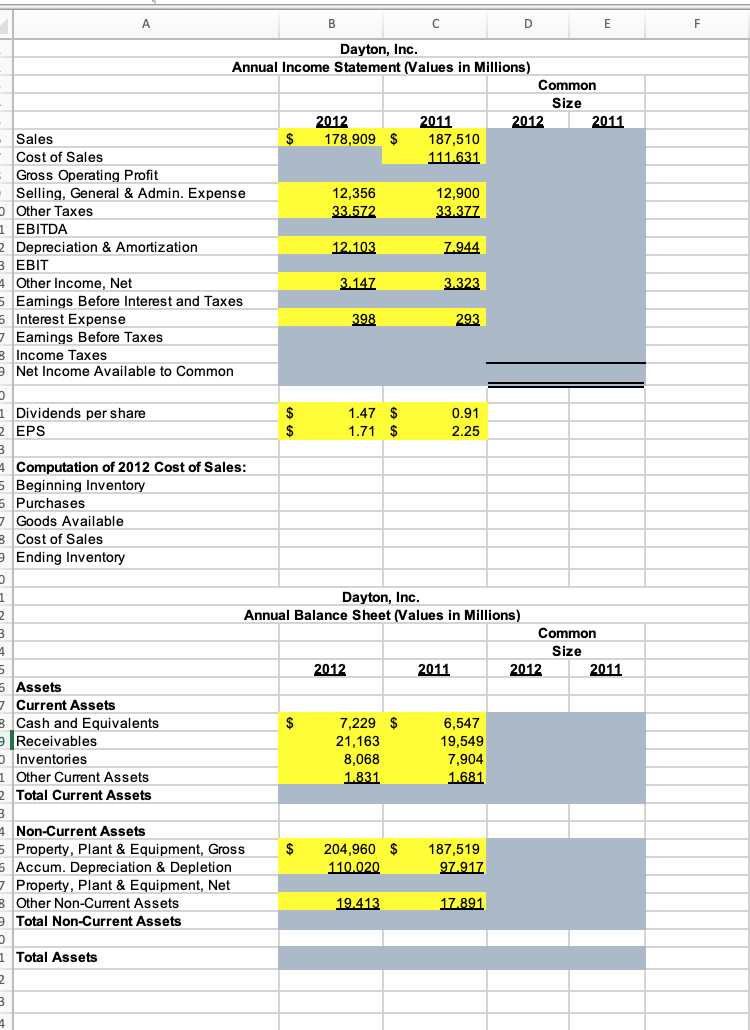
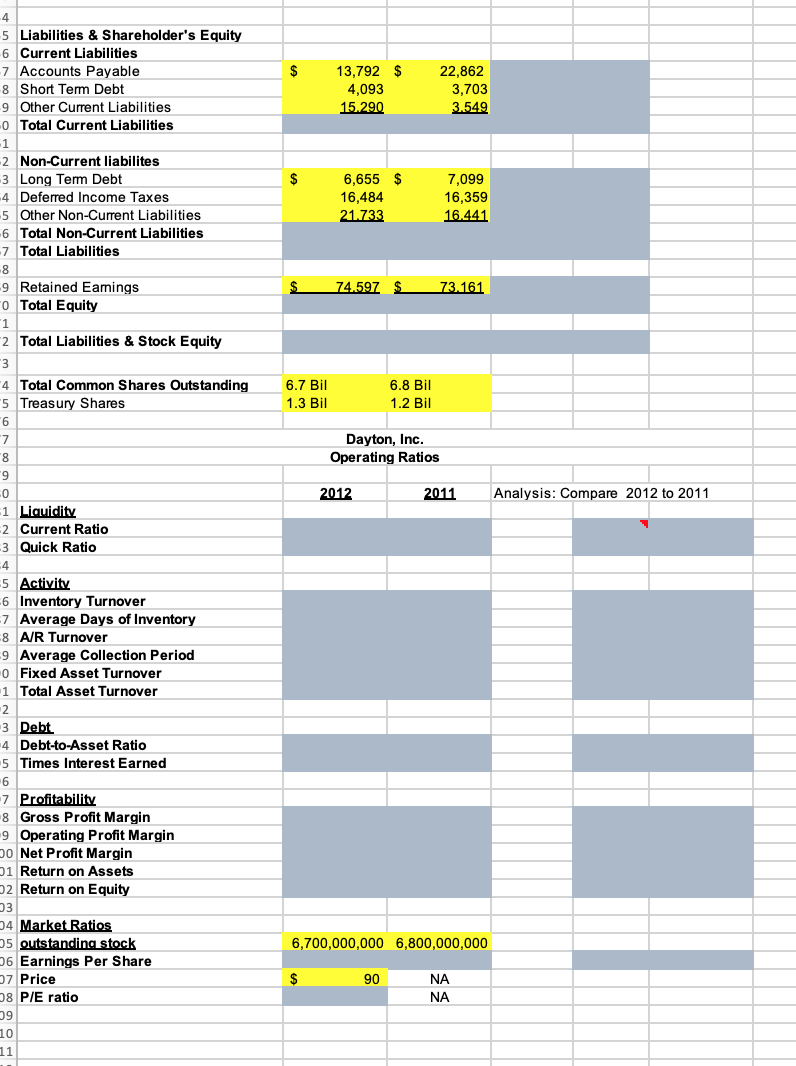
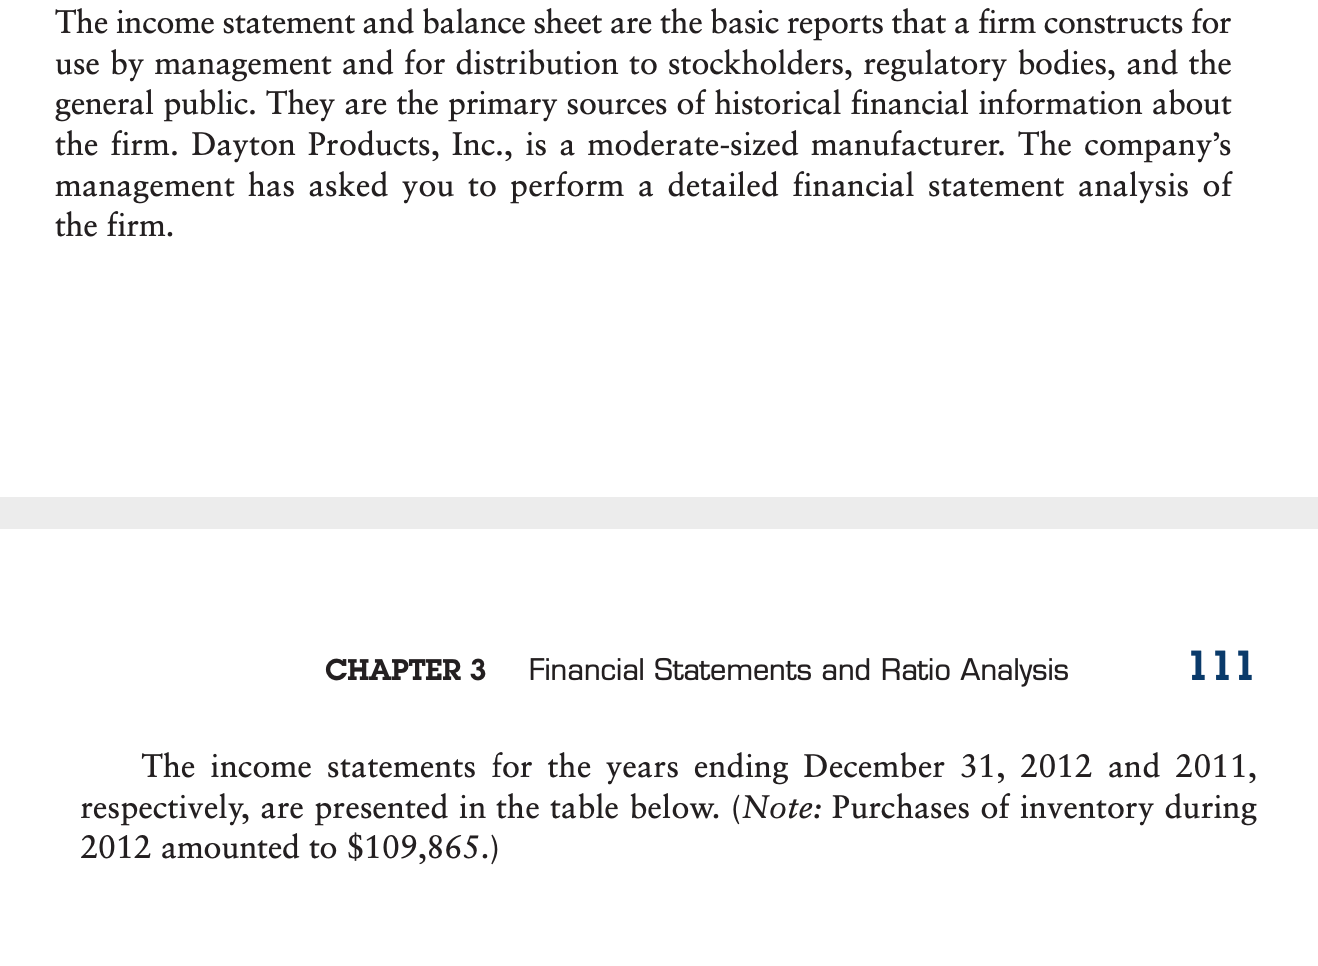
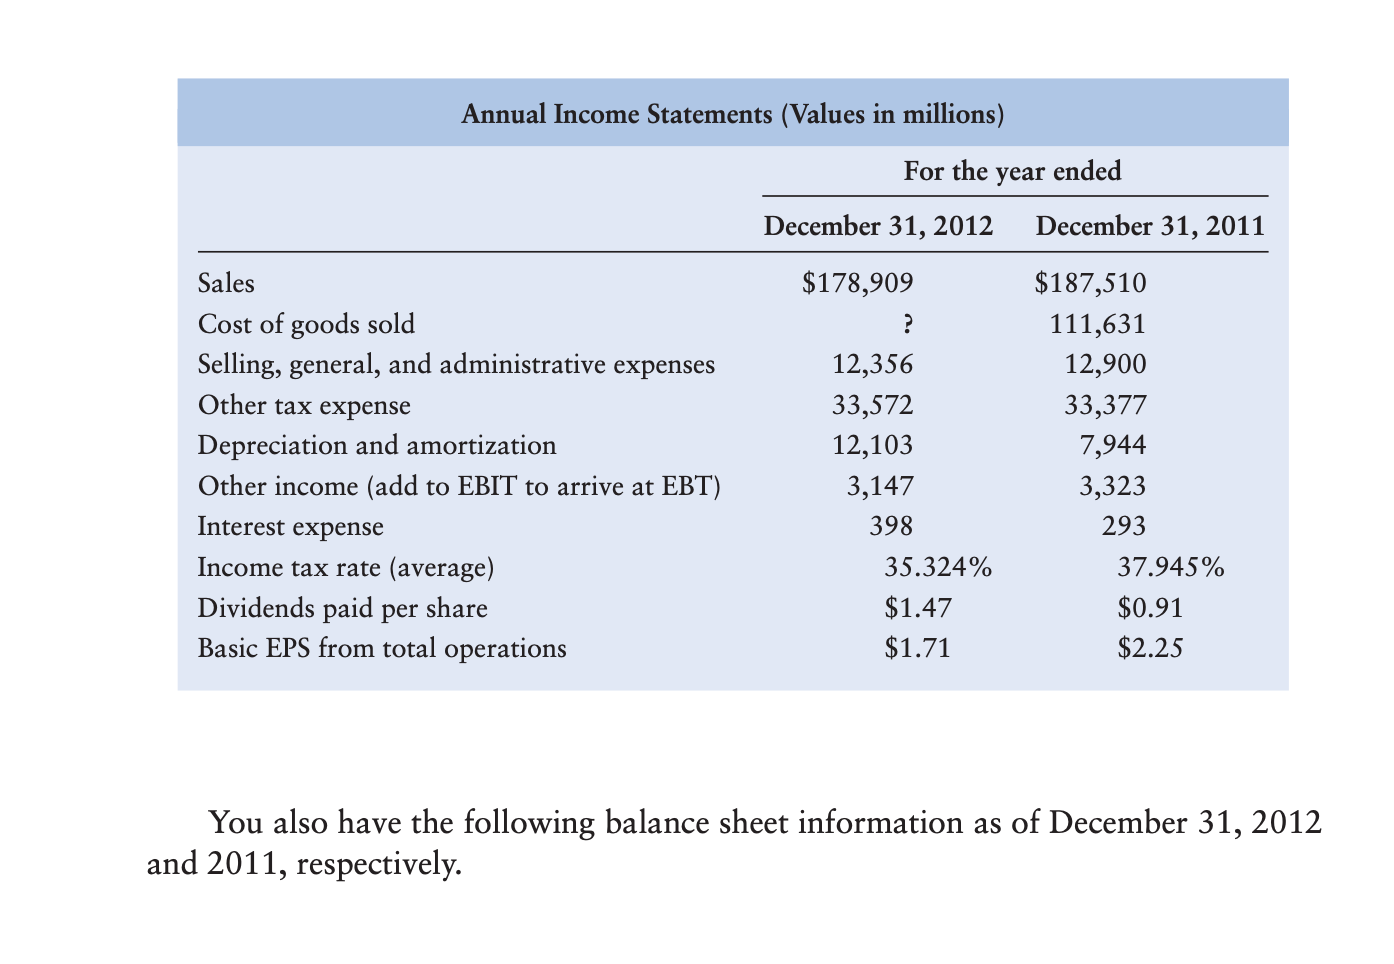
A B D F Dayton, Inc. Annual Income Statement (Values in Millions) Common Size 2012 2011 2012 2011 Sales $ 178,909 $ 187,510 Cost of Sales 111.631 Gross Operating Profit Selling, General & Admin. Expense 12,356 12,900 Other Taxes 33.572 33.377 EBITDA Depreciation & Amortization EBIT 12.103 7.944 4 Other Income, Net 5 Eamings Before Interest and Taxes 5 Interest Expense 3.147 3.323 398 293 Eamings Before Taxes B Income Taxes 9 Net Income Available to Common 1 Dividends per share 2 EPS $ 1.47 $ 1.71 $ 0.91 $ 2.25 Computation of 2012 Cost of Sales: 5 Beginning Inventory 5 Purchases 7 Goods Available 3 Cost of Sales eEnding Inventory Dayton, Inc. Annual Balance Sheet (Values in Millions) Common Size 2012 2011 2012 2011 Assets Current Assets $ 7,229 $ Cash and Equivalents Receivables p Inventories 21,163 8,068 1.831 6,547 19,549 7,904 Other Current Assets 1.681 Total Current Assets 4 Non-Curret Assets 204,960 $ 110.020 $ 187,519 Property, Plant & Equipment, Gross Accum. Depreciation & Depletion 7 Property, Plant & Equipment, Net B Other Non-Current Assets 97.917 19.413 17.891 Total Non-Current Assets 1 Total Assets 4 5 Liabilities & Shareholder's Equity 6 Current Liabilities 13,792 $ 4,093 -7 Accounts Payable 8 Short Tem Debt 9 Other Current Liabilities 0 Total Current Liabilities -1 $ 22,862 3,703 3.549 15.290 2 Non-Current liabilites $ 6,655 $ 16,484 21.733 3 Long Tem Debt 7,099 4 Deferred Income Taxes 16.359 5 Other Non-Current Liabilities 6 Total Non-Current Liabilities 7 Total Liabilities 16.441 -8 -9 Retained Eamings -o Total Equity 1 -2 Total Liabilities & Stock Equity 74.597 $ 73.161 3 -4 Total Common Shares Outstanding 6.7 Bil 6.8 Bil 5 Treasury Shares 1.3 Bil 1.2 Bil Dayton, Inc. 8, Operating Ratios 6- 2012 2011 Analysis: Compare 2012 to 2011 1 Liquidity 2 Current Ratio 3 Quick Ratio 4 -5 Activity 6 Inventory Turnover 7 Average Days of Inventory -8 A/R Turnover 9 Average Collection Period 0 Fixed Asset Turnover 1 Total Asset Turnover 2 3 Debt 4 Debt-to-Asset Ratio 5 Times Interest Earned 6 7 Profitability 8 Gross Profit Margin 9 Operating Profit Margin p0 Net Profit Margin 01 Return on Assets 22 Return on Equity D3 24 Market Ratios 05 outstanding stock D6 Earnings Per Share D7 Price D8 P/E ratio 09 6,700,000,000 6,800,000,000 $ 90 NA NA 10 11 The income statement and balance sheet are the basic reports that a firm constructs for use by management and for distribution to stockholders, regulatory bodies, and the general public. They are the primary sources of historical financial information about the firm. Dayton Products, Inc., is a moderate-sized manufacturer. The company's management has asked you to perform a detailed financial statement analysis of the firm. CHAPTER 3 Financial Statements and Ratio Analysis 111 The income statements for the years ending December 31, 2012 and 2011, respectively, are presented in the table below. (Note: Purchases of inventory during 2012 amounted to $109,865.) Annual Income Statements (Values in millions) For the year ended December 31, 2012 December 31, 2011 Sales $178,909 $187,510 Cost of goods sold ? 111,631 Selling, general, and administrative expenses 12,356 12,900 Other tax expense 33,572 33,377 Depreciation and amortization Other income (add to EBIT to arrive at EBT) 12,103 7,944 3,147 3,323 Interest expense 398 293 Income tax rate (average) 35.324% 37.945% Dividends paid per share Basic EPS from total operations $1.47 $0.91 $1.71 $2.25 You also have the following balance sheet information as of December 31, 2012 and 2011, respectively. You also have the following balance sheet information as of December 31, 2012 and 2011, respectively. Annual Balance Sheets (Values in millions) December 31, 2012 December, 31, 2011 Cash and equivalents $ 7,229 $ 6,547 Receivables 21,163 19,549 Inventories 8,068 7,904 Other current assets 1,831 1,681 Property, plant, and equipment, gross Accumulated depreciation and depletion 204,960 187,519 110,020 97,917 Other noncurrent assets 19,413 17,891 Accounts payable Short-term debt payable 13,792 22,862 4,093 3,703 Other current liabilities 15,290 3,549 Long-term debt payable Deferred income taxes 6,655 7,099 16,484 16,359 Other noncurrent liabilities 21,733 16,441 Retained earnings 74,597 73,161 Total common shares outstanding 6.7 billion 6.8 billion ТO DO a. Create a spreadsheet similar to Table 3.1 to model the following: (1) A multiple-step comparative income statement for Dayton, Inc., for the periods ending December 31, 2012 and 2011. You must calculate the cost of goods sold for the (2) A common-size income statement for Dayton, Inc., covering the years 2012 and 2011. year 2012. b. Create a spreadsheet similar to Table 3.2 to model the following: (1) A detailed, comparative balance sheet for Dayton, Inc., for the December 31, 2012 and 2011. (2) A common-size balance sheet for Dayton, Inc., covering the years 2012 and years ended 2011. c. Create a spreadsheet similar to Table 3.8 to perform the following analysis: (1) Create a table that reflects both 2012 and 2011 operating ratios for Dayton, Inc., segmented into (a) liquidity, (b) activity, (c) debt, (d) profitability, and (e) market. Assume that the current market price for the stock is $90. (2) Compare the 2012 ratios to the 2011 ratios. Indicate whether the results “outperformed the prior year" or “underperformed relative to the prior year." A B D F Dayton, Inc. Annual Income Statement (Values in Millions) Common Size 2012 2011 2012 2011 Sales $ 178,909 $ 187,510 Cost of Sales 111.631 Gross Operating Profit Selling, General & Admin. Expense 12,356 12,900 Other Taxes 33.572 33.377 EBITDA Depreciation & Amortization EBIT 12.103 7.944 4 Other Income, Net 5 Eamings Before Interest and Taxes 5 Interest Expense 3.147 3.323 398 293 Eamings Before Taxes B Income Taxes 9 Net Income Available to Common 1 Dividends per share 2 EPS $ 1.47 $ 1.71 $ 0.91 $ 2.25 Computation of 2012 Cost of Sales: 5 Beginning Inventory 5 Purchases 7 Goods Available 3 Cost of Sales eEnding Inventory Dayton, Inc. Annual Balance Sheet (Values in Millions) Common Size 2012 2011 2012 2011 Assets Current Assets $ 7,229 $ Cash and Equivalents Receivables p Inventories 21,163 8,068 1.831 6,547 19,549 7,904 Other Current Assets 1.681 Total Current Assets 4 Non-Curret Assets 204,960 $ 110.020 $ 187,519 Property, Plant & Equipment, Gross Accum. Depreciation & Depletion 7 Property, Plant & Equipment, Net B Other Non-Current Assets 97.917 19.413 17.891 Total Non-Current Assets 1 Total Assets 4 5 Liabilities & Shareholder's Equity 6 Current Liabilities 13,792 $ 4,093 -7 Accounts Payable 8 Short Tem Debt 9 Other Current Liabilities 0 Total Current Liabilities -1 $ 22,862 3,703 3.549 15.290 2 Non-Current liabilites $ 6,655 $ 16,484 21.733 3 Long Tem Debt 7,099 4 Deferred Income Taxes 16.359 5 Other Non-Current Liabilities 6 Total Non-Current Liabilities 7 Total Liabilities 16.441 -8 -9 Retained Eamings -o Total Equity 1 -2 Total Liabilities & Stock Equity 74.597 $ 73.161 3 -4 Total Common Shares Outstanding 6.7 Bil 6.8 Bil 5 Treasury Shares 1.3 Bil 1.2 Bil Dayton, Inc. 8, Operating Ratios 6- 2012 2011 Analysis: Compare 2012 to 2011 1 Liquidity 2 Current Ratio 3 Quick Ratio 4 -5 Activity 6 Inventory Turnover 7 Average Days of Inventory -8 A/R Turnover 9 Average Collection Period 0 Fixed Asset Turnover 1 Total Asset Turnover 2 3 Debt 4 Debt-to-Asset Ratio 5 Times Interest Earned 6 7 Profitability 8 Gross Profit Margin 9 Operating Profit Margin p0 Net Profit Margin 01 Return on Assets 22 Return on Equity D3 24 Market Ratios 05 outstanding stock D6 Earnings Per Share D7 Price D8 P/E ratio 09 6,700,000,000 6,800,000,000 $ 90 NA NA 10 11 The income statement and balance sheet are the basic reports that a firm constructs for use by management and for distribution to stockholders, regulatory bodies, and the general public. They are the primary sources of historical financial information about the firm. Dayton Products, Inc., is a moderate-sized manufacturer. The company's management has asked you to perform a detailed financial statement analysis of the firm. CHAPTER 3 Financial Statements and Ratio Analysis 111 The income statements for the years ending December 31, 2012 and 2011, respectively, are presented in the table below. (Note: Purchases of inventory during 2012 amounted to $109,865.) Annual Income Statements (Values in millions) For the year ended December 31, 2012 December 31, 2011 Sales $178,909 $187,510 Cost of goods sold ? 111,631 Selling, general, and administrative expenses 12,356 12,900 Other tax expense 33,572 33,377 Depreciation and amortization Other income (add to EBIT to arrive at EBT) 12,103 7,944 3,147 3,323 Interest expense 398 293 Income tax rate (average) 35.324% 37.945% Dividends paid per share Basic EPS from total operations $1.47 $0.91 $1.71 $2.25 You also have the following balance sheet information as of December 31, 2012 and 2011, respectively. You also have the following balance sheet information as of December 31, 2012 and 2011, respectively. Annual Balance Sheets (Values in millions) December 31, 2012 December, 31, 2011 Cash and equivalents $ 7,229 $ 6,547 Receivables 21,163 19,549 Inventories 8,068 7,904 Other current assets 1,831 1,681 Property, plant, and equipment, gross Accumulated depreciation and depletion 204,960 187,519 110,020 97,917 Other noncurrent assets 19,413 17,891 Accounts payable Short-term debt payable 13,792 22,862 4,093 3,703 Other current liabilities 15,290 3,549 Long-term debt payable Deferred income taxes 6,655 7,099 16,484 16,359 Other noncurrent liabilities 21,733 16,441 Retained earnings 74,597 73,161 Total common shares outstanding 6.7 billion 6.8 billion ТO DO a. Create a spreadsheet similar to Table 3.1 to model the following: (1) A multiple-step comparative income statement for Dayton, Inc., for the periods ending December 31, 2012 and 2011. You must calculate the cost of goods sold for the (2) A common-size income statement for Dayton, Inc., covering the years 2012 and 2011. year 2012. b. Create a spreadsheet similar to Table 3.2 to model the following: (1) A detailed, comparative balance sheet for Dayton, Inc., for the December 31, 2012 and 2011. (2) A common-size balance sheet for Dayton, Inc., covering the years 2012 and years ended 2011. c. Create a spreadsheet similar to Table 3.8 to perform the following analysis: (1) Create a table that reflects both 2012 and 2011 operating ratios for Dayton, Inc., segmented into (a) liquidity, (b) activity, (c) debt, (d) profitability, and (e) market. Assume that the current market price for the stock is $90. (2) Compare the 2012 ratios to the 2011 ratios. Indicate whether the results “outperformed the prior year" or “underperformed relative to the prior year."
Expert Answer:
Answer rating: 100% (QA)
Financial Analysis of Dayton Inc Dayton Inc Annual Income Statement Values in Millio... View the full answer

Related Book For 
Principles Of Managerial Finance
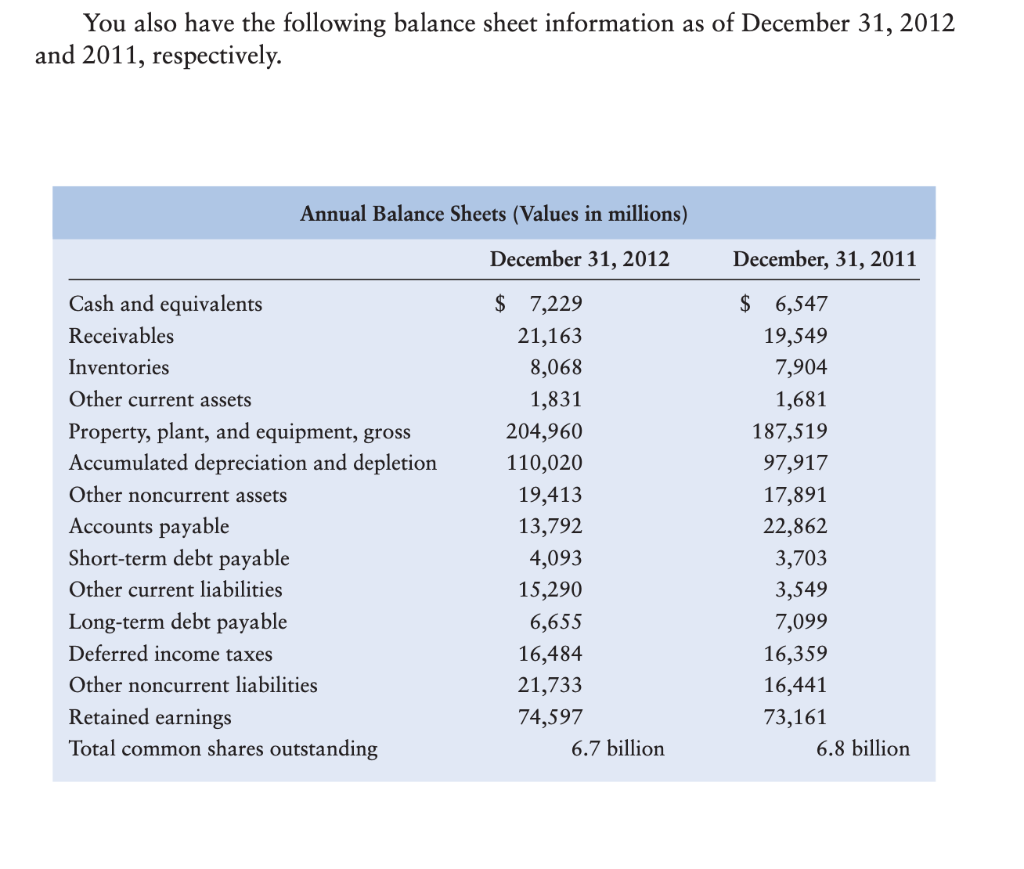
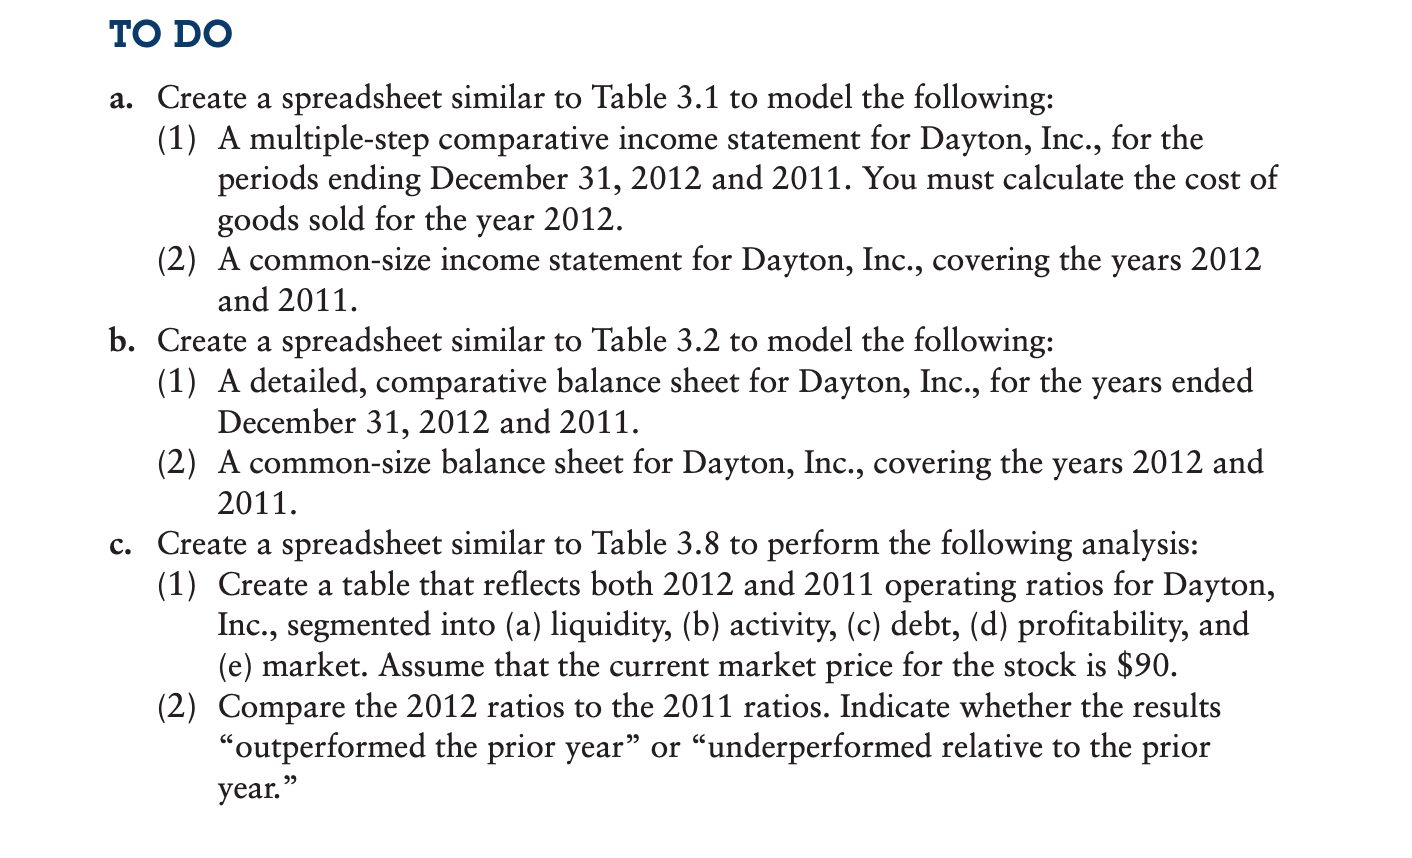
ISBN: 978-0136119463
13th Edition
Authors: Lawrence J. Gitman, Chad J. Zutter
Posted Date:
Students also viewed these accounting questions
-
Ratios to calculate and interpret for the three years. Current Ratio Quick (Acid Test) Ratio Debt to Equity Ratio 2011 2012 2013 Assets Assets Current Cash And Cash Equivalents At Carrying Value...
-
Put the following income statement and balance sheet terms (general ledger accounts) in the proper order for properly prepared financial statements: Taxes, interest, gross profit, selling, general...
-
P 10-3 BBB Company's balance sheet and income statement follow: OMPANY Balance Sheet December 31, 2011 and 2010 December 31, 2011 2010 Assets $ 4,500 2,500 6,800 7,500 21,300 $ 4,000 Cash Marketable...
-
The ordinary share capital of W Ltd (which is a trading company) is owned 30% by X Ltd, 25% by Y Ltd and 45% by Z Ltd. All of these companies are UK resident and they prepare accounts to 31 March....
-
You are a small business owner considering two alternatives for your phone system. The discount rate is 8%. Which alternative would you pick? Plan A Plan B Initial cost (S) 50,000 120,000 Annual...
-
The square deforms into the position shown by the dashed lines. Determine the shear strain at each of its corners, A, B, C, and D, relative to the x, y axes. Side D' B' remains horizontal. 3 mm D' D...
-
Which of the following has been a finding of prior research that has examined whether information systems audit staff should be recruited with an information technology background or an audit...
-
The futures price of corn is $2.00. The contracts are for 10,000 bushels, so a contract is worth $20,000. The margin requirement is $2,000 a contract, and the maintenance margin requirement is...
-
. If $ 3 5 0 0 0 is invested in a hedge fund that pays 1 0 . 7 5 % interest compounded annually, how long will it take for that investment to be worth $ 6 0 0 0 0 ?
-
Find point estimates for the mean and standard deviation of the Months Customer data in the Credit Risk Data file. Draw five random samples of sizes 50 and 250 from the data using the Sampling tool....
-
Graphs, graph algorithms and methods, and graph theory are integral to IT and computer science applications and coding. For this assignment, What is a Hamiltonian cycle? What is a Euler cycle? What...
-
Blood flows through the aorta at an average speed of v = 19cm/s. The aorta is roughly cylindrical with a radius r = 17.6 mm. The volume rate of blood flow through the aorta is r 2 v . Calculate the...
-
1.In theory, what should happen to the plot of your range ( y ) vs. launch angle ( x ) as the launch speed is increased? (a).Clearly state which specific points should change, and which should remain...
-
1. Within 5.0 s of lift-off, a space shuttle reaches an altitude of 525 m, uniformly accelerating during the entire time. (a) What is its acceleration? (b) At what speed is the shuttle travelling...
-
On a clear day, a person lying on a beach. If the sun rays make an angle of 45 from the vertical, what is the rate of energy absorption from the Sun by the person? Assume the surface area of the...
-
You have an object with an unknown electric charge. In other words, it could be neutral, negatively charged, or positively charged. You make two observations about this object. 1. The object of an...
-
Simon Company's year-end balance sheets follow. At December 31 Assets Cash Accounts receivable, net Merchandise inventory Prepaid expenses Plant assets, net Total assets Liabilities and Equity...
-
Wholesalers Ltd. deals in the sale of foodstuffs to retailers. Owing to economic depression, the firm intends to relax its credit policy to boost productivity and sales. The firms current credit...
-
Max Small has outstanding school loans that require a monthly payment of $1,000. He needs to purchase a new car for work and estimates that this will add $350 per month to his existing monthly...
-
For each of the cases shown in the following table, calculate the future value of the single cash flow deposited today at the end of the deposit period if the interest is compounded annually at the...
-
A firm raises capital by selling $20,000 worth of debt with flotation costs equal to 2% of its par value. If the debt matures in 10 years and has a coupon interest rate of 8%, what is the bonds YTM?
-
Camille Stibbe is general manager of Alden Corporation. She suggests that the budgeted income statement and the cash budget seem to show the same information. Therefore, she recommends that one of...
-
Thomas Baker, president of Brundage Corporation, says he has observed that an increase in sales almost always results in an increase in net income. Therefore, he is considering recommending that the...
-
From net sales to the number of warehouses, the ten-year operating and financial highlights on pages B-2-B-3 of Appendix B in this textbook provide a historical perspective to Costco's growth. This...

Study smarter with the SolutionInn App