

A company began January with 6,000 units of its principal product. The cost of each nit...
Fantastic news! We've Found the answer you've been seeking!
Question:
Transcribed Image Text:
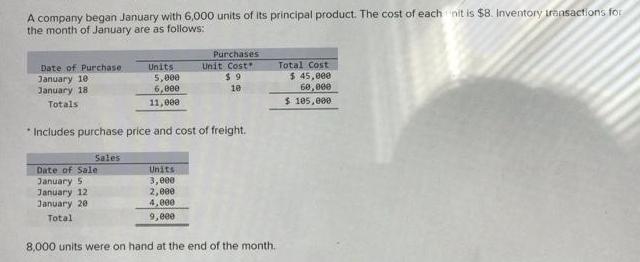
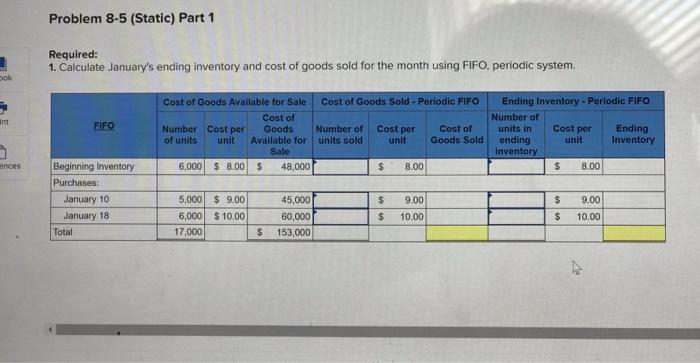
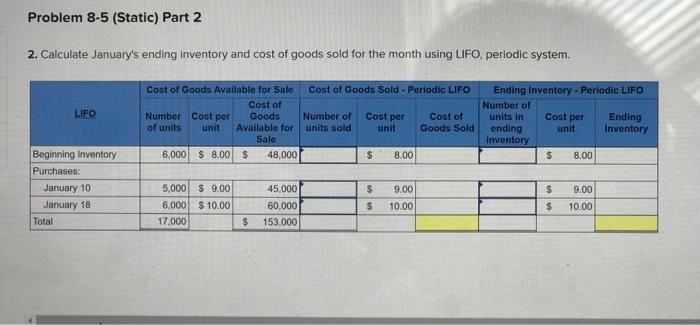
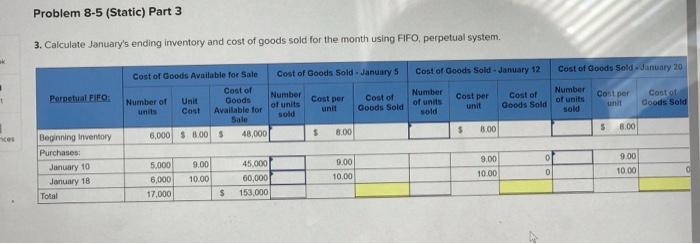
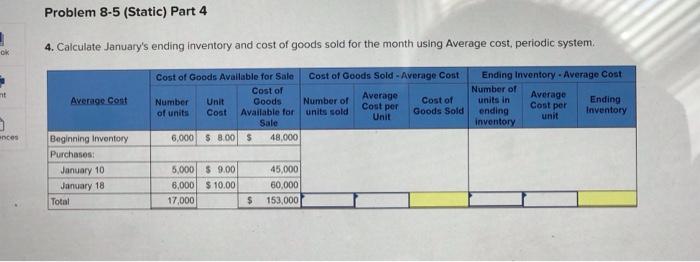
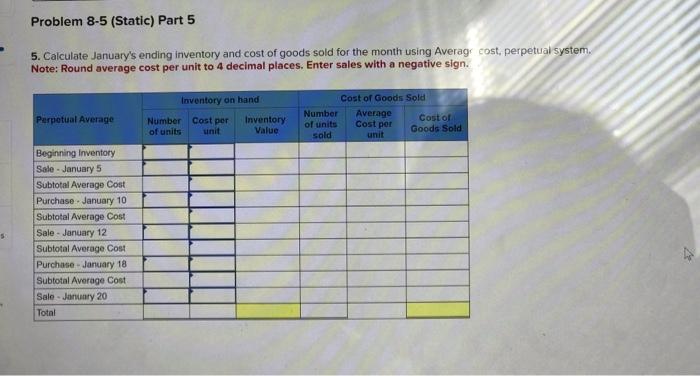
A company began January with 6,000 units of its principal product. The cost of each nit is $8. Inventory transactions for the month of January are as follows: Date of Purchase January 10 January 18 Totals Sales Units Date of Sale January 5 January 12 January 20 Total 5,000 6,000 11,000 * Includes purchase price and cost of freight. Purchases Unit Cost $9 10 Units 3,000 2,000 4,000 9,000 8,000 units were on hand at the end of the month. Total Cost $ 45,000 60,000 $ 105,000 Dok Int ences Problem 8-5 (Static) Part 1 Required: 1. Calculate January's ending inventory and cost of goods sold for the month using FIFO, periodic system. FIFO Beginning Inventory Purchases: January 10 January 18 Total Cost of Goods Available for Sale Cost of Goods Available for Sale $ 48,000 Number Cost per of units unit 6,000 $8.00 5,000 $9.00 6,000 $10.00 17,000 45,000 60,000 $ 153,000 Cost of Goods Sold - Periodic FIFO Number of units sold Cost per unit $ $ $ 8.00 9.00 10.00 Cost of Goods Sold Ending Inventory - Periodic FIFO Number of units in ending inventory Cost per unit $ 8.00 $ 9.00 $ 10.00 Ending Inventory Problem 8-5 (Static) Part 2 2. Calculate January's ending inventory and cost of goods sold for the month using LIFO, periodic system. LIFO Beginning Inventory Purchases: January 10 January 18- Total Cost of Goods Available for Sale Cost of Goods Available for Sale 6,000 $8.00 S 48,000 Number Cost per of units unit 5,000 $9.00 6,000 $10.00 17,000 45,000 60,000 $ 153,000 Cost of Goods Sold - Periodic LIFO Number of units sold Cost per unit $ $ $ 8.00 9.00 10.00 Cost of Goods Sold Ending Inventory - Periodic LIFO Number of units in ending inventory Cost per unit $ 8.00 $ 9.00 $ 10.00 Ending Inventory I ces Problem 8-5 (Static) Part 3 3. Calculate January's ending inventory and cost of goods sold for the month using FIFO, perpetual system. Perpetual FIFO: Beginning Inventory Purchases: January 10 January 18 Total Cost of Goods Available for Sale Cost of Goods Available for Sale Unit Cost 6,000 $8.00 $ Number of units 5,000 9.00 6,000 10.00 17,000 48,000 45,000 60,000 $ 153,000 Cost of Goods Sold-January 5 Number of units sold Cost per unit $ 8.00 9.00 10.00 Cost of Goods Sold Cost of Goods Sold-January 12 Number of units sold Cost per unit $ 8.00 9,00 10.00 Cost of Goods Sold 0 0 Cost of Goods Sold-January 20 Number of units sold Cost per 5 8.00 9.00 10.00 Cost of Goods Sold O 1 ok mt 0 ences Problem 8-5 (Static) Part 4 4. Calculate January's ending inventory and cost of goods sold for the month using Average cost, periodic system. Cost of Goods Available for Sale Cost of Goods Sold - Average Cost Cost of Goods Average Cost per Unit Average Cost Beginning Inventory Purchases: January 10 January 18 Total Number Unit of units Cost Available for Sale 6,000 $8.00 $ 48,000 5,000 $9.00 6,000 $10.00 17,000 45,000 60,000 $ 153,000 Number of units sold Cost of Goods Sold Number of units in ending inventory Ending Inventory-Average Cost Average Cost per unit Ending Inventory S Problem 8-5 (Static) Part 5 5. Calculate January's ending inventory and cost of goods sold for the month using Average cost, perpetual system. Note: Round average cost per unit to 4 decimal places. Enter sales with a negative sign. Perpetual Average Beginning Inventory Sale - January 5 Subtotal Average Cost Purchase January 10 Subtotal Average Cost Sale - January 12 Subtotal Average Cost Purchase-January 18 Subtotal Average Cost Sale January 20 Total Inventory on hand Number Cost per of units unit Inventory Value Number of units sold Cost of Goods Sold Average Cost per unit Cost of Goods Sold A company began January with 6,000 units of its principal product. The cost of each nit is $8. Inventory transactions for the month of January are as follows: Date of Purchase January 10 January 18 Totals Sales Units Date of Sale January 5 January 12 January 20 Total 5,000 6,000 11,000 * Includes purchase price and cost of freight. Purchases Unit Cost $9 10 Units 3,000 2,000 4,000 9,000 8,000 units were on hand at the end of the month. Total Cost $ 45,000 60,000 $ 105,000 Dok Int ences Problem 8-5 (Static) Part 1 Required: 1. Calculate January's ending inventory and cost of goods sold for the month using FIFO, periodic system. FIFO Beginning Inventory Purchases: January 10 January 18 Total Cost of Goods Available for Sale Cost of Goods Available for Sale $ 48,000 Number Cost per of units unit 6,000 $8.00 5,000 $9.00 6,000 $10.00 17,000 45,000 60,000 $ 153,000 Cost of Goods Sold - Periodic FIFO Number of units sold Cost per unit $ $ $ 8.00 9.00 10.00 Cost of Goods Sold Ending Inventory - Periodic FIFO Number of units in ending inventory Cost per unit $ 8.00 $ 9.00 $ 10.00 Ending Inventory Problem 8-5 (Static) Part 2 2. Calculate January's ending inventory and cost of goods sold for the month using LIFO, periodic system. LIFO Beginning Inventory Purchases: January 10 January 18- Total Cost of Goods Available for Sale Cost of Goods Available for Sale 6,000 $8.00 S 48,000 Number Cost per of units unit 5,000 $9.00 6,000 $10.00 17,000 45,000 60,000 $ 153,000 Cost of Goods Sold - Periodic LIFO Number of units sold Cost per unit $ $ $ 8.00 9.00 10.00 Cost of Goods Sold Ending Inventory - Periodic LIFO Number of units in ending inventory Cost per unit $ 8.00 $ 9.00 $ 10.00 Ending Inventory I ces Problem 8-5 (Static) Part 3 3. Calculate January's ending inventory and cost of goods sold for the month using FIFO, perpetual system. Perpetual FIFO: Beginning Inventory Purchases: January 10 January 18 Total Cost of Goods Available for Sale Cost of Goods Available for Sale Unit Cost 6,000 $8.00 $ Number of units 5,000 9.00 6,000 10.00 17,000 48,000 45,000 60,000 $ 153,000 Cost of Goods Sold-January 5 Number of units sold Cost per unit $ 8.00 9.00 10.00 Cost of Goods Sold Cost of Goods Sold-January 12 Number of units sold Cost per unit $ 8.00 9,00 10.00 Cost of Goods Sold 0 0 Cost of Goods Sold-January 20 Number of units sold Cost per 5 8.00 9.00 10.00 Cost of Goods Sold O 1 ok mt 0 ences Problem 8-5 (Static) Part 4 4. Calculate January's ending inventory and cost of goods sold for the month using Average cost, periodic system. Cost of Goods Available for Sale Cost of Goods Sold - Average Cost Cost of Goods Average Cost per Unit Average Cost Beginning Inventory Purchases: January 10 January 18 Total Number Unit of units Cost Available for Sale 6,000 $8.00 $ 48,000 5,000 $9.00 6,000 $10.00 17,000 45,000 60,000 $ 153,000 Number of units sold Cost of Goods Sold Number of units in ending inventory Ending Inventory-Average Cost Average Cost per unit Ending Inventory S Problem 8-5 (Static) Part 5 5. Calculate January's ending inventory and cost of goods sold for the month using Average cost, perpetual system. Note: Round average cost per unit to 4 decimal places. Enter sales with a negative sign. Perpetual Average Beginning Inventory Sale - January 5 Subtotal Average Cost Purchase January 10 Subtotal Average Cost Sale - January 12 Subtotal Average Cost Purchase-January 18 Subtotal Average Cost Sale January 20 Total Inventory on hand Number Cost per of units unit Inventory Value Number of units sold Cost of Goods Sold Average Cost per unit Cost of Goods Sold A company began January with 6,000 units of its principal product. The cost of each nit is $8. Inventory transactions for the month of January are as follows: Date of Purchase January 10 January 18 Totals Sales Units Date of Sale January 5 January 12 January 20 Total 5,000 6,000 11,000 * Includes purchase price and cost of freight. Purchases Unit Cost $9 10 Units 3,000 2,000 4,000 9,000 8,000 units were on hand at the end of the month. Total Cost $ 45,000 60,000 $ 105,000 Dok Int ences Problem 8-5 (Static) Part 1 Required: 1. Calculate January's ending inventory and cost of goods sold for the month using FIFO, periodic system. FIFO Beginning Inventory Purchases: January 10 January 18 Total Cost of Goods Available for Sale Cost of Goods Available for Sale $ 48,000 Number Cost per of units unit 6,000 $8.00 5,000 $9.00 6,000 $10.00 17,000 45,000 60,000 $ 153,000 Cost of Goods Sold - Periodic FIFO Number of units sold Cost per unit $ $ $ 8.00 9.00 10.00 Cost of Goods Sold Ending Inventory - Periodic FIFO Number of units in ending inventory Cost per unit $ 8.00 $ 9.00 $ 10.00 Ending Inventory Problem 8-5 (Static) Part 2 2. Calculate January's ending inventory and cost of goods sold for the month using LIFO, periodic system. LIFO Beginning Inventory Purchases: January 10 January 18- Total Cost of Goods Available for Sale Cost of Goods Available for Sale 6,000 $8.00 S 48,000 Number Cost per of units unit 5,000 $9.00 6,000 $10.00 17,000 45,000 60,000 $ 153,000 Cost of Goods Sold - Periodic LIFO Number of units sold Cost per unit $ $ $ 8.00 9.00 10.00 Cost of Goods Sold Ending Inventory - Periodic LIFO Number of units in ending inventory Cost per unit $ 8.00 $ 9.00 $ 10.00 Ending Inventory I ces Problem 8-5 (Static) Part 3 3. Calculate January's ending inventory and cost of goods sold for the month using FIFO, perpetual system. Perpetual FIFO: Beginning Inventory Purchases: January 10 January 18 Total Cost of Goods Available for Sale Cost of Goods Available for Sale Unit Cost 6,000 $8.00 $ Number of units 5,000 9.00 6,000 10.00 17,000 48,000 45,000 60,000 $ 153,000 Cost of Goods Sold-January 5 Number of units sold Cost per unit $ 8.00 9.00 10.00 Cost of Goods Sold Cost of Goods Sold-January 12 Number of units sold Cost per unit $ 8.00 9,00 10.00 Cost of Goods Sold 0 0 Cost of Goods Sold-January 20 Number of units sold Cost per 5 8.00 9.00 10.00 Cost of Goods Sold O 1 ok mt 0 ences Problem 8-5 (Static) Part 4 4. Calculate January's ending inventory and cost of goods sold for the month using Average cost, periodic system. Cost of Goods Available for Sale Cost of Goods Sold - Average Cost Cost of Goods Average Cost per Unit Average Cost Beginning Inventory Purchases: January 10 January 18 Total Number Unit of units Cost Available for Sale 6,000 $8.00 $ 48,000 5,000 $9.00 6,000 $10.00 17,000 45,000 60,000 $ 153,000 Number of units sold Cost of Goods Sold Number of units in ending inventory Ending Inventory-Average Cost Average Cost per unit Ending Inventory S Problem 8-5 (Static) Part 5 5. Calculate January's ending inventory and cost of goods sold for the month using Average cost, perpetual system. Note: Round average cost per unit to 4 decimal places. Enter sales with a negative sign. Perpetual Average Beginning Inventory Sale - January 5 Subtotal Average Cost Purchase January 10 Subtotal Average Cost Sale - January 12 Subtotal Average Cost Purchase-January 18 Subtotal Average Cost Sale January 20 Total Inventory on hand Number Cost per of units unit Inventory Value Number of units sold Cost of Goods Sold Average Cost per unit Cost of Goods Sold A company began January with 6,000 units of its principal product. The cost of each nit is $8. Inventory transactions for the month of January are as follows: Date of Purchase January 10 January 18 Totals Sales Units Date of Sale January 5 January 12 January 20 Total 5,000 6,000 11,000 * Includes purchase price and cost of freight. Purchases Unit Cost $9 10 Units 3,000 2,000 4,000 9,000 8,000 units were on hand at the end of the month. Total Cost $ 45,000 60,000 $ 105,000 Dok Int ences Problem 8-5 (Static) Part 1 Required: 1. Calculate January's ending inventory and cost of goods sold for the month using FIFO, periodic system. FIFO Beginning Inventory Purchases: January 10 January 18 Total Cost of Goods Available for Sale Cost of Goods Available for Sale $ 48,000 Number Cost per of units unit 6,000 $8.00 5,000 $9.00 6,000 $10.00 17,000 45,000 60,000 $ 153,000 Cost of Goods Sold - Periodic FIFO Number of units sold Cost per unit $ $ $ 8.00 9.00 10.00 Cost of Goods Sold Ending Inventory - Periodic FIFO Number of units in ending inventory Cost per unit $ 8.00 $ 9.00 $ 10.00 Ending Inventory Problem 8-5 (Static) Part 2 2. Calculate January's ending inventory and cost of goods sold for the month using LIFO, periodic system. LIFO Beginning Inventory Purchases: January 10 January 18- Total Cost of Goods Available for Sale Cost of Goods Available for Sale 6,000 $8.00 S 48,000 Number Cost per of units unit 5,000 $9.00 6,000 $10.00 17,000 45,000 60,000 $ 153,000 Cost of Goods Sold - Periodic LIFO Number of units sold Cost per unit $ $ $ 8.00 9.00 10.00 Cost of Goods Sold Ending Inventory - Periodic LIFO Number of units in ending inventory Cost per unit $ 8.00 $ 9.00 $ 10.00 Ending Inventory I ces Problem 8-5 (Static) Part 3 3. Calculate January's ending inventory and cost of goods sold for the month using FIFO, perpetual system. Perpetual FIFO: Beginning Inventory Purchases: January 10 January 18 Total Cost of Goods Available for Sale Cost of Goods Available for Sale Unit Cost 6,000 $8.00 $ Number of units 5,000 9.00 6,000 10.00 17,000 48,000 45,000 60,000 $ 153,000 Cost of Goods Sold-January 5 Number of units sold Cost per unit $ 8.00 9.00 10.00 Cost of Goods Sold Cost of Goods Sold-January 12 Number of units sold Cost per unit $ 8.00 9,00 10.00 Cost of Goods Sold 0 0 Cost of Goods Sold-January 20 Number of units sold Cost per 5 8.00 9.00 10.00 Cost of Goods Sold O 1 ok mt 0 ences Problem 8-5 (Static) Part 4 4. Calculate January's ending inventory and cost of goods sold for the month using Average cost, periodic system. Cost of Goods Available for Sale Cost of Goods Sold - Average Cost Cost of Goods Average Cost per Unit Average Cost Beginning Inventory Purchases: January 10 January 18 Total Number Unit of units Cost Available for Sale 6,000 $8.00 $ 48,000 5,000 $9.00 6,000 $10.00 17,000 45,000 60,000 $ 153,000 Number of units sold Cost of Goods Sold Number of units in ending inventory Ending Inventory-Average Cost Average Cost per unit Ending Inventory S Problem 8-5 (Static) Part 5 5. Calculate January's ending inventory and cost of goods sold for the month using Average cost, perpetual system. Note: Round average cost per unit to 4 decimal places. Enter sales with a negative sign. Perpetual Average Beginning Inventory Sale - January 5 Subtotal Average Cost Purchase January 10 Subtotal Average Cost Sale - January 12 Subtotal Average Cost Purchase-January 18 Subtotal Average Cost Sale January 20 Total Inventory on hand Number Cost per of units unit Inventory Value Number of units sold Cost of Goods Sold Average Cost per unit Cost of Goods Sold A company began January with 6,000 units of its principal product. The cost of each nit is $8. Inventory transactions for the month of January are as follows: Date of Purchase January 10 January 18 Totals Sales Units Date of Sale January 5 January 12 January 20 Total 5,000 6,000 11,000 * Includes purchase price and cost of freight. Purchases Unit Cost $9 10 Units 3,000 2,000 4,000 9,000 8,000 units were on hand at the end of the month. Total Cost $ 45,000 60,000 $ 105,000 Dok Int ences Problem 8-5 (Static) Part 1 Required: 1. Calculate January's ending inventory and cost of goods sold for the month using FIFO, periodic system. FIFO Beginning Inventory Purchases: January 10 January 18 Total Cost of Goods Available for Sale Cost of Goods Available for Sale $ 48,000 Number Cost per of units unit 6,000 $8.00 5,000 $9.00 6,000 $10.00 17,000 45,000 60,000 $ 153,000 Cost of Goods Sold - Periodic FIFO Number of units sold Cost per unit $ $ $ 8.00 9.00 10.00 Cost of Goods Sold Ending Inventory - Periodic FIFO Number of units in ending inventory Cost per unit $ 8.00 $ 9.00 $ 10.00 Ending Inventory Problem 8-5 (Static) Part 2 2. Calculate January's ending inventory and cost of goods sold for the month using LIFO, periodic system. LIFO Beginning Inventory Purchases: January 10 January 18- Total Cost of Goods Available for Sale Cost of Goods Available for Sale 6,000 $8.00 S 48,000 Number Cost per of units unit 5,000 $9.00 6,000 $10.00 17,000 45,000 60,000 $ 153,000 Cost of Goods Sold - Periodic LIFO Number of units sold Cost per unit $ $ $ 8.00 9.00 10.00 Cost of Goods Sold Ending Inventory - Periodic LIFO Number of units in ending inventory Cost per unit $ 8.00 $ 9.00 $ 10.00 Ending Inventory I ces Problem 8-5 (Static) Part 3 3. Calculate January's ending inventory and cost of goods sold for the month using FIFO, perpetual system. Perpetual FIFO: Beginning Inventory Purchases: January 10 January 18 Total Cost of Goods Available for Sale Cost of Goods Available for Sale Unit Cost 6,000 $8.00 $ Number of units 5,000 9.00 6,000 10.00 17,000 48,000 45,000 60,000 $ 153,000 Cost of Goods Sold-January 5 Number of units sold Cost per unit $ 8.00 9.00 10.00 Cost of Goods Sold Cost of Goods Sold-January 12 Number of units sold Cost per unit $ 8.00 9,00 10.00 Cost of Goods Sold 0 0 Cost of Goods Sold-January 20 Number of units sold Cost per 5 8.00 9.00 10.00 Cost of Goods Sold O 1 ok mt 0 ences Problem 8-5 (Static) Part 4 4. Calculate January's ending inventory and cost of goods sold for the month using Average cost, periodic system. Cost of Goods Available for Sale Cost of Goods Sold - Average Cost Cost of Goods Average Cost per Unit Average Cost Beginning Inventory Purchases: January 10 January 18 Total Number Unit of units Cost Available for Sale 6,000 $8.00 $ 48,000 5,000 $9.00 6,000 $10.00 17,000 45,000 60,000 $ 153,000 Number of units sold Cost of Goods Sold Number of units in ending inventory Ending Inventory-Average Cost Average Cost per unit Ending Inventory S Problem 8-5 (Static) Part 5 5. Calculate January's ending inventory and cost of goods sold for the month using Average cost, perpetual system. Note: Round average cost per unit to 4 decimal places. Enter sales with a negative sign. Perpetual Average Beginning Inventory Sale - January 5 Subtotal Average Cost Purchase January 10 Subtotal Average Cost Sale - January 12 Subtotal Average Cost Purchase-January 18 Subtotal Average Cost Sale January 20 Total Inventory on hand Number Cost per of units unit Inventory Value Number of units sold Cost of Goods Sold Average Cost per unit Cost of Goods Sold A company began January with 6,000 units of its principal product. The cost of each nit is $8. Inventory transactions for the month of January are as follows: Date of Purchase January 10 January 18 Totals Sales Units Date of Sale January 5 January 12 January 20 Total 5,000 6,000 11,000 * Includes purchase price and cost of freight. Purchases Unit Cost $9 10 Units 3,000 2,000 4,000 9,000 8,000 units were on hand at the end of the month. Total Cost $ 45,000 60,000 $ 105,000 Dok Int ences Problem 8-5 (Static) Part 1 Required: 1. Calculate January's ending inventory and cost of goods sold for the month using FIFO, periodic system. FIFO Beginning Inventory Purchases: January 10 January 18 Total Cost of Goods Available for Sale Cost of Goods Available for Sale $ 48,000 Number Cost per of units unit 6,000 $8.00 5,000 $9.00 6,000 $10.00 17,000 45,000 60,000 $ 153,000 Cost of Goods Sold - Periodic FIFO Number of units sold Cost per unit $ $ $ 8.00 9.00 10.00 Cost of Goods Sold Ending Inventory - Periodic FIFO Number of units in ending inventory Cost per unit $ 8.00 $ 9.00 $ 10.00 Ending Inventory Problem 8-5 (Static) Part 2 2. Calculate January's ending inventory and cost of goods sold for the month using LIFO, periodic system. LIFO Beginning Inventory Purchases: January 10 January 18- Total Cost of Goods Available for Sale Cost of Goods Available for Sale 6,000 $8.00 S 48,000 Number Cost per of units unit 5,000 $9.00 6,000 $10.00 17,000 45,000 60,000 $ 153,000 Cost of Goods Sold - Periodic LIFO Number of units sold Cost per unit $ $ $ 8.00 9.00 10.00 Cost of Goods Sold Ending Inventory - Periodic LIFO Number of units in ending inventory Cost per unit $ 8.00 $ 9.00 $ 10.00 Ending Inventory I ces Problem 8-5 (Static) Part 3 3. Calculate January's ending inventory and cost of goods sold for the month using FIFO, perpetual system. Perpetual FIFO: Beginning Inventory Purchases: January 10 January 18 Total Cost of Goods Available for Sale Cost of Goods Available for Sale Unit Cost 6,000 $8.00 $ Number of units 5,000 9.00 6,000 10.00 17,000 48,000 45,000 60,000 $ 153,000 Cost of Goods Sold-January 5 Number of units sold Cost per unit $ 8.00 9.00 10.00 Cost of Goods Sold Cost of Goods Sold-January 12 Number of units sold Cost per unit $ 8.00 9,00 10.00 Cost of Goods Sold 0 0 Cost of Goods Sold-January 20 Number of units sold Cost per 5 8.00 9.00 10.00 Cost of Goods Sold O 1 ok mt 0 ences Problem 8-5 (Static) Part 4 4. Calculate January's ending inventory and cost of goods sold for the month using Average cost, periodic system. Cost of Goods Available for Sale Cost of Goods Sold - Average Cost Cost of Goods Average Cost per Unit Average Cost Beginning Inventory Purchases: January 10 January 18 Total Number Unit of units Cost Available for Sale 6,000 $8.00 $ 48,000 5,000 $9.00 6,000 $10.00 17,000 45,000 60,000 $ 153,000 Number of units sold Cost of Goods Sold Number of units in ending inventory Ending Inventory-Average Cost Average Cost per unit Ending Inventory S Problem 8-5 (Static) Part 5 5. Calculate January's ending inventory and cost of goods sold for the month using Average cost, perpetual system. Note: Round average cost per unit to 4 decimal places. Enter sales with a negative sign. Perpetual Average Beginning Inventory Sale - January 5 Subtotal Average Cost Purchase January 10 Subtotal Average Cost Sale - January 12 Subtotal Average Cost Purchase-January 18 Subtotal Average Cost Sale January 20 Total Inventory on hand Number Cost per of units unit Inventory Value Number of units sold Cost of Goods Sold Average Cost per unit Cost of Goods Sold A company began January with 6,000 units of its principal product. The cost of each nit is $8. Inventory transactions for the month of January are as follows: Date of Purchase January 10 January 18 Totals Sales Units Date of Sale January 5 January 12 January 20 Total 5,000 6,000 11,000 * Includes purchase price and cost of freight. Purchases Unit Cost $9 10 Units 3,000 2,000 4,000 9,000 8,000 units were on hand at the end of the month. Total Cost $ 45,000 60,000 $ 105,000 Dok Int ences Problem 8-5 (Static) Part 1 Required: 1. Calculate January's ending inventory and cost of goods sold for the month using FIFO, periodic system. FIFO Beginning Inventory Purchases: January 10 January 18 Total Cost of Goods Available for Sale Cost of Goods Available for Sale $ 48,000 Number Cost per of units unit 6,000 $8.00 5,000 $9.00 6,000 $10.00 17,000 45,000 60,000 $ 153,000 Cost of Goods Sold - Periodic FIFO Number of units sold Cost per unit $ $ $ 8.00 9.00 10.00 Cost of Goods Sold Ending Inventory - Periodic FIFO Number of units in ending inventory Cost per unit $ 8.00 $ 9.00 $ 10.00 Ending Inventory Problem 8-5 (Static) Part 2 2. Calculate January's ending inventory and cost of goods sold for the month using LIFO, periodic system. LIFO Beginning Inventory Purchases: January 10 January 18- Total Cost of Goods Available for Sale Cost of Goods Available for Sale 6,000 $8.00 S 48,000 Number Cost per of units unit 5,000 $9.00 6,000 $10.00 17,000 45,000 60,000 $ 153,000 Cost of Goods Sold - Periodic LIFO Number of units sold Cost per unit $ $ $ 8.00 9.00 10.00 Cost of Goods Sold Ending Inventory - Periodic LIFO Number of units in ending inventory Cost per unit $ 8.00 $ 9.00 $ 10.00 Ending Inventory I ces Problem 8-5 (Static) Part 3 3. Calculate January's ending inventory and cost of goods sold for the month using FIFO, perpetual system. Perpetual FIFO: Beginning Inventory Purchases: January 10 January 18 Total Cost of Goods Available for Sale Cost of Goods Available for Sale Unit Cost 6,000 $8.00 $ Number of units 5,000 9.00 6,000 10.00 17,000 48,000 45,000 60,000 $ 153,000 Cost of Goods Sold-January 5 Number of units sold Cost per unit $ 8.00 9.00 10.00 Cost of Goods Sold Cost of Goods Sold-January 12 Number of units sold Cost per unit $ 8.00 9,00 10.00 Cost of Goods Sold 0 0 Cost of Goods Sold-January 20 Number of units sold Cost per 5 8.00 9.00 10.00 Cost of Goods Sold O 1 ok mt 0 ences Problem 8-5 (Static) Part 4 4. Calculate January's ending inventory and cost of goods sold for the month using Average cost, periodic system. Cost of Goods Available for Sale Cost of Goods Sold - Average Cost Cost of Goods Average Cost per Unit Average Cost Beginning Inventory Purchases: January 10 January 18 Total Number Unit of units Cost Available for Sale 6,000 $8.00 $ 48,000 5,000 $9.00 6,000 $10.00 17,000 45,000 60,000 $ 153,000 Number of units sold Cost of Goods Sold Number of units in ending inventory Ending Inventory-Average Cost Average Cost per unit Ending Inventory S Problem 8-5 (Static) Part 5 5. Calculate January's ending inventory and cost of goods sold for the month using Average cost, perpetual system. Note: Round average cost per unit to 4 decimal places. Enter sales with a negative sign. Perpetual Average Beginning Inventory Sale - January 5 Subtotal Average Cost Purchase January 10 Subtotal Average Cost Sale - January 12 Subtotal Average Cost Purchase-January 18 Subtotal Average Cost Sale January 20 Total Inventory on hand Number Cost per of units unit Inventory Value Number of units sold Cost of Goods Sold Average Cost per unit Cost of Goods Sold A company began January with 6,000 units of its principal product. The cost of each nit is $8. Inventory transactions for the month of January are as follows: Date of Purchase January 10 January 18 Totals Sales Units Date of Sale January 5 January 12 January 20 Total 5,000 6,000 11,000 * Includes purchase price and cost of freight. Purchases Unit Cost $9 10 Units 3,000 2,000 4,000 9,000 8,000 units were on hand at the end of the month. Total Cost $ 45,000 60,000 $ 105,000 Dok Int ences Problem 8-5 (Static) Part 1 Required: 1. Calculate January's ending inventory and cost of goods sold for the month using FIFO, periodic system. FIFO Beginning Inventory Purchases: January 10 January 18 Total Cost of Goods Available for Sale Cost of Goods Available for Sale $ 48,000 Number Cost per of units unit 6,000 $8.00 5,000 $9.00 6,000 $10.00 17,000 45,000 60,000 $ 153,000 Cost of Goods Sold - Periodic FIFO Number of units sold Cost per unit $ $ $ 8.00 9.00 10.00 Cost of Goods Sold Ending Inventory - Periodic FIFO Number of units in ending inventory Cost per unit $ 8.00 $ 9.00 $ 10.00 Ending Inventory Problem 8-5 (Static) Part 2 2. Calculate January's ending inventory and cost of goods sold for the month using LIFO, periodic system. LIFO Beginning Inventory Purchases: January 10 January 18- Total Cost of Goods Available for Sale Cost of Goods Available for Sale 6,000 $8.00 S 48,000 Number Cost per of units unit 5,000 $9.00 6,000 $10.00 17,000 45,000 60,000 $ 153,000 Cost of Goods Sold - Periodic LIFO Number of units sold Cost per unit $ $ $ 8.00 9.00 10.00 Cost of Goods Sold Ending Inventory - Periodic LIFO Number of units in ending inventory Cost per unit $ 8.00 $ 9.00 $ 10.00 Ending Inventory I ces Problem 8-5 (Static) Part 3 3. Calculate January's ending inventory and cost of goods sold for the month using FIFO, perpetual system. Perpetual FIFO: Beginning Inventory Purchases: January 10 January 18 Total Cost of Goods Available for Sale Cost of Goods Available for Sale Unit Cost 6,000 $8.00 $ Number of units 5,000 9.00 6,000 10.00 17,000 48,000 45,000 60,000 $ 153,000 Cost of Goods Sold-January 5 Number of units sold Cost per unit $ 8.00 9.00 10.00 Cost of Goods Sold Cost of Goods Sold-January 12 Number of units sold Cost per unit $ 8.00 9,00 10.00 Cost of Goods Sold 0 0 Cost of Goods Sold-January 20 Number of units sold Cost per 5 8.00 9.00 10.00 Cost of Goods Sold O 1 ok mt 0 ences Problem 8-5 (Static) Part 4 4. Calculate January's ending inventory and cost of goods sold for the month using Average cost, periodic system. Cost of Goods Available for Sale Cost of Goods Sold - Average Cost Cost of Goods Average Cost per Unit Average Cost Beginning Inventory Purchases: January 10 January 18 Total Number Unit of units Cost Available for Sale 6,000 $8.00 $ 48,000 5,000 $9.00 6,000 $10.00 17,000 45,000 60,000 $ 153,000 Number of units sold Cost of Goods Sold Number of units in ending inventory Ending Inventory-Average Cost Average Cost per unit Ending Inventory S Problem 8-5 (Static) Part 5 5. Calculate January's ending inventory and cost of goods sold for the month using Average cost, perpetual system. Note: Round average cost per unit to 4 decimal places. Enter sales with a negative sign. Perpetual Average Beginning Inventory Sale - January 5 Subtotal Average Cost Purchase January 10 Subtotal Average Cost Sale - January 12 Subtotal Average Cost Purchase-January 18 Subtotal Average Cost Sale January 20 Total Inventory on hand Number Cost per of units unit Inventory Value Number of units sold Cost of Goods Sold Average Cost per unit Cost of Goods Sold A company began January with 6,000 units of its principal product. The cost of each nit is $8. Inventory transactions for the month of January are as follows: Date of Purchase January 10 January 18 Totals Sales Units Date of Sale January 5 January 12 January 20 Total 5,000 6,000 11,000 * Includes purchase price and cost of freight. Purchases Unit Cost $9 10 Units 3,000 2,000 4,000 9,000 8,000 units were on hand at the end of the month. Total Cost $ 45,000 60,000 $ 105,000 Dok Int ences Problem 8-5 (Static) Part 1 Required: 1. Calculate January's ending inventory and cost of goods sold for the month using FIFO, periodic system. FIFO Beginning Inventory Purchases: January 10 January 18 Total Cost of Goods Available for Sale Cost of Goods Available for Sale $ 48,000 Number Cost per of units unit 6,000 $8.00 5,000 $9.00 6,000 $10.00 17,000 45,000 60,000 $ 153,000 Cost of Goods Sold - Periodic FIFO Number of units sold Cost per unit $ $ $ 8.00 9.00 10.00 Cost of Goods Sold Ending Inventory - Periodic FIFO Number of units in ending inventory Cost per unit $ 8.00 $ 9.00 $ 10.00 Ending Inventory Problem 8-5 (Static) Part 2 2. Calculate January's ending inventory and cost of goods sold for the month using LIFO, periodic system. LIFO Beginning Inventory Purchases: January 10 January 18- Total Cost of Goods Available for Sale Cost of Goods Available for Sale 6,000 $8.00 S 48,000 Number Cost per of units unit 5,000 $9.00 6,000 $10.00 17,000 45,000 60,000 $ 153,000 Cost of Goods Sold - Periodic LIFO Number of units sold Cost per unit $ $ $ 8.00 9.00 10.00 Cost of Goods Sold Ending Inventory - Periodic LIFO Number of units in ending inventory Cost per unit $ 8.00 $ 9.00 $ 10.00 Ending Inventory I ces Problem 8-5 (Static) Part 3 3. Calculate January's ending inventory and cost of goods sold for the month using FIFO, perpetual system. Perpetual FIFO: Beginning Inventory Purchases: January 10 January 18 Total Cost of Goods Available for Sale Cost of Goods Available for Sale Unit Cost 6,000 $8.00 $ Number of units 5,000 9.00 6,000 10.00 17,000 48,000 45,000 60,000 $ 153,000 Cost of Goods Sold-January 5 Number of units sold Cost per unit $ 8.00 9.00 10.00 Cost of Goods Sold Cost of Goods Sold-January 12 Number of units sold Cost per unit $ 8.00 9,00 10.00 Cost of Goods Sold 0 0 Cost of Goods Sold-January 20 Number of units sold Cost per 5 8.00 9.00 10.00 Cost of Goods Sold O 1 ok mt 0 ences Problem 8-5 (Static) Part 4 4. Calculate January's ending inventory and cost of goods sold for the month using Average cost, periodic system. Cost of Goods Available for Sale Cost of Goods Sold - Average Cost Cost of Goods Average Cost per Unit Average Cost Beginning Inventory Purchases: January 10 January 18 Total Number Unit of units Cost Available for Sale 6,000 $8.00 $ 48,000 5,000 $9.00 6,000 $10.00 17,000 45,000 60,000 $ 153,000 Number of units sold Cost of Goods Sold Number of units in ending inventory Ending Inventory-Average Cost Average Cost per unit Ending Inventory S Problem 8-5 (Static) Part 5 5. Calculate January's ending inventory and cost of goods sold for the month using Average cost, perpetual system. Note: Round average cost per unit to 4 decimal places. Enter sales with a negative sign. Perpetual Average Beginning Inventory Sale - January 5 Subtotal Average Cost Purchase January 10 Subtotal Average Cost Sale - January 12 Subtotal Average Cost Purchase-January 18 Subtotal Average Cost Sale January 20 Total Inventory on hand Number Cost per of units unit Inventory Value Number of units sold Cost of Goods Sold Average Cost per unit Cost of Goods Sold A company began January with 6,000 units of its principal product. The cost of each nit is $8. Inventory transactions for the month of January are as follows: Date of Purchase January 10 January 18 Totals Sales Units Date of Sale January 5 January 12 January 20 Total 5,000 6,000 11,000 * Includes purchase price and cost of freight. Purchases Unit Cost $9 10 Units 3,000 2,000 4,000 9,000 8,000 units were on hand at the end of the month. Total Cost $ 45,000 60,000 $ 105,000 Dok Int ences Problem 8-5 (Static) Part 1 Required: 1. Calculate January's ending inventory and cost of goods sold for the month using FIFO, periodic system. FIFO Beginning Inventory Purchases: January 10 January 18 Total Cost of Goods Available for Sale Cost of Goods Available for Sale $ 48,000 Number Cost per of units unit 6,000 $8.00 5,000 $9.00 6,000 $10.00 17,000 45,000 60,000 $ 153,000 Cost of Goods Sold - Periodic FIFO Number of units sold Cost per unit $ $ $ 8.00 9.00 10.00 Cost of Goods Sold Ending Inventory - Periodic FIFO Number of units in ending inventory Cost per unit $ 8.00 $ 9.00 $ 10.00 Ending Inventory Problem 8-5 (Static) Part 2 2. Calculate January's ending inventory and cost of goods sold for the month using LIFO, periodic system. LIFO Beginning Inventory Purchases: January 10 January 18- Total Cost of Goods Available for Sale Cost of Goods Available for Sale 6,000 $8.00 S 48,000 Number Cost per of units unit 5,000 $9.00 6,000 $10.00 17,000 45,000 60,000 $ 153,000 Cost of Goods Sold - Periodic LIFO Number of units sold Cost per unit $ $ $ 8.00 9.00 10.00 Cost of Goods Sold Ending Inventory - Periodic LIFO Number of units in ending inventory Cost per unit $ 8.00 $ 9.00 $ 10.00 Ending Inventory I ces Problem 8-5 (Static) Part 3 3. Calculate January's ending inventory and cost of goods sold for the month using FIFO, perpetual system. Perpetual FIFO: Beginning Inventory Purchases: January 10 January 18 Total Cost of Goods Available for Sale Cost of Goods Available for Sale Unit Cost 6,000 $8.00 $ Number of units 5,000 9.00 6,000 10.00 17,000 48,000 45,000 60,000 $ 153,000 Cost of Goods Sold-January 5 Number of units sold Cost per unit $ 8.00 9.00 10.00 Cost of Goods Sold Cost of Goods Sold-January 12 Number of units sold Cost per unit $ 8.00 9,00 10.00 Cost of Goods Sold 0 0 Cost of Goods Sold-January 20 Number of units sold Cost per 5 8.00 9.00 10.00 Cost of Goods Sold O 1 ok mt 0 ences Problem 8-5 (Static) Part 4 4. Calculate January's ending inventory and cost of goods sold for the month using Average cost, periodic system. Cost of Goods Available for Sale Cost of Goods Sold - Average Cost Cost of Goods Average Cost per Unit Average Cost Beginning Inventory Purchases: January 10 January 18 Total Number Unit of units Cost Available for Sale 6,000 $8.00 $ 48,000 5,000 $9.00 6,000 $10.00 17,000 45,000 60,000 $ 153,000 Number of units sold Cost of Goods Sold Number of units in ending inventory Ending Inventory-Average Cost Average Cost per unit Ending Inventory S Problem 8-5 (Static) Part 5 5. Calculate January's ending inventory and cost of goods sold for the month using Average cost, perpetual system. Note: Round average cost per unit to 4 decimal places. Enter sales with a negative sign. Perpetual Average Beginning Inventory Sale - January 5 Subtotal Average Cost Purchase January 10 Subtotal Average Cost Sale - January 12 Subtotal Average Cost Purchase-January 18 Subtotal Average Cost Sale January 20 Total Inventory on hand Number Cost per of units unit Inventory Value Number of units sold Cost of Goods Sold Average Cost per unit Cost of Goods Sold
Expert Answer:
Answer rating: 100% (QA)
To calculate the ending inventory and cost of goods sold for the month of January using different inventory costing methods we can follow the given in... View the full answer

Related Book For 
Intermediate Accounting
ISBN: 978-1260481952
10th edition
Authors: J. David Spiceland, James Sepe, Mark Nelson, Wayne Thomas
Posted Date:
Students also viewed these accounting questions
-
Ferris Company began January with 6,000 units of its principal product. The cost of each unit is $8. Merchandise transactions for the month of January are as follows:
-
what is the diameter of the rivet if the length of the snap headrivet is 100 mm and the thickness is 50mm A. 43.64mm B.40.26mm C.53.76mm D.41.67mm
-
Managing Scope Changes Case Study Scope changes on a project can occur regardless of how well the project is planned or executed. Scope changes can be the result of something that was omitted during...
-
Read the case study of Ritz Carlton Company USA and discuss why and how you would transfer some of their methods to the operation of a non-accommodation component in an integrated resort complex.
-
Two air flows are combined to a single flow. Flow one is 1 m3/s at 20oC and the other is 2 m3/s at 200oC both at 100 kPa. They mix without any heat transfer to produce an exit flow at 100 kPa....
-
Show that in the BlackScholes-framework, the Esscher-transform of the Wiener-process W t is equivalent to the Girsanov-transformation.
-
The Nestl 2000 Annual Report included goodwill of 3,395 CHF million arising on the acquisition of various companies such as PowerBar Inc., the US leader in the emerging energy bar category, and 188...
-
Harris Company, which began operations in 2013, invests its idle cash in trading securities. The following transactions relate to its short- term investments in its trading securities. 2013 Mar. 10...
-
he information provided. 1. Parallel Line Construction: For this part of the assignment you will construct a parallel line through a given line and point. First, draw a segment (AB) and point C on...
-
Mary Janes Beauty Shop has recently invested money to add more equipment to enable more services to be offered at the shop. Given the following information evaluate their investment.
-
weighted the cost of all dividends paid none of the listed answers are correct the dividend paid to preferred shareholders the before-tax cost of debt plus the cost of equity, weighted for their...
-
Create a flow chart for the salary system with the following data given below. Sl. No. Name 1 2 Farhad Saikat Region Central Central Southern 72000 3 Shaguptha Shamim Southern 66000 4 5 6 7 8 Mahmuda...
-
Define plaintiff.2. Define defendant. 3. Define criminal law. 4. Define civil law .5. Define mala in se? 6. Define mala prohibita? 7. Name a federal and state administrative agency and describe its...
-
a) Critically discuss the role of state consent in the formation of rules of international law (7.5 marks) b) Treaties are superior to municipal laws.' With special reference to a Pacific Island...
-
Sam is a part-time doctoral candidate in media studies. To pay her university fees, Sam served a one-year internship with a newspaper in 2019. More recently, she has been working as a news editor at...
-
On April 14, Renter contacted Mountain Rentals Co. and an agent showed him 2 properties available for rent from June through August: the Summit House for $6,000 and the Cabin House for $3,000. On...
-
You are planning for a very early retirement. You would like to retire at age 40 and have enough money saved to be able to withdraw $225,000 per year for the next 30 years (based on family history,...
-
Data on weekday exercise time for 20 females, consistent with summary quantities given in the paper An Ecological Momentary Assessment of the Physical Activity and Sedentary Behaviour Patterns of...
-
At January 1, 2021, Brant Cargo acquired equipment by issuing a five-year, $150,000 (payable at maturity), 4% note. The market rate of interest for notes of similar risk is 10%. Required: 1. Prepare...
-
Data analytics is the process of examining data sets in order to draw conclusions about the information they contain. If you have not completed any of the prior data analytics cases, follow the...
-
The following relate to an operating lease agreement: a. The lease term is 3 years, beginning January 1, 2021. b. The leased asset cost the lessor $800,000 and had a useful life of eight years with...
-
Golden Foods (GF) Ltd makes pies, pastries and pizzas, which it sells to retailers under its own brand-name and also supplies to a major supermarket chain. It has two sites: the bakery and its head...
-
What is depreciation?
-
Outline the principal accounting and disclosure differences between IAS 16 and FRS 102, Section 17.1.

Study smarter with the SolutionInn App