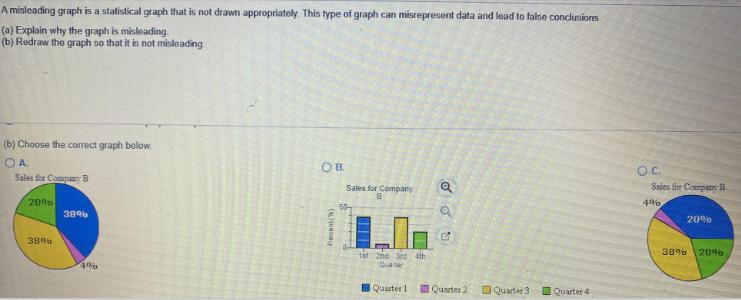
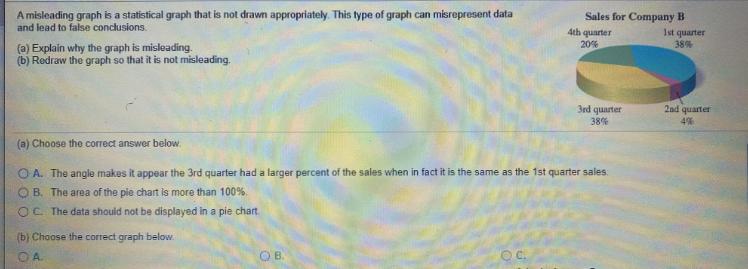
A misleading graph is a statistical graph that is not drawn appropriately. This type of graph...
Fantastic news! We've Found the answer you've been seeking!
Question:
Transcribed Image Text:
A misleading graph is a statistical graph that is not drawn appropriately. This type of graph can misrepresent data and lead to false conclusions (a) Explain why the graph is misleading. (b) Redraw the graph so that it is not misleading (b) Choose the correct graph below. OB. OC. O A. Sales for Company B Sales for Company B Sales for Company 3896 389 389o 209s 1st 2nd Sed sth Quasar IQuaster 1 Quarter 2 OQuarter 3 Quarter 4 A misleading graph is a statistical graph that is not drawn appropriately. This type of graph can misrepresent data and lead to false conclusions. (a) Explain why the graph is misloading. (b) Redraw the graph so that it is not misleading. Sales for Company B 1st quarter 38% 4th quarter 20% 3ed quarter 2ad quarter 38% 4% (a) Choose tho correct answer below O A. The angle makes it appear the 3rd quarter had a larger percent of the sales when in fact it is the same as the 1st quarter sales. O B. The area of the pie chart is more than 100%, C. The data shouid not be displayed in a pie chart (b) Choose the correct graph below. B. OA. OC. A misleading graph is a statistical graph that is not drawn appropriately. This type of graph can misrepresent data and lead to false conclusions (a) Explain why the graph is misleading. (b) Redraw the graph so that it is not misleading (b) Choose the correct graph below. OB. OC. O A. Sales for Company B Sales for Company B Sales for Company 3896 389 389o 209s 1st 2nd Sed sth Quasar IQuaster 1 Quarter 2 OQuarter 3 Quarter 4 A misleading graph is a statistical graph that is not drawn appropriately. This type of graph can misrepresent data and lead to false conclusions. (a) Explain why the graph is misloading. (b) Redraw the graph so that it is not misleading. Sales for Company B 1st quarter 38% 4th quarter 20% 3ed quarter 2ad quarter 38% 4% (a) Choose tho correct answer below O A. The angle makes it appear the 3rd quarter had a larger percent of the sales when in fact it is the same as the 1st quarter sales. O B. The area of the pie chart is more than 100%, C. The data shouid not be displayed in a pie chart (b) Choose the correct graph below. B. OA. OC.
Expert Answer:
Related Book For
Elementary Statistics Picturing the World
ISBN: 978-0321911216
6th edition
Authors: Ron Larson, Betsy Farber
Posted Date:
Students also viewed these mathematics questions
-
A misleading graph is a statistical graph that is not drawn appropriately. This type of graph can misrepresent data and lead to false conclusions. In Exercises 37, (a) Explain why the graph is...
-
A misleading graph is a statistical graph that is not drawn appropriately. This type of graph can misrepresent data and lead to false conclusions. In Exercises 38, (a) Explain why the graph is...
-
A misleading graph is a statistical graph that is not drawn appropriately. This type of graph can misrepresent data and lead to false conclusions. In Exercises 39, (a) Explain why the graph is...
-
Assume that a company is going to invest 900,000 USD in a new project. We expect that the invested capital in the fixed assets will be fully depreciated within 3 years as follows: 500,000 USD,...
-
Is acrimony between a debtor in possession (DIP) and certain creditors sufficient cause to justify appointment of a trustee?
-
Read the following passage and choose the appropriate terms to complete the sentences. Shareholders want managers to maximize the expected return invest its cash in (Click to select) (Click to...
-
Gardner identified several attributes of leaders as: A. Including physical vitality and stamina. B. Intelligence and good judgment. C. Understanding followers needs. D. All of the above.
-
The Big Black Bird Company (BBBC) has a large order for special plastic-lined military uniforms to be used in an urgent military operation. Working the normal two shifts of 40 hours each per week,...
-
short answer: What is focus strategy? list some guidelines for when focus strategy would be especially effective to pursue.
-
Use Microsoft Visio or Visible Analyst to view and print the contextlevel data flow diagram for the computer inventory system as Chip and Anna did E2 Use the Repository feature or the Repository web...
-
Required:Part A - ?Consolidation Question On 0 1 0 7 / 2 0 2 1 , ?S forzando Ltd acquired 1 0 0 % ?of the issued shares of Fortepiano Ltd for: At the date of acquisition, the Owners' Equity of...
-
he formula for carbon tetrachloride is CCL. a. How many grams of carbon are present in 4.94 moles of carbon tetrachloride? grams b. How many moles of chlorine are present in 1.26 grams of carbon...
-
What is the maximum number of electrons in aluminum (Al) thatcan have a spin quantum number with a value of m(s)=1/2? Assume aluminum is in its ground state.
-
Crane Manufacturing Co.'s static budget at 14,400 units of production includes $92,160 for direct labor and $20,160 for direct materials. Total fixed costs are $50,400. Determine the total costs on...
-
If you invest $5,000 at the end of every year for ten years at an interest rate of 6%, the balance of your investment in 5 years will be closest to
-
Use below information for Questions 7 to 10: Jane Botosan operates a bed and breakfast hotel in a resort area near Lake Michigan. Depreciation on the hotel is $60,000 per year. Jane employs a...
-
The Week 3 Discussion consists of two topic. (1.) What are the differences between cash and accrual basis accounting? Provide an example of each. (2.) Accrual accounting requires adjusting entries....
-
Complete problem P10-21 using ASPE. Data from P10-21 Original cost ................................................................. $7,000,000 Accumulated depreciation...
-
At = 0.05, can you support the claim that the proportion of women ages 18 to 24 living in their parents homes was greater in 2012 than in 2000? Use the figure below, which shows the percentages of...
-
You look over the songs on a jukebox and determine that you like 15 of the 56 songs. (a) What is the probability that you like the next three songs that are played? (Assume a song cannot be...
-
About 30% of U.S. adults are trying to lose weight. You randomly select eight U.S. adults. Find the probability that the number of U.S. adults who say they are trying to lose weight is (a) Exactly...
-
Lathrop Co. makes a variety of products from a joint process. The joint cost per batch run is \(\$ 55,000\) and each batch produces the following products: How would you classify each product (joint,...
-
Oliver Inc. makes three types of olive oil that can be sold at split-off or processed further and then sold. The joint cost for October is \(\$ 325,000\). The number of ounces in a bottle of each...
-
Potato skins are generated as a by-product in making potato chips and frozen hash browns at Fit Food. The skins are sold to restaurants for use in appetizers. Processing and disposal costs associated...
Study smarter with the SolutionInn App