

Start off with a brief introduction describing the main concepts of the lab including both invasive...
Fantastic news! We've Found the answer you've been seeking!
Question:
Transcribed Image Text:
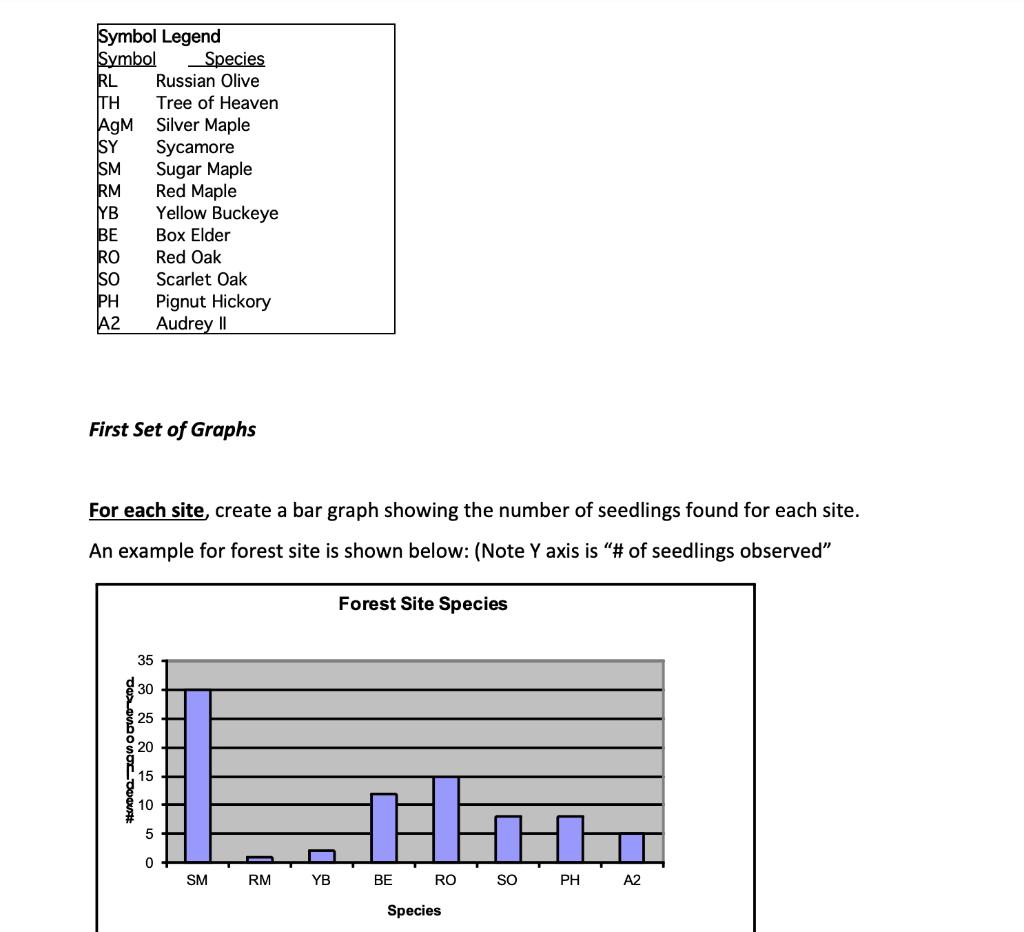
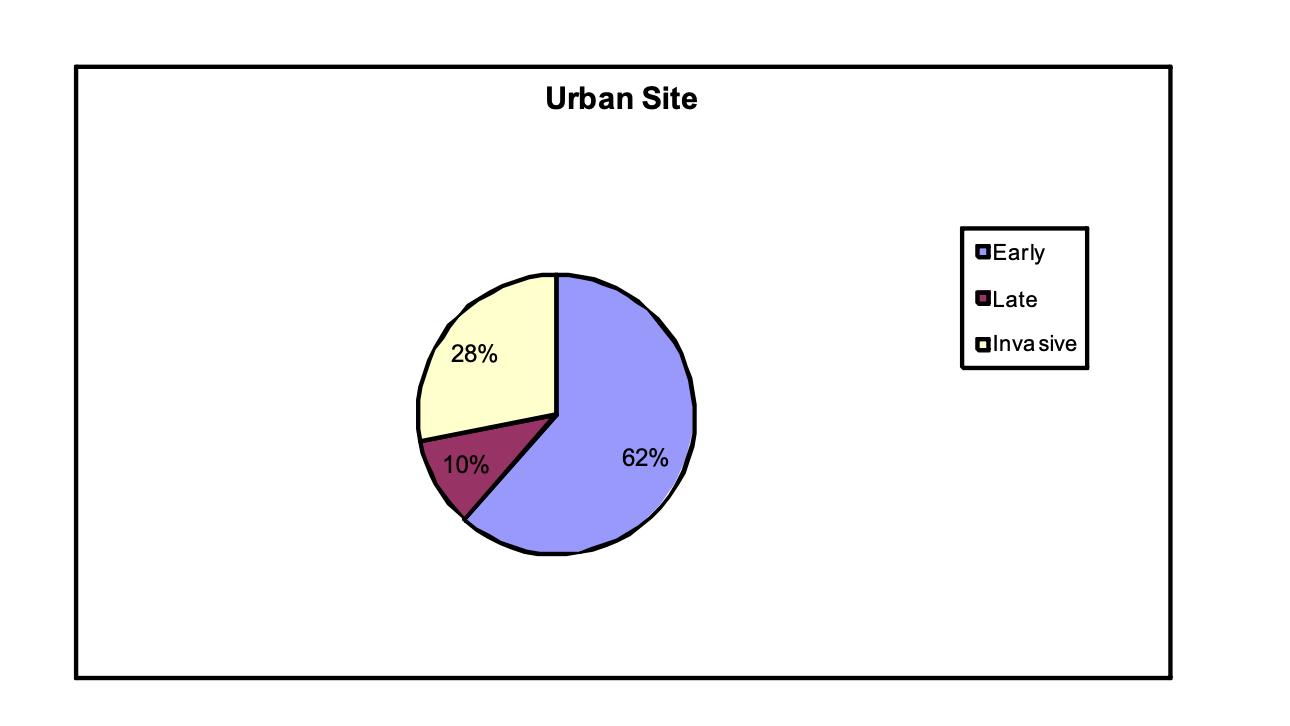
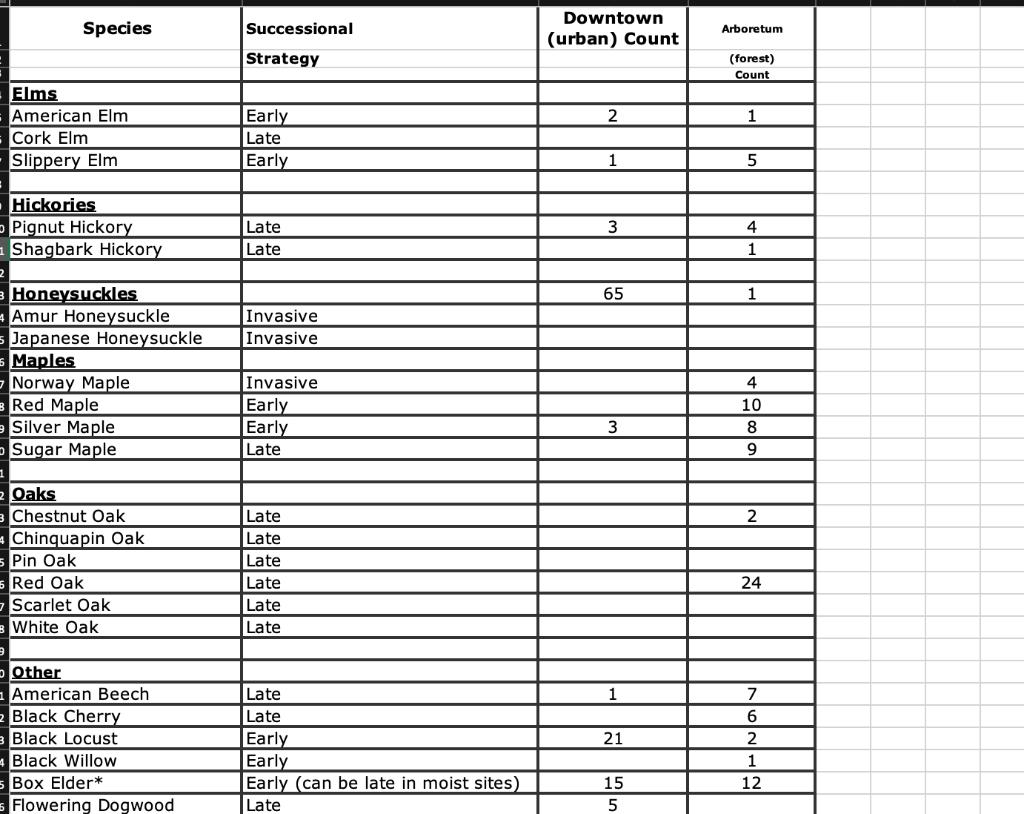
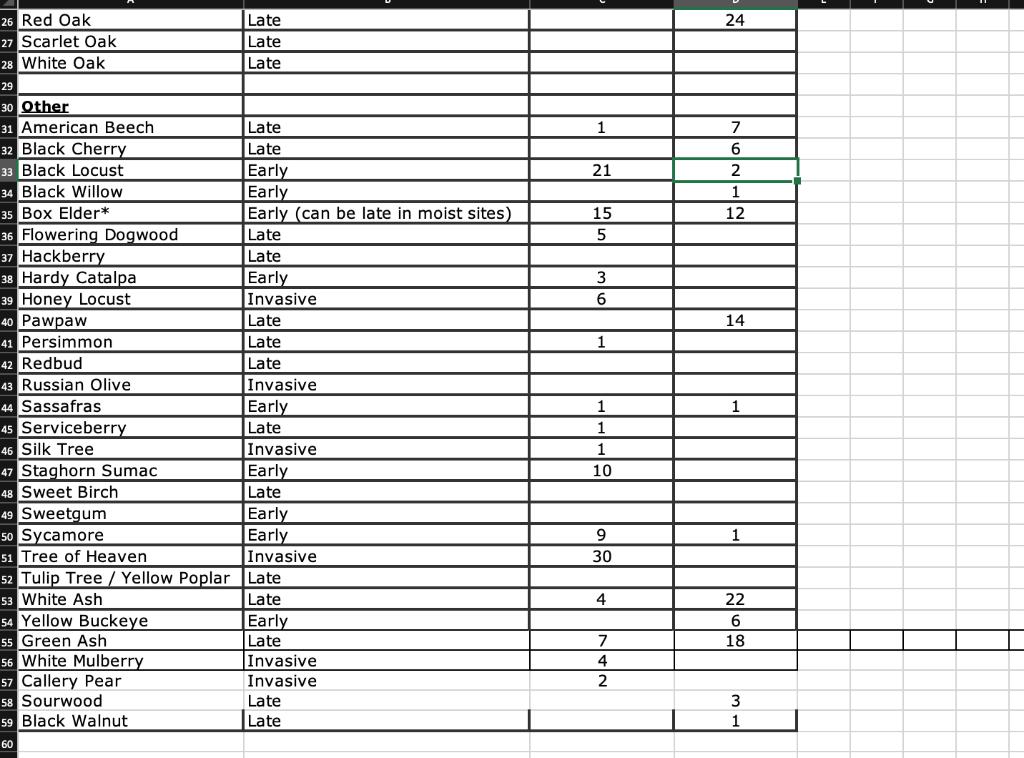
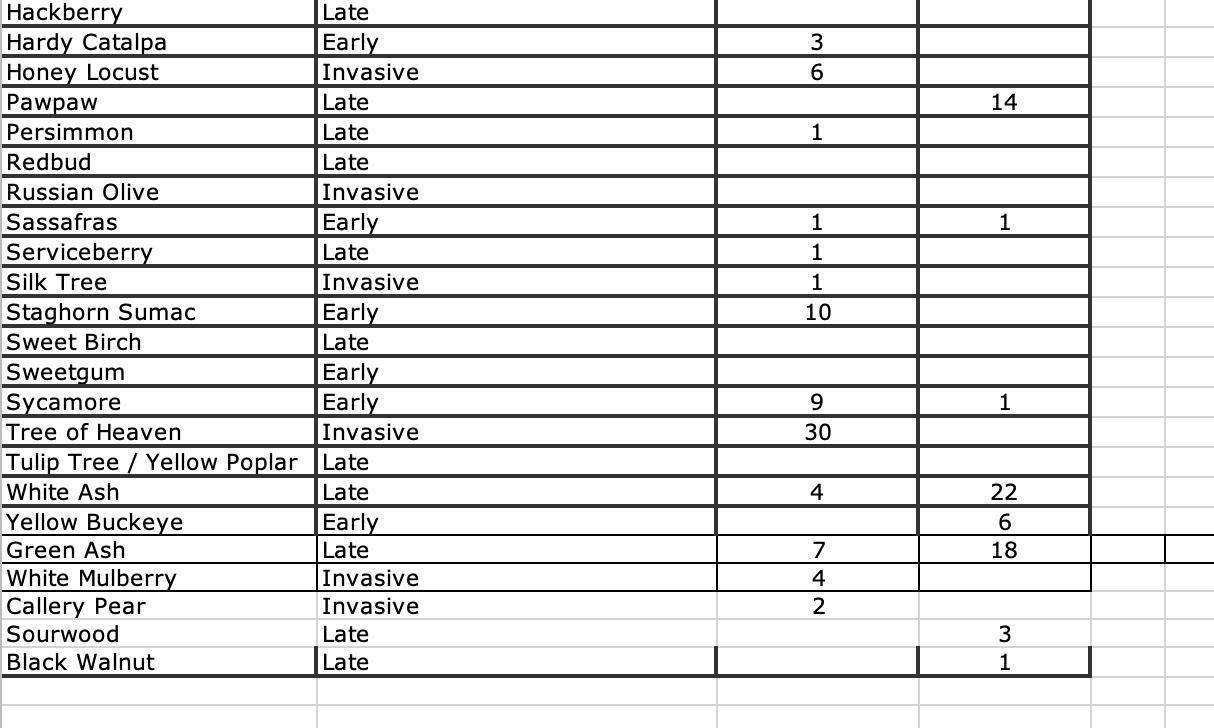
Start off with a brief introduction describing the main concepts of the lab including both invasive species information and successional types and urban ecology. After that, answer the following questions: Are the same seedling species dominant in each site? Which species dominate in each site? Which site has more species? Which site has more invasive species? Early successional species? Late successional species? Why would species differ between these locations? (This is the most important question!) This section should be in paragraph format-do not use a bulleted or question-by-question format. The pooled data are to be used for this section as well as the graphs. GRAPHS (2 Bar Graphs and 2 Pie Graphs) You are to create two sets of graphs, which are described below. For this lab report, your graphs may be either hand-drawn or computer-generated. When labeling species, you may use either full names or abbreviations. Symbols or abbreviations often make graphs look neater and nicer, but they are not required. If you choose to use symbols or abbreviations, you must include a symbol legend. An example of a symbol legend that corresponds to the example graphs is shown below. Symbol Legend Symbol Species RL Russian Olive ΤΗ AgM SY SM RM YB BE RO SO PH A2 35 TENDONO downst First Set of Graphs 30 For each site, create a bar graph showing the number of seedlings found for each site. An example for forest site is shown below: (Note Y axis is "# of seedlings observed" Forest Site Species 25 20 15 10 Tree of Heaven Silver Maple 5 Sycamore Sugar Maple Red Maple Yellow Buckeye 0 Box Elder Red Oak Scarlet Oak Pignut Hickory Audrey II SM RM YB BE RO Species SO PH A2 Second Set of Graphs In this set of graphs, create two pie charts showing the differences in the total number of seedlings present in early, late, and invasive species between the two sites. Do not graph the number of late, early, and invasive species individually. For example, let's say there were 24 Tree of Heaven and 3 Russian Olive seedlings recorded at the urban site and no other invasive species were found. Since both Tree of Heaven and Russian Olive are invasive species, the total number of invasive seedlings is 27 (24+3). In each pie chart, also include labels showing the percent of the total number of seedlings. An example of the pie chart graph for the urban site is shown below: 28% 10% Urban Site 62% □Early Late Inva sive Species Elms American Elm Cork Elm Slippery Elm Hickories Pignut Hickory Shagbark Hickory Honeysuckles Amur Honeysuckle Japanese Honeysuckle Maples Norway Maple Red Maple Silver Maple Sugar Maple Oaks Chestnut Oak Chinquapin Oak Pin Oak Red Oak Scarlet Oak White Oak Other American Beech Black Cherry Black Locust Black Willow Box Elder* Flowering Dogwood Successional Strategy Early Late Early Late Late Invasive Invasive Invasive Early Early Late Late Late Late Late Late Late Late Late Early Early Early (can be late in moist sites) Late Downtown (urban) Count 2 3 65 3 1 21 15 5 Arboretum (forest) Count 1 5 4 1 1 4 10 8 9 2 24 7 6 2 1 12 26 Red Oak 27 Scarlet Oak 28 White Oak 29 30 Other 31 American Beech 32 Black Cherry 33 Black Locust 34 Black Willow 35 Box Elder* 36 Flowering Dogwood 37 Hackberry 38 Hardy Catalpa 39 Honey Locust 40 Pawpaw 41 Persimmon 42 Redbud 43 Russian Olive 44 Sassafras 45 Serviceberry 46 Silk Tree 47 Staghorn Sumac 48 Sweet Birch 49 Sweetgum 50 Sycamore 51 Tree of Heaven 54 Yellow Buckeye 55 Green Ash Late Late Late 56 White Mulberry 57 Callery Pear 58 Sourwood 59 Black Walnut 60 Late Late Early Early Early (can be late in moist sites) Late Late Early Invasive Late Late Late Invasive Early Late Invasive Early Late 52 Tulip Tree/ Yellow Poplar Late 53 White Ash Late Early Early Invasive Early Late Invasive Invasive Late Late 1 21 15 BALET 10 30 4 7 4 2 24 7 6 2 1 12 14 1 1 22 6 18 3 1 Hackberry Hardy Catalpa Honey Locust Pawpaw Persimmon Redbud Russian Olive Sassafras Serviceberry Silk Tree Staghorn Sumac Sweet Birch Sweetgum Sycamore Late Early Invasive Yellow Buckeye Green Ash White Mulberry Callery Pear Sourwood Black Walnut Late Late Late Invasive Early Late Invasive Early Late Early Early Invasive Tree of Heaven Tulip Tree / Yellow Poplar Late White Ash Late Early Late Invasive Invasive Late Late 3 6 1 1 1 1 10 9 30 4 7 4 2 14 1 1 22 6 18 3 1 Start off with a brief introduction describing the main concepts of the lab including both invasive species information and successional types and urban ecology. After that, answer the following questions: Are the same seedling species dominant in each site? Which species dominate in each site? Which site has more species? Which site has more invasive species? Early successional species? Late successional species? Why would species differ between these locations? (This is the most important question!) This section should be in paragraph format-do not use a bulleted or question-by-question format. The pooled data are to be used for this section as well as the graphs. GRAPHS (2 Bar Graphs and 2 Pie Graphs) You are to create two sets of graphs, which are described below. For this lab report, your graphs may be either hand-drawn or computer-generated. When labeling species, you may use either full names or abbreviations. Symbols or abbreviations often make graphs look neater and nicer, but they are not required. If you choose to use symbols or abbreviations, you must include a symbol legend. An example of a symbol legend that corresponds to the example graphs is shown below. Symbol Legend Symbol Species RL Russian Olive ΤΗ AgM SY SM RM YB BE RO SO PH A2 35 TENDONO downst First Set of Graphs 30 For each site, create a bar graph showing the number of seedlings found for each site. An example for forest site is shown below: (Note Y axis is "# of seedlings observed" Forest Site Species 25 20 15 10 Tree of Heaven Silver Maple 5 Sycamore Sugar Maple Red Maple Yellow Buckeye 0 Box Elder Red Oak Scarlet Oak Pignut Hickory Audrey II SM RM YB BE RO Species SO PH A2 Second Set of Graphs In this set of graphs, create two pie charts showing the differences in the total number of seedlings present in early, late, and invasive species between the two sites. Do not graph the number of late, early, and invasive species individually. For example, let's say there were 24 Tree of Heaven and 3 Russian Olive seedlings recorded at the urban site and no other invasive species were found. Since both Tree of Heaven and Russian Olive are invasive species, the total number of invasive seedlings is 27 (24+3). In each pie chart, also include labels showing the percent of the total number of seedlings. An example of the pie chart graph for the urban site is shown below: 28% 10% Urban Site 62% □Early Late Inva sive Species Elms American Elm Cork Elm Slippery Elm Hickories Pignut Hickory Shagbark Hickory Honeysuckles Amur Honeysuckle Japanese Honeysuckle Maples Norway Maple Red Maple Silver Maple Sugar Maple Oaks Chestnut Oak Chinquapin Oak Pin Oak Red Oak Scarlet Oak White Oak Other American Beech Black Cherry Black Locust Black Willow Box Elder* Flowering Dogwood Successional Strategy Early Late Early Late Late Invasive Invasive Invasive Early Early Late Late Late Late Late Late Late Late Late Early Early Early (can be late in moist sites) Late Downtown (urban) Count 2 3 65 3 1 21 15 5 Arboretum (forest) Count 1 5 4 1 1 4 10 8 9 2 24 7 6 2 1 12 26 Red Oak 27 Scarlet Oak 28 White Oak 29 30 Other 31 American Beech 32 Black Cherry 33 Black Locust 34 Black Willow 35 Box Elder* 36 Flowering Dogwood 37 Hackberry 38 Hardy Catalpa 39 Honey Locust 40 Pawpaw 41 Persimmon 42 Redbud 43 Russian Olive 44 Sassafras 45 Serviceberry 46 Silk Tree 47 Staghorn Sumac 48 Sweet Birch 49 Sweetgum 50 Sycamore 51 Tree of Heaven 54 Yellow Buckeye 55 Green Ash Late Late Late 56 White Mulberry 57 Callery Pear 58 Sourwood 59 Black Walnut 60 Late Late Early Early Early (can be late in moist sites) Late Late Early Invasive Late Late Late Invasive Early Late Invasive Early Late 52 Tulip Tree/ Yellow Poplar Late 53 White Ash Late Early Early Invasive Early Late Invasive Invasive Late Late 1 21 15 BALET 10 30 4 7 4 2 24 7 6 2 1 12 14 1 1 22 6 18 3 1 Hackberry Hardy Catalpa Honey Locust Pawpaw Persimmon Redbud Russian Olive Sassafras Serviceberry Silk Tree Staghorn Sumac Sweet Birch Sweetgum Sycamore Late Early Invasive Yellow Buckeye Green Ash White Mulberry Callery Pear Sourwood Black Walnut Late Late Late Invasive Early Late Invasive Early Late Early Early Invasive Tree of Heaven Tulip Tree / Yellow Poplar Late White Ash Late Early Late Invasive Invasive Late Late 3 6 1 1 1 1 10 9 30 4 7 4 2 14 1 1 22 6 18 3 1
Expert Answer:
Answer rating: 100% (QA)
No sugar maple is the dominant seeding as its number is more than other seedings Honeysuckles and m... View the full answer

Related Book For 

Statistics for the Life Sciences
ISBN: 978-0321989581
5th edition
Authors: Myra Samuels, Jeffrey Witmer, Andrew Schaffner
Posted Date:
Students also viewed these accounting questions
-
Given the following information, prepare a statement of cash flows. Increase in accounts receivable $35 Increase in inventories 40 Operating income 95 Interest expense 35 Increase in accounts payable...
-
Consider a market in a small country with a domestic demand curve of P = 28-q and a domestic supply curve of P = 3q. The world price is $15 per unit. If the country opens itself up to international...
-
Determine CPI, ETC (1), and EAC. Activity Total PV 1 2 3 4 5 6 7 8 9 10 11 12 13 14 1 6 6 2 20 10 10 3 30 9 6 6 6 3 4 20 8 2 5 5 5 16 4 4 4 4 6 18 9 9 7 8 4 4 Status Report: Ending Period 5 Task %...
-
Determine the breakeven point for each plant. Hambry Enterprises produces a component for recycling uranium used as a nuclear fuel in power plant generators in France and the United States. Use the...
-
Define e-marketing strategy and explain how it is used.
-
What is the value of keeping the record of business transactions in chronological order?
-
Disney is considering entering into a joint venture to build condominiums in Vail, Colorado, with a local real estate developer. The development is expected to cost \($1\) billion overall and, based...
-
Carol Cagle has a repetitive manufacturing plant producing trailer hitches in Arlington, Texas. The plant has an average inventory turnover of only 12 times per year. She has therefore deter-mined...
-
?Given that a? firm's return on equity is 16 percent andmanagement plans to retain 42 percent of earnings for investment?purposes, what will be the? firm's growth? rate? If the firmdecide 2 answers
-
Liquid extraction is an operation used to separate the components of a liquid mixture of two or more species. In the simplest case, the mixture contains two components: a solute (A) and a Liquid...
-
Provide a proposal on how can BlueStar company can utilize cost effective TL transportation to build an Analytics strategy that is more sustainable (for example - what would the future steps be to...
-
Alice asks her friend Brian, an expert on used cars, to locate and purchase another used minivan that will meet her needs. Brian agrees to locate and secure a minivan for Alice. Alice tells Brian...
-
Gremlin Industries will pay a dividend of $1.65 per share this year. It is expected that this dividend will grow by 6% per year each year in the future. The current price of Gremlin's stock is $23.30...
-
The Abraham Company produces three products - product A, Product B and Product C. Product A and B are the joint products. Product C has a relatively small market value and is therefore treated as a...
-
The Clairemont Cookie Company has developed an automatic cookie making machine, the Clairemont3000, which automatically mixes the batter, forms the dough into a variety of shapes, and then bake them...
-
Unit 2 HW6 Score: 7.5/15 7/15 answered Question 7 < > Write the set {x | x-2} using interval notation Question Help: Message instructor Calculator Submit Question
-
Rachel runs her own hot dog stand on the U of A campus. The monthly cost of the cart rental and business permit is $300. Rachel's contribution margin is $1.50 per hot dog sold. She has recently added...
-
Consider the circuit of Fig. 7.97. Find v0 (t) if i(0) = 2 A and v(t) = 0. 1 3 ett)
-
Consider the setting of Exercise 7.4.2. (a) What is the explanatory variable? (b) What is the response variable? (c) What are the observational units? Exercise 7.4.2 It has been hypothesized that...
-
Consider the hummingbird data and information provided in Exercise IV. 10. (a) Find the equation of the fitted regression line. (b) Predict the wingbeat frequency for a hummingbird with 30 mm wings....
-
(a) A conservationist recorded the weather (clear, partly cloudy, cloudy, rainy) and number of cars parked at noon at a trailhead on each of 18 days. (b) An enologist measured the pH and residual...
-
Explain why and how bond discount and bond premium affect (a) the balance sheet and (b) the income statement of the investor.
-
What are convertible bonds? What are the primary reasons for their use?
-
Under GAAP, when is it appropriate to use the (a) straight-line interest method and (b) effective interest method of amortization for bond discount or premium?

Study smarter with the SolutionInn App