

All You X ps X Dee X NYU X Not | ps x ps2 x ps_...
Fantastic news! We've Found the answer you've been seeking!
Question:
Transcribed Image Text:
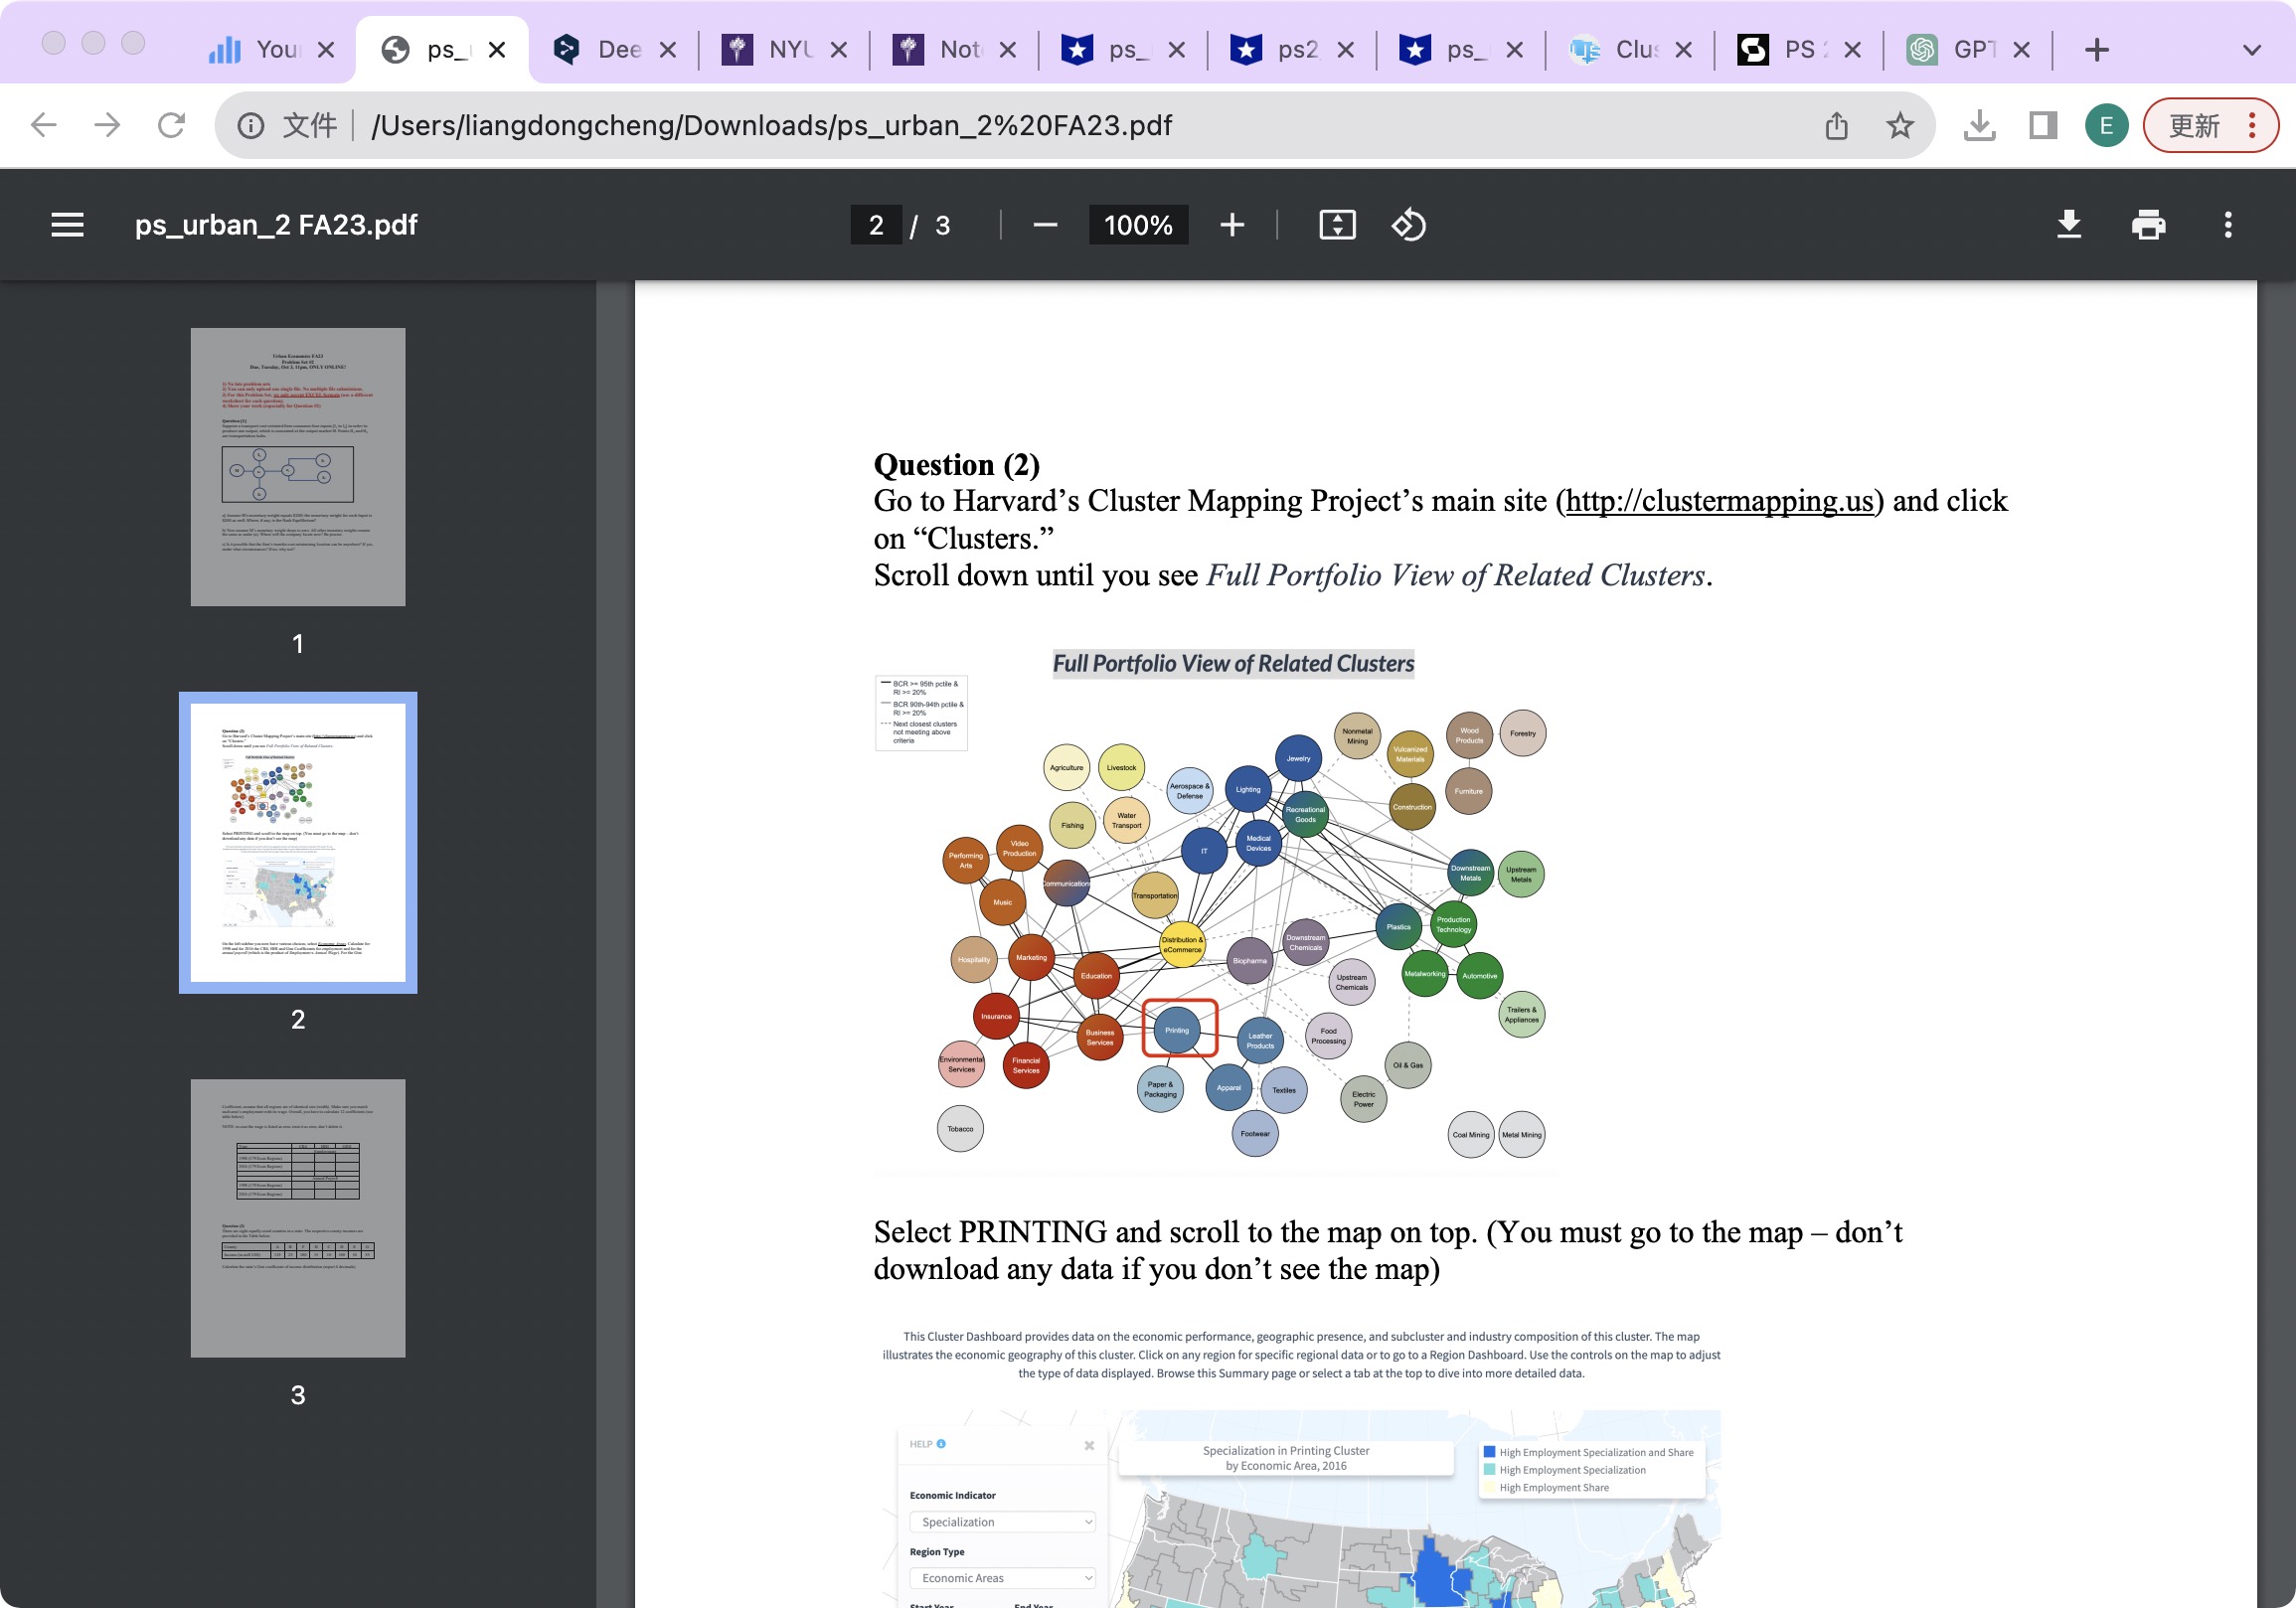
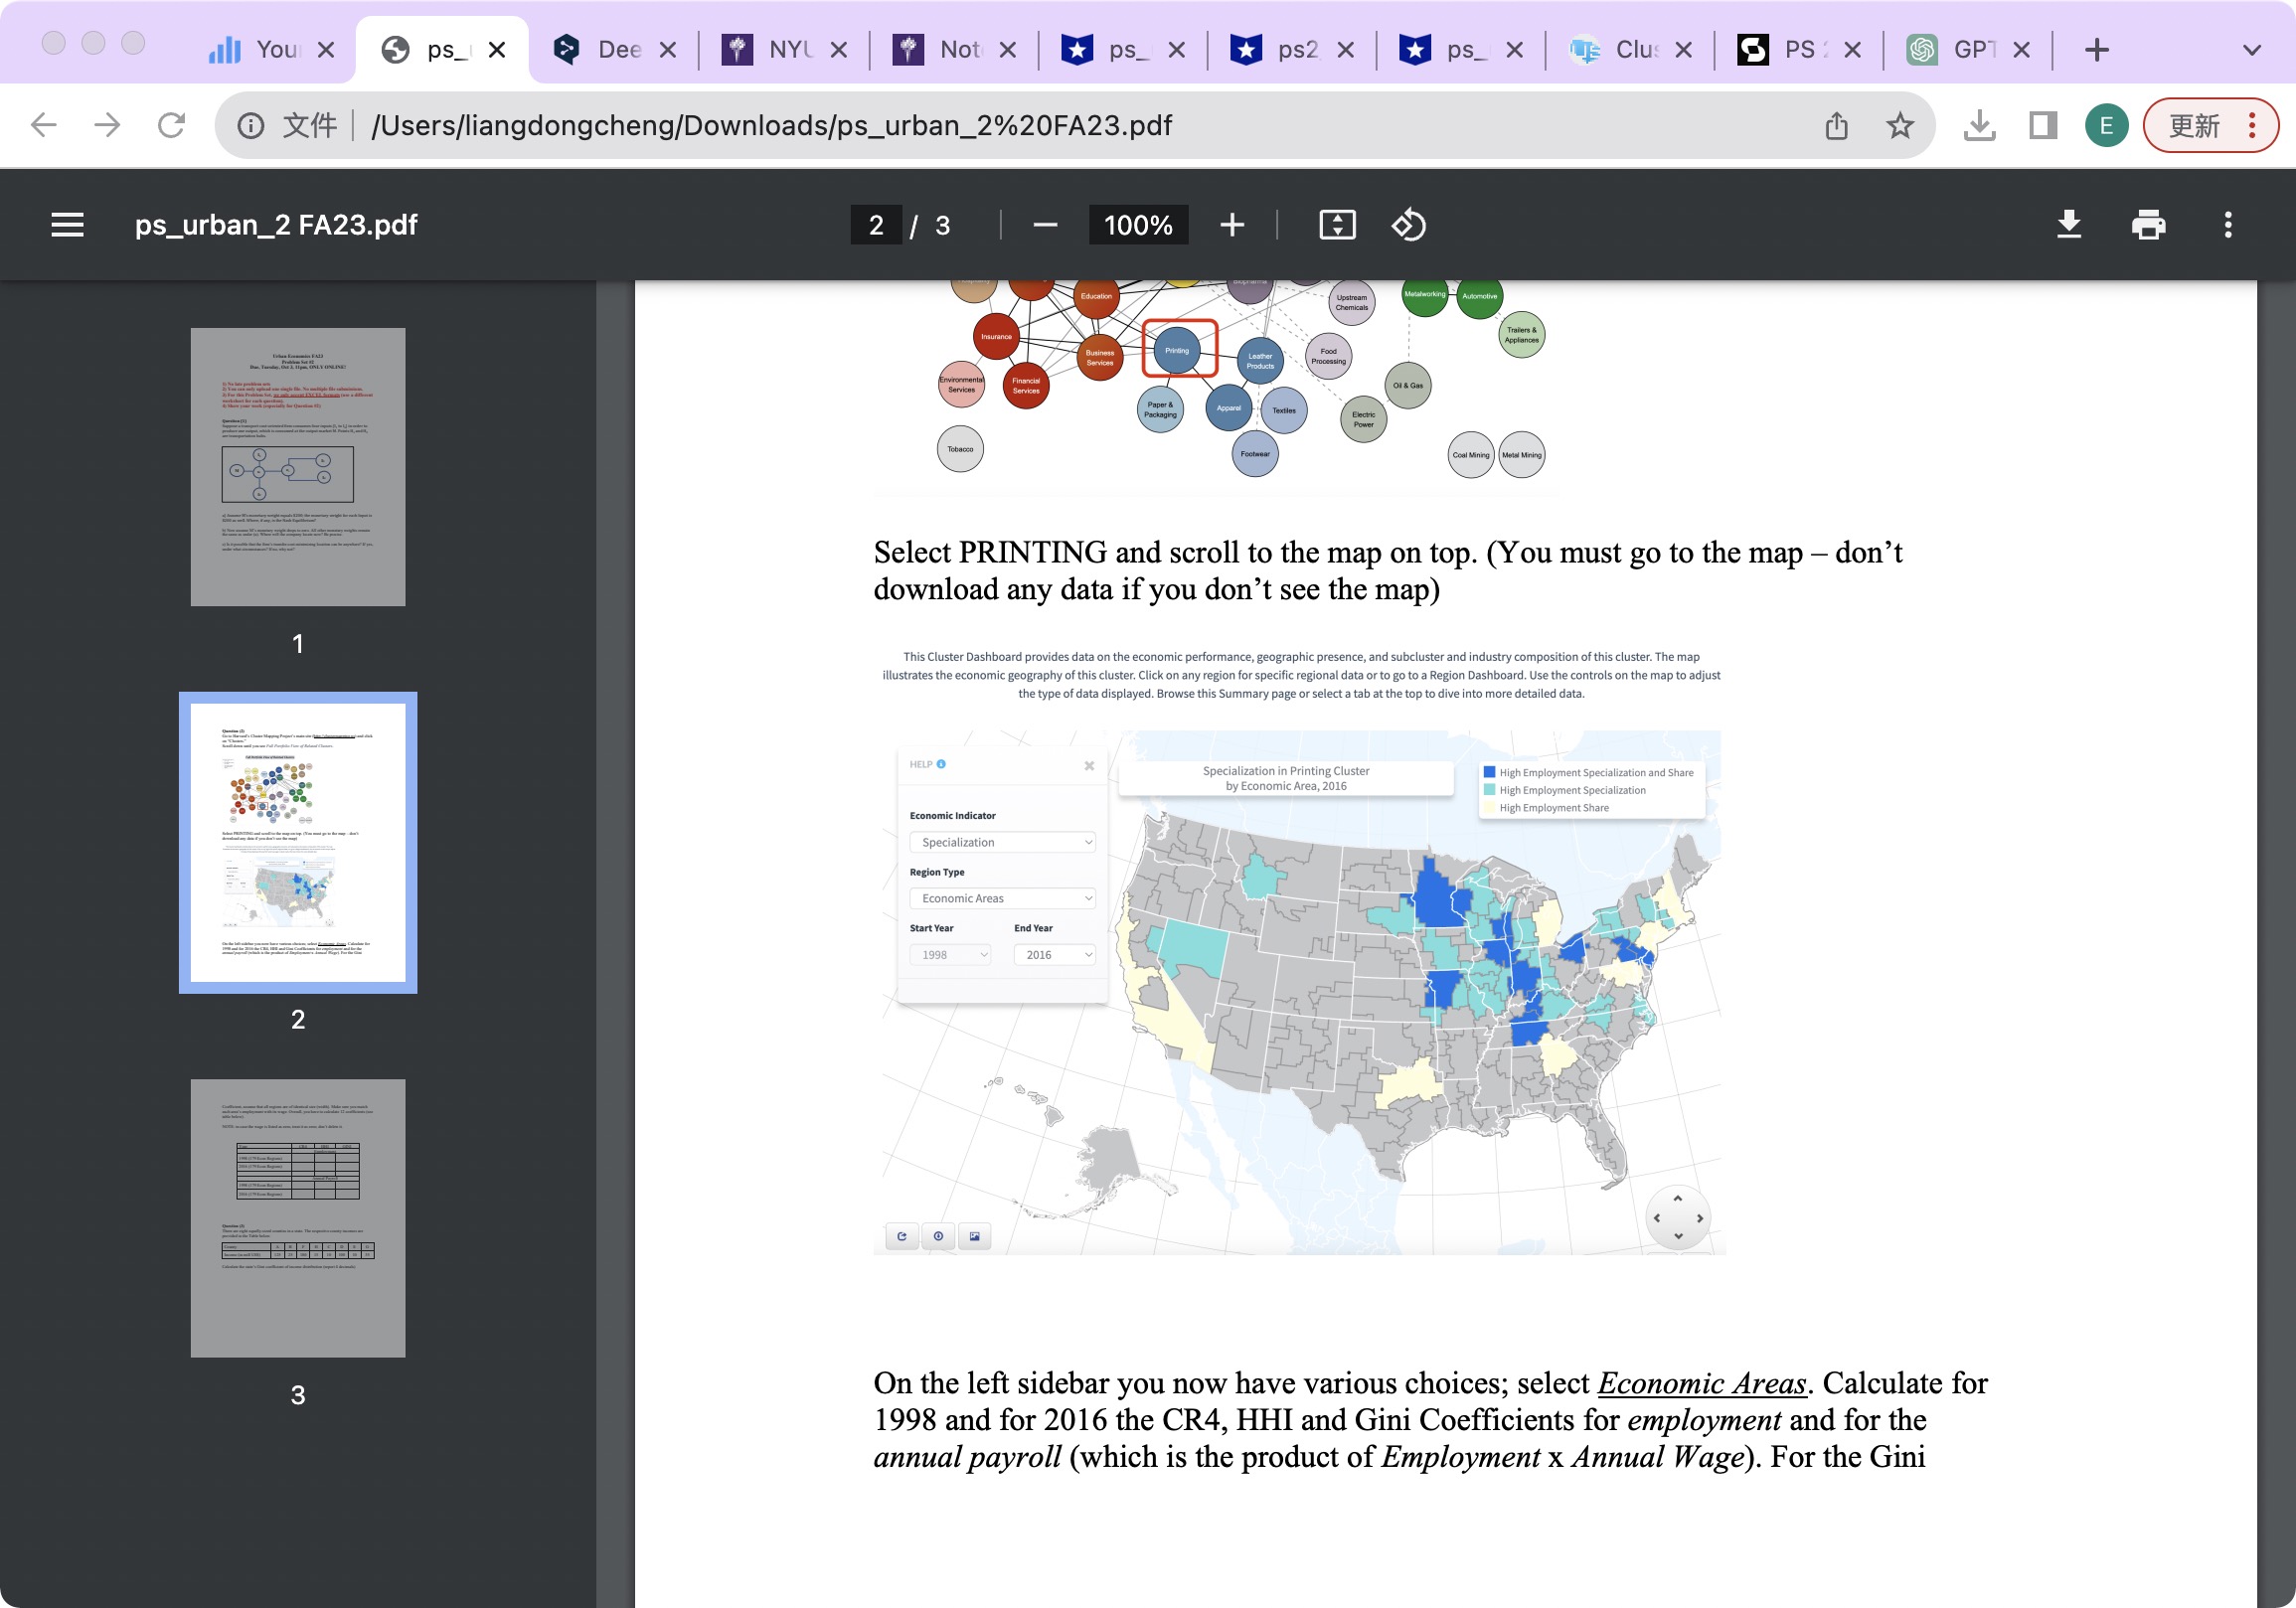
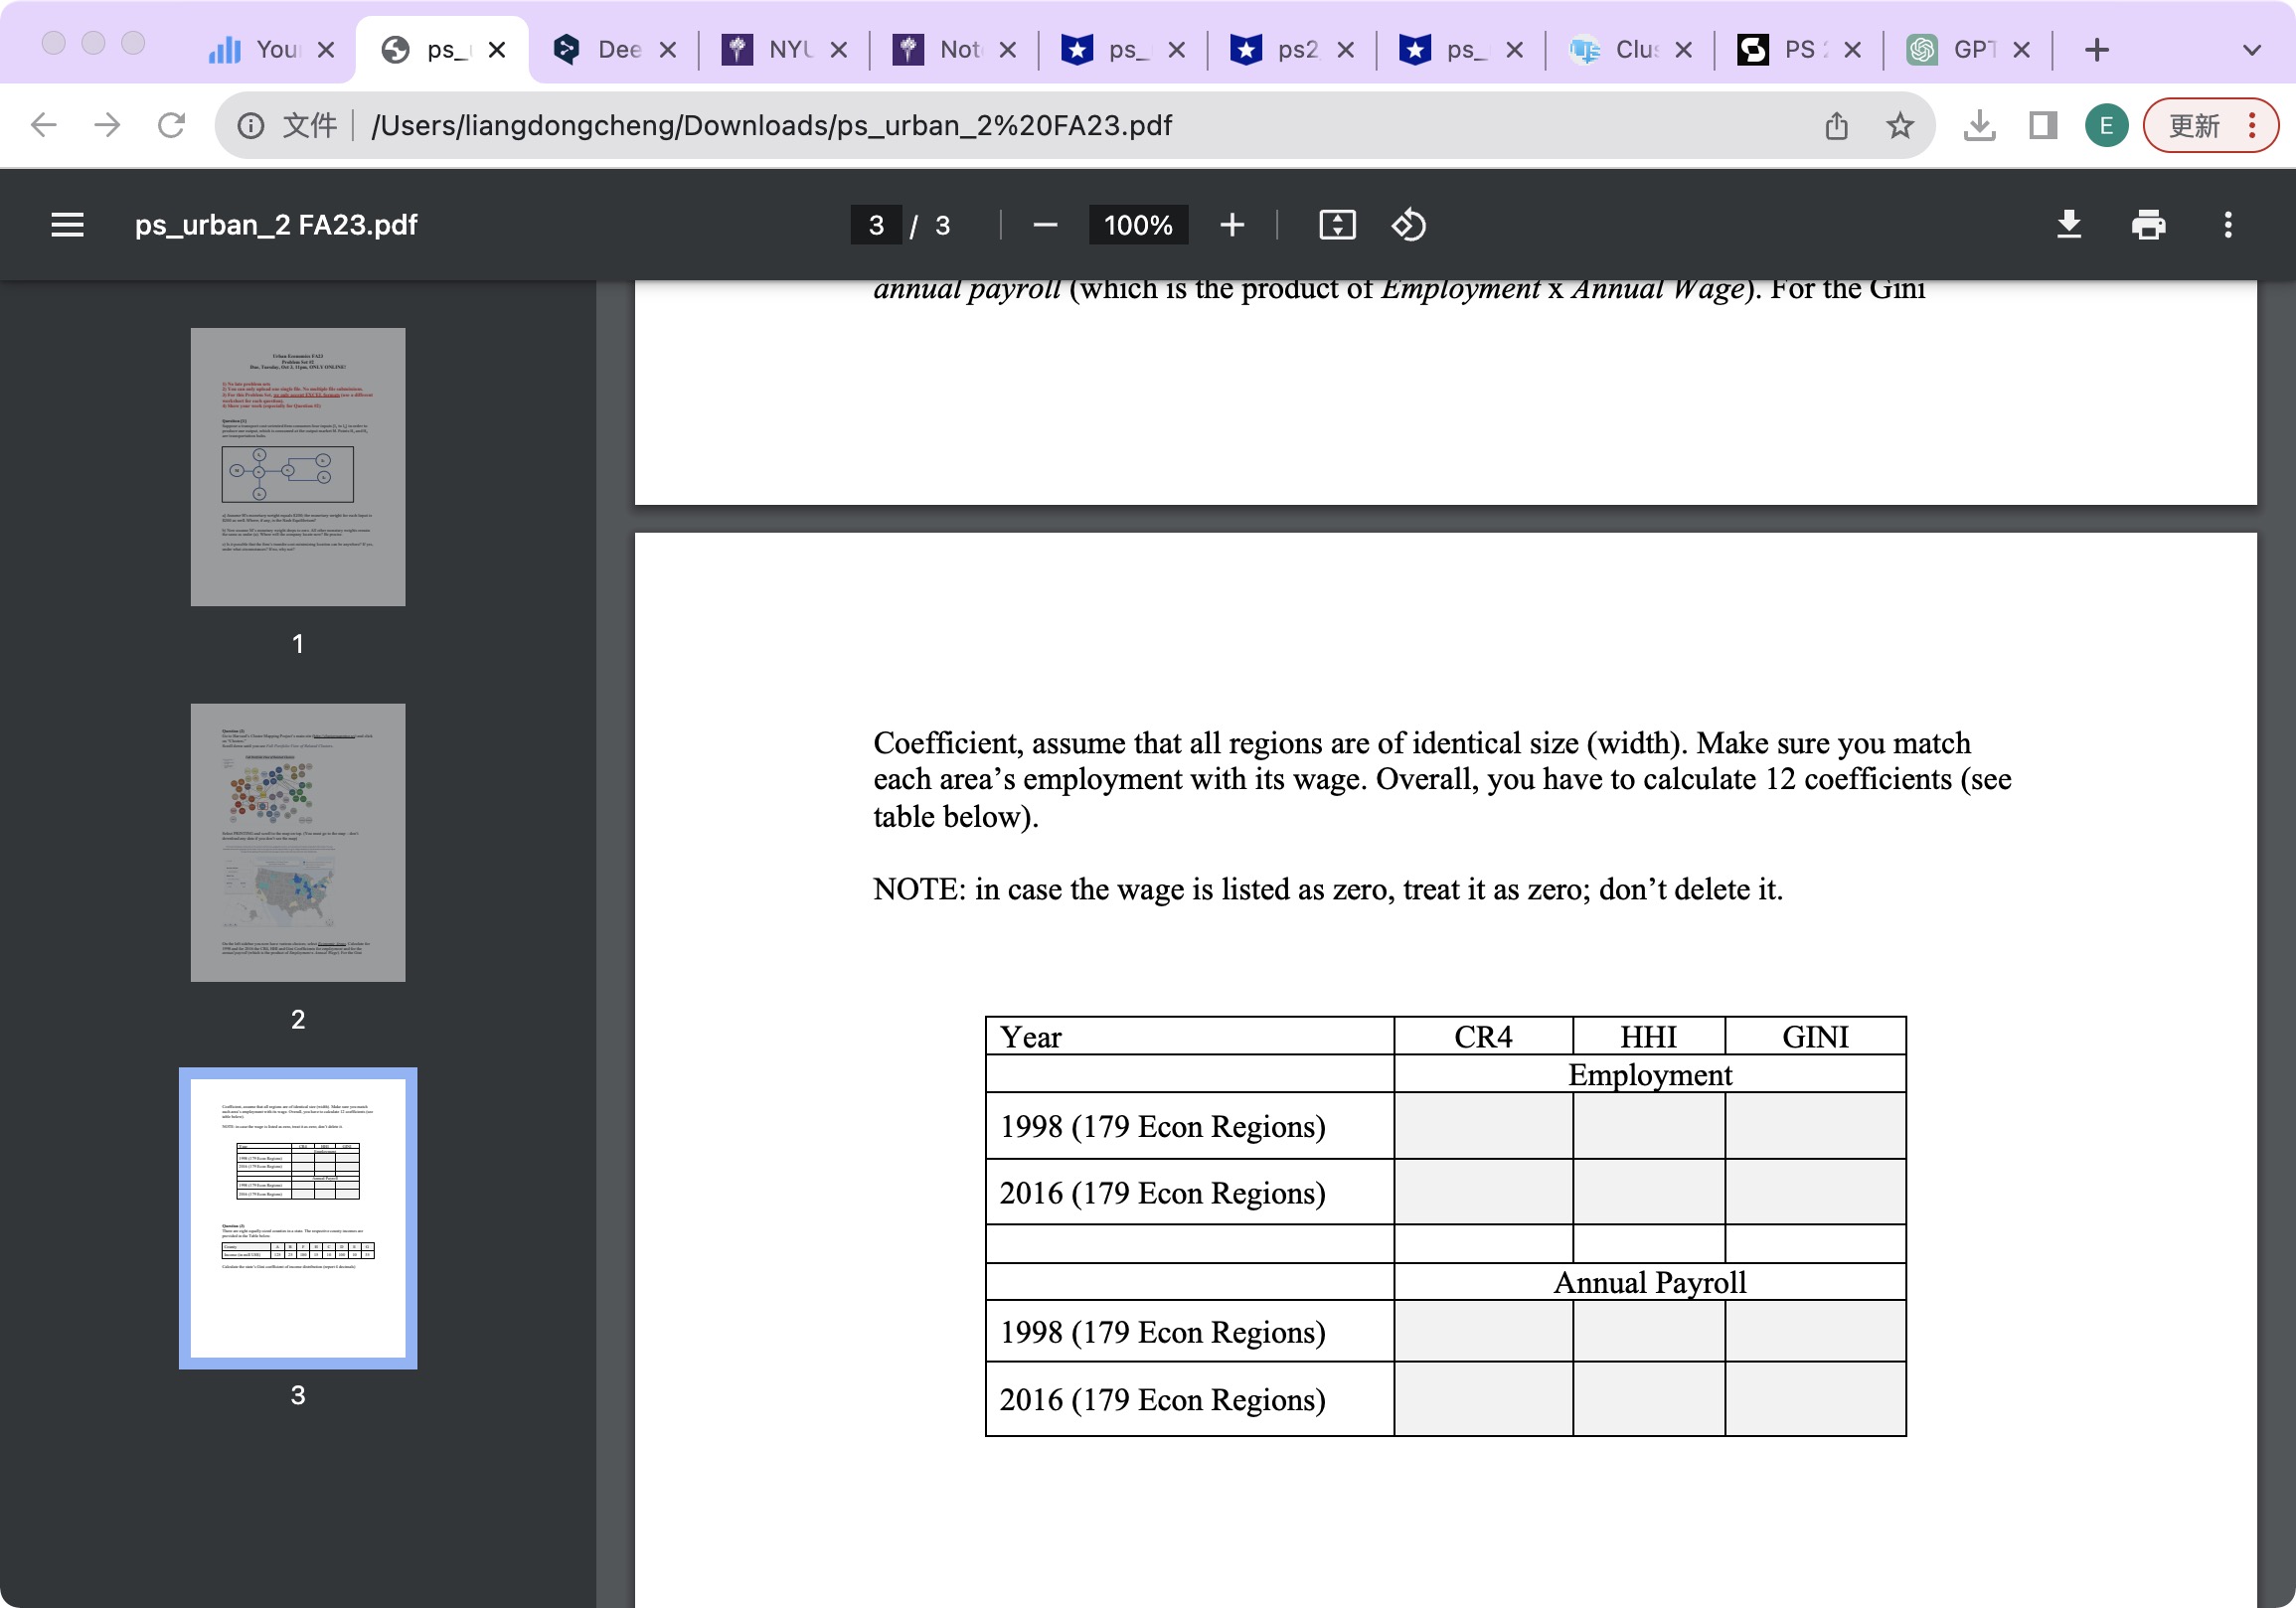
All You X ps X Dee X NYU X Not | ps x ps2 x ps_ Clus C X/Users/liangdongcheng/Downloads/ps_urban_2%20FA23.pdf ps_urban_2 FA23.pdf FA33 For this Pro St, EXCEL O O *** 1 2 / 3 - 100% + 0 PS X GPT X + Question (2) Go to Harvard's Cluster Mapping Project's main site (http://clustermapping.us) and click on "Clusters." Scroll down until you see Full Portfolio View of Related Clusters. BCR-95th pctile & BCR 90th-94th petle & Next closest clusters not meet criteria Full Portfolio View of Related Clusters Nonmetal Mining Wood Products Forestry Jewelry Vulcanized Materials Agriculture Livestock Aerospace & Defense Lighting Furniture Recreational Construction Fishing Water Transport Goods Medical Devices IT Production Performing Music Hospitality Marketing Education 2 Environmental Services Tobacco Insurance Transportation Distribution & Downstream Chemicals Biopharma Downstream Metals Upstream Metals Plastics Production Technology Metalworking Automotive Upstream Chemicals Business Printing Food Services Leather Products Processing Financial Ol & Gas Services Paper & Apparel Textles Electric Packaging Footwear Trailers & Appliances Coal Mining Metal Mining Select PRINTING and scroll to the map on top. (You must go to the map don't download any data if you don't see the map) 3 This Cluster Dashboard provides data on the economic performance, geographic presence, and subcluster and industry composition of this cluster. The map illustrates the economic geography of this cluster. Click on any region for specific regional data or to go to a Region Dashboard. Use the controls on the map to adjust the type of data displayed. Browse this Summary page or select a tab at the top to dive into more detailed data. HELP O Economic Indicator Specialization Region Type Economic Areas Specialization in Printing Cluster by Economic Area, 2016 High Employment Specialization and Share High Employment Specialization High Employment Share E : All You X ps X Dee X NYU X Not | ps x C X/Users/liangdongcheng/Downloads/ps_urban_2%20FA23.pdf ps_urban_2 FA23.pdf FA33 For this Pro St, EXCEL O O *** 2 / 3 Insurance - 100% + Education ps2 x ps_ Clus Metalworking Automotive Upstream Chemicals Business Services Printing Leather Products Food Processing Environmental Services Financial Services Oil & Gas Tobacco Paper & Packaging Apparel Textiles Electric Power Footwear Trailers & Appliances Coal Mining Metal Mining 0 PS X GPT X + Select PRINTING and scroll to the map on top. (You must go to the map - don't download any data if you don't see the map) 1 This Cluster Dashboard provides data on the economic performance, geographic presence, and subcluster and industry composition of this cluster. The map illustrates the economic geography of this cluster. Click on any region for specific regional data or to go to a Region Dashboard. Use the controls on the map to adjust the type of data displayed. Browse this Summary page or select a tab at the top to dive into more detailed data. 2 HELP O Economic Indicator G Specialization Region Type Economic Areas Start Year 1998 .00 End Year 2016 Specialization in Printing Cluster by Economic Area, 2016 High Employment Specialization and Share High Employment Specialization High Employment Share 3 On the left sidebar you now have various choices; select Economic Areas. Calculate for 1998 and for 2016 the CR4, HHI and Gini Coefficients for employment and for the annual payroll (which is the product of Employment x Annual Wage). For the Gini E : Your X ps X Dee X NYU X Not | ps x ps2 x ps_ Clus X PS X GPT X + C X/Users/liangdongcheng/Downloads/ps_urban_2%20FA23.pdf ps_urban_2 FA23.pdf AAA 1 FAX O 3 / 3 - 100% + A annual payroll (which is the product of Employment x Annual Wage). For the Gini Coefficient, assume that all regions are of identical size (width). Make sure you match each area's employment with its wage. Overall, you have to calculate 12 coefficients (see table below). NOTE: in case the wage is listed as zero, treat it as zero; don't delete it. 2 Year CR4 HHI Employment GINI 1998 (179 Econ Regions) 2016 (179 Econ Regions) Annual Payroll 1998 (179 Econ Regions) 3 2016 (179 Econ Regions) E : All You X ps X Dee X NYU X Not | ps x ps2 x ps_ Clus C X/Users/liangdongcheng/Downloads/ps_urban_2%20FA23.pdf ps_urban_2 FA23.pdf FA33 For this Pro St, EXCEL O O *** 1 2 / 3 - 100% + 0 PS X GPT X + Question (2) Go to Harvard's Cluster Mapping Project's main site (http://clustermapping.us) and click on "Clusters." Scroll down until you see Full Portfolio View of Related Clusters. BCR-95th pctile & BCR 90th-94th petle & Next closest clusters not meet criteria Full Portfolio View of Related Clusters Nonmetal Mining Wood Products Forestry Jewelry Vulcanized Materials Agriculture Livestock Aerospace & Defense Lighting Furniture Recreational Construction Fishing Water Transport Goods Medical Devices IT Production Performing Music Hospitality Marketing Education 2 Environmental Services Tobacco Insurance Transportation Distribution & Downstream Chemicals Biopharma Downstream Metals Upstream Metals Plastics Production Technology Metalworking Automotive Upstream Chemicals Business Printing Food Services Leather Products Processing Financial Ol & Gas Services Paper & Apparel Textles Electric Packaging Footwear Trailers & Appliances Coal Mining Metal Mining Select PRINTING and scroll to the map on top. (You must go to the map don't download any data if you don't see the map) 3 This Cluster Dashboard provides data on the economic performance, geographic presence, and subcluster and industry composition of this cluster. The map illustrates the economic geography of this cluster. Click on any region for specific regional data or to go to a Region Dashboard. Use the controls on the map to adjust the type of data displayed. Browse this Summary page or select a tab at the top to dive into more detailed data. HELP O Economic Indicator Specialization Region Type Economic Areas Specialization in Printing Cluster by Economic Area, 2016 High Employment Specialization and Share High Employment Specialization High Employment Share E : All You X ps X Dee X NYU X Not | ps x C X/Users/liangdongcheng/Downloads/ps_urban_2%20FA23.pdf ps_urban_2 FA23.pdf FA33 For this Pro St, EXCEL O O *** 2 / 3 Insurance - 100% + Education ps2 x ps_ Clus Metalworking Automotive Upstream Chemicals Business Services Printing Leather Products Food Processing Environmental Services Financial Services Oil & Gas Tobacco Paper & Packaging Apparel Textiles Electric Power Footwear Trailers & Appliances Coal Mining Metal Mining 0 PS X GPT X + Select PRINTING and scroll to the map on top. (You must go to the map - don't download any data if you don't see the map) 1 This Cluster Dashboard provides data on the economic performance, geographic presence, and subcluster and industry composition of this cluster. The map illustrates the economic geography of this cluster. Click on any region for specific regional data or to go to a Region Dashboard. Use the controls on the map to adjust the type of data displayed. Browse this Summary page or select a tab at the top to dive into more detailed data. 2 HELP O Economic Indicator G Specialization Region Type Economic Areas Start Year 1998 .00 End Year 2016 Specialization in Printing Cluster by Economic Area, 2016 High Employment Specialization and Share High Employment Specialization High Employment Share 3 On the left sidebar you now have various choices; select Economic Areas. Calculate for 1998 and for 2016 the CR4, HHI and Gini Coefficients for employment and for the annual payroll (which is the product of Employment x Annual Wage). For the Gini E : Your X ps X Dee X NYU X Not | ps x ps2 x ps_ Clus X PS X GPT X + C X/Users/liangdongcheng/Downloads/ps_urban_2%20FA23.pdf ps_urban_2 FA23.pdf AAA 1 FAX O 3 / 3 - 100% + A annual payroll (which is the product of Employment x Annual Wage). For the Gini Coefficient, assume that all regions are of identical size (width). Make sure you match each area's employment with its wage. Overall, you have to calculate 12 coefficients (see table below). NOTE: in case the wage is listed as zero, treat it as zero; don't delete it. 2 Year CR4 HHI Employment GINI 1998 (179 Econ Regions) 2016 (179 Econ Regions) Annual Payroll 1998 (179 Econ Regions) 3 2016 (179 Econ Regions) E :
Expert Answer:

Related Book For 

Income Tax Fundamentals 2013
ISBN: 9781285586618
31st Edition
Authors: Gerald E. Whittenburg, Martha Altus Buller, Steven L Gill
Posted Date:
Students also viewed these accounting questions
-
C) Assume an investor bought 800 shares of the hypothetical company Global Gizmo Inc. at $15 per share. One year later, the investor sold the shares for $18.75. The investor earned dividends of $600...
-
On March 31, 2021, Chow Brothers, Inc., bought 6% of KT Manufacturings capital stock for $53.9 million. KTs net income for the year ended December 31, 2021, was $81.3 million. The fair value of the...
-
Planning is one of the most important management functions in any business. A front office managers first step in planning should involve determine the departments goals. Planning also includes...
-
In preparing the consolidation worksheet for Bolger Corporation and its 60 percent owned subsidiary, Feldman Company, the following elimination entries were proposed by Bolgers bookkeeper: Bolger's...
-
Christina runs an IT consulting firm in a competitive market. She recently determined that hiring an additional consultant would mean that she would be able to serve five more clients per week....
-
Some glasses used for viewing 3D movies are polarized, one lens having a vertical transmission axis and the other horizontal. While standing in line on a winter afternoon for a 3D movie and looking...
-
You are presented with the following summarised information relating to Block plc for the year to 30 September 2008: Additional information: 1 Block purchased 80% of the share capital of Chip on 1...
-
Database Systems is considering expansion into a new product line. Assets to support expansion will cost $380,000. It is estimated that Database can generate $1,410,000 in annual sales, with an 8...
-
Develop a fractal by beginning with the following figure and replacing with a L. Repeat this process twice. each side
-
Mapua is considering upgrading the capability of its computer, which has been bought 2 years ago at a cost of P10M with an annual operating cost of P1020479, and if retained for 4 more years, will be...
-
What is the relationship between organizational commitment and employee retention, and how can organizations use this relationship to develop effective retention strategies ?
-
Helen Quick made an investment of $20,542.75. From this investment, she will receive $2,400 annually for the next 15 years starting one year from now. Click here to view the factor'table What rate of...
-
1. What is the difference between an allowance and a reim-bursement? How does this difference affect labor burden? 2. Why are the social security and Medicare taxes paid by the employee not included...
-
Zisk Company purchases direct materials on credit. Budgeted purchases are April, $90,000; May, $120,000; and June, $130,000. Cash payments for purchases are: 75% in the month of purchase and 25% in...
-
Cost: $ 5 0 , 0 0 0 Depreciation method: Sum of the year s digits Salvage ( residual ) value: $ 5 , 0 0 0 Estimated useful life ( years ) : 5 Depreciation Schedule -...
-
make a script you would present at QCAT hearing. you are being the property manager. outlining the reasons why the tenant is not getting their bond back due to not cleaning the property to a...
-
What exactly is a prima facie duty? How does an ethic of prima facie duties differ from monistic and absolutist ethical theories?
-
The United States is the largest producer of corn in the world. Each year, a corn farmer must decide what type of seed to use and what the end market for the corn crop will be. In approximately a...
-
Why do buyers involved in straight rebuy purchases require less information than those making new-task purchases?
-
Why might business customers generally be considered more rational in their purchasing behavior than ultimate consumers?

Study smarter with the SolutionInn App