

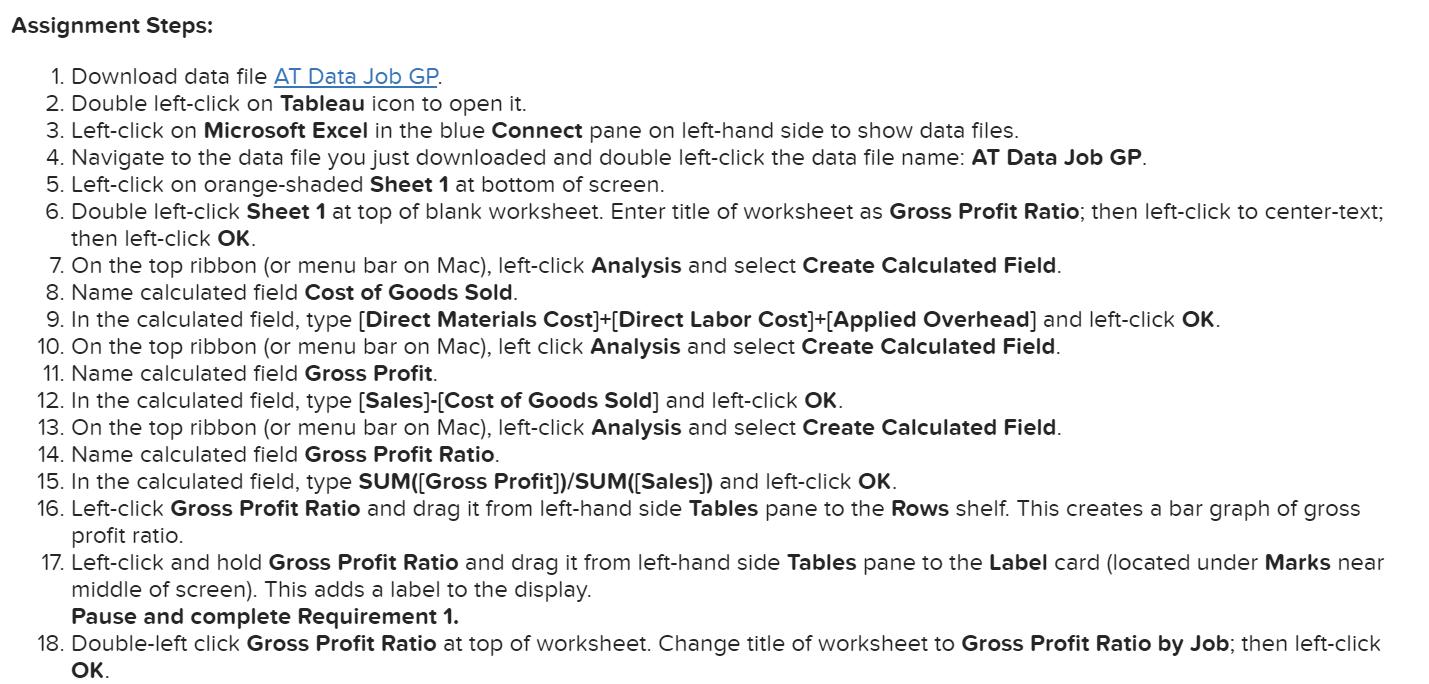
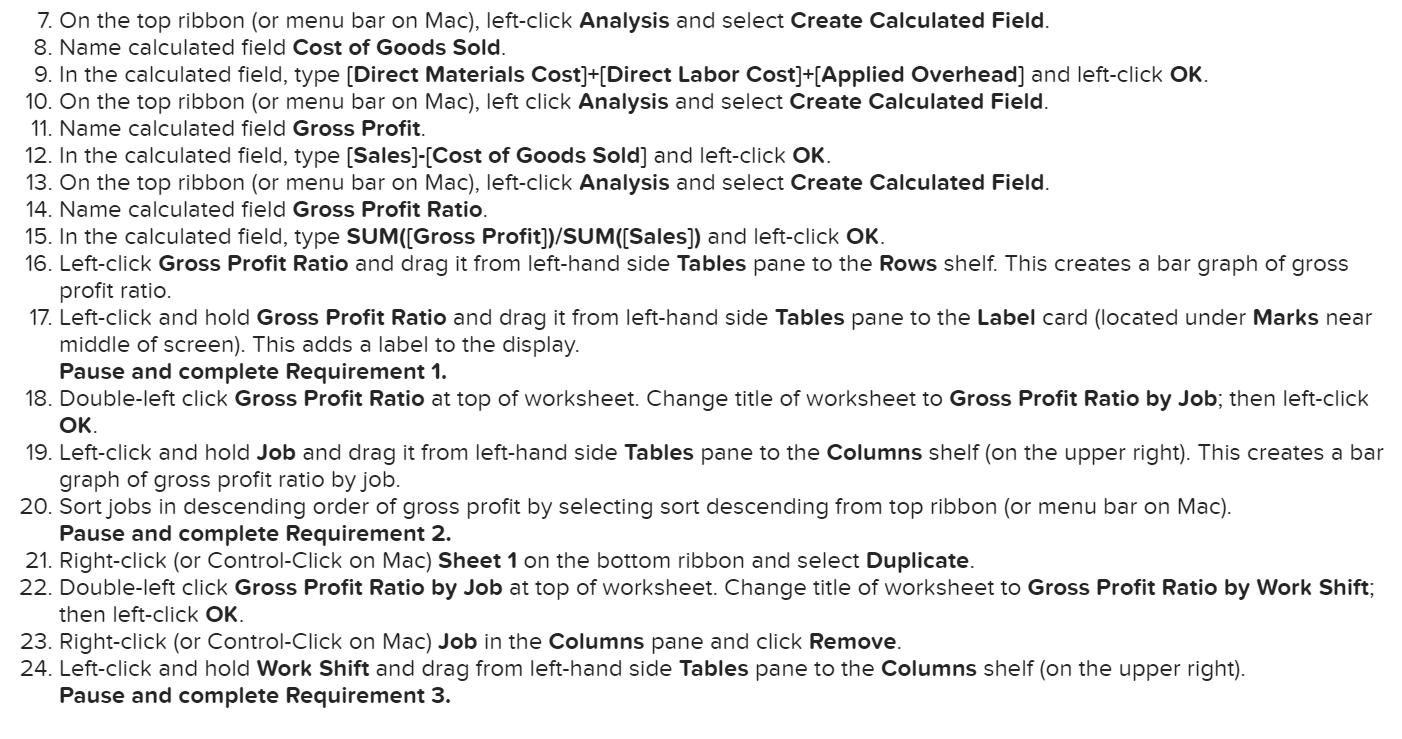
Assignment Steps: 1. Download data file AT Data Job GP. 2. Double left-click on Tableau icon...
Fantastic news! We've Found the answer you've been seeking!
Question:
Transcribed Image Text:
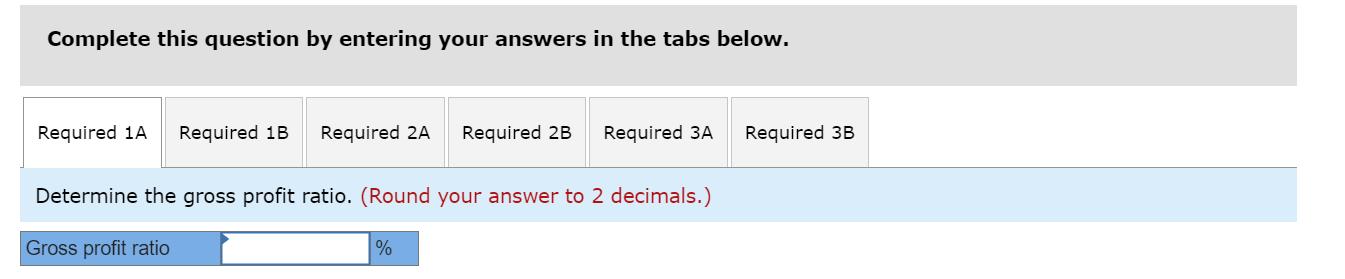
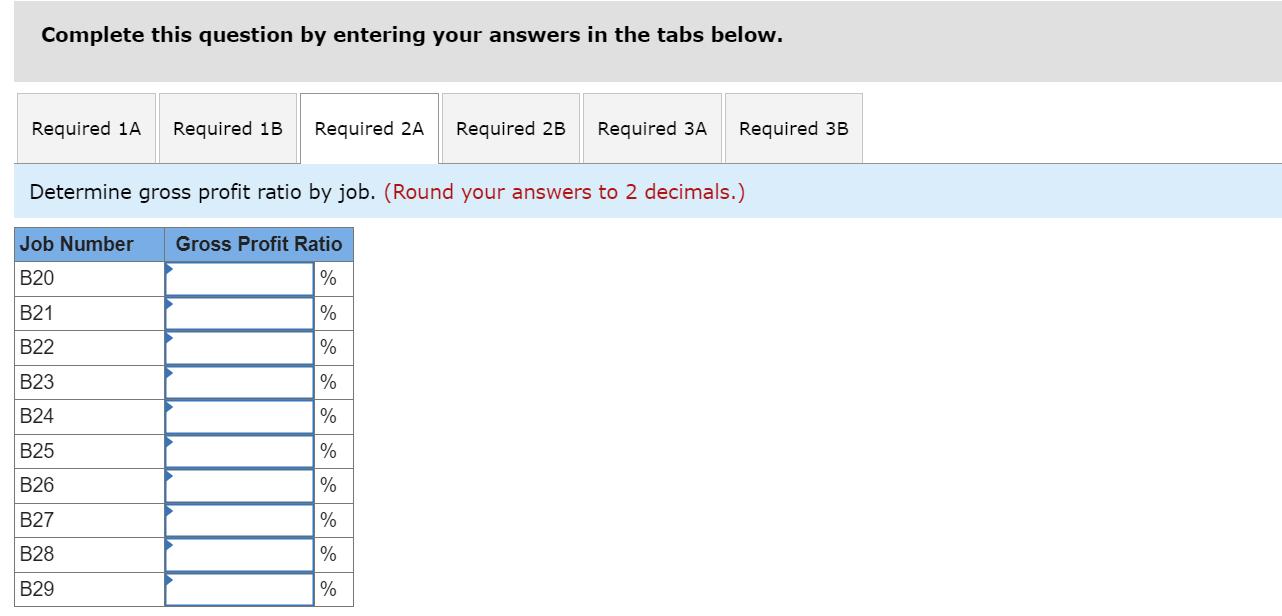
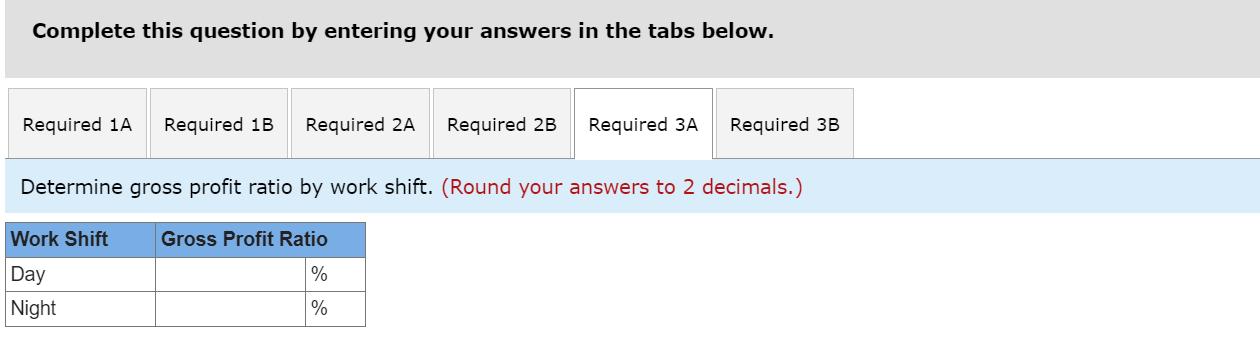
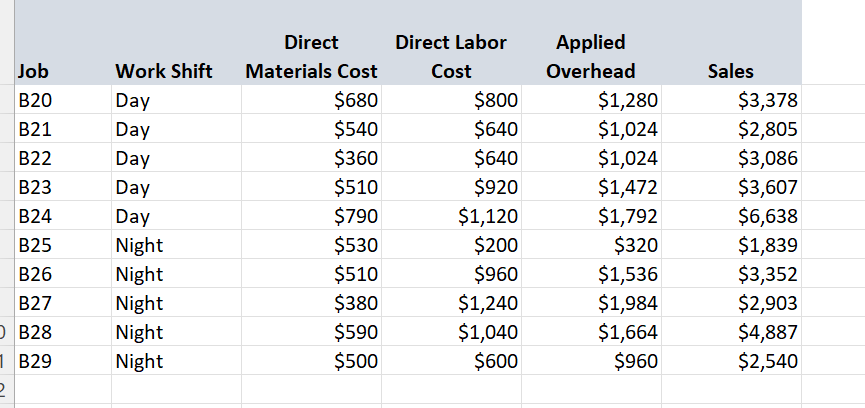
Assignment Steps: 1. Download data file AT Data Job GP. 2. Double left-click on Tableau icon to open it. 3. Left-click on Microsoft Excel in the blue Connect pane on left-hand side to show data files. 4. Navigate to the data file you just downloaded and double left-click the data file name: AT Data Job GP. 5. Left-click on orange-shaded Sheet 1 at bottom of screen. 6. Double left-click Sheet 1 at top of blank worksheet. Enter title of worksheet as Gross Profit Ratio; then left-click to center-text; then left-click OK. 7. On the top ribbon (or menu bar on Mac), left-click Analysis and select Create Calculated Field. 8. Name calculated field Cost of Goods Sold. 9. In the calculated field, type [Direct Materials Cost]+[Direct Labor Cost]+[Applied Overhead] and left-click OK. 10. On the top ribbon (or menu bar on Mac), left click Analysis and select Create Calculated Field. 11. Name calculated field Gross Profit. 12. In the calculated field, type [Sales]-[Cost of Goods Sold] and left-click OK. 13. On the top ribbon (or menu bar on Mac), left-click Analysis and select Create Calculated Field. 14. Name calculated field Gross Profit Ratio. 15. In the calculated field, type SUM([Gross Profit])/SUM([Sales]) and left-click OK. 16. Left-click Gross Profit Ratio and drag it from left-hand side Tables pane to the Rows shelf. This creates a bar graph of gross profit ratio. 17. Left-click and hold Gross Profit Ratio and drag it from left-hand side Tables pane to the Label card (located under Marks near middle of screen). This adds a label to the display. Pause and complete Requirement 1. 18. Double-left click Gross Profit Ratio at top of worksheet. Change title of worksheet to Gross Profit Ratio by Job; then left-click OK. 7. On the top ribbon (or menu bar on Mac), left-click Analysis and select Create Calculated Field. 8. Name calculated field Cost of Goods Sold. 9. In the calculated field, type [Direct Materials Cost]+[Direct Labor Cost]+[Applied Overhead] and left-click OK. 10. On the top ribbon (or menu bar on Mac), left click Analysis and select Create Calculated Field. 11. Name calculated field Gross Profit. 12. In the calculated field, type [Sales]-[Cost of Goods Sold] and left-click OK. 13. On the top ribbon (or menu bar on Mac), left-click Analysis and select Create Calculated Field. 14. Name calculated field Gross Profit Ratio. 15. In the calculated field, type SUM([Gross Profit])/SUM([Sales]) and left-click OK. 16. Left-click Gross Profit Ratio and drag it from left-hand side Tables pane to the Rows shelf. This creates a bar graph of gross profit ratio. 17. Left-click and hold Gross Profit Ratio and drag it from left-hand side Tables pane to the Label card (located under Marks near middle of screen). This adds a label to the display. Pause and complete Requirement 1. 18. Double-left click Gross Profit Ratio at top of worksheet. Change title of worksheet to Gross Profit Ratio by Job; then left-click OK. 19. Left-click and hold Job and drag it from left-hand side Tables pane to the Columns shelf (on the upper right). This creates a bar graph of gross profit ratio by job. 20. Sort jobs in descending order of gross profit by selecting sort descending from top ribbon (or menu bar on Mac). Pause and complete Requirement 2. 21. Right-click (or Control-Click on Mac) Sheet 1 on the bottom ribbon and select Duplicate. 22. Double-left click Gross Profit Ratio by Job at top of worksheet. Change title of worksheet to Gross Profit Ratio by Work Shift; then left-click OK. 23. Right-click (or Control-Click on Mac) Job in the Columns pane and click Remove. 24. Left-click and hold Work Shift and drag from left-hand side Tables pane to the Columns shelf (on the upper right). Pause and complete Requirement 3. Complete this question by entering your answers in the tabs below. Required 1A Required 1B Required 2A Required 2B Required 3A Determine the gross profit ratio. (Round your answer to 2 decimals.) Gross profit ratio % Required 3B Complete this question by entering your answers in the tabs below. Required 1A Required 1B Required 2A Required 2B Required 3A Required 3B Determine gross profit ratio by job. (Round your answers to 2 decimals.) Job Number Gross Profit Ratio B20 % % % B21 B22 B23 B24 B25 B26 B27 B28 B29 % % % % % % % Complete this question by entering your answers in the tabs below. Required 1A Required 1B Required 2A Required 2B Required 3A Required 3B Determine gross profit ratio by work shift. (Round your answers to 2 decimals.) Gross Profit Ratio % % Work Shift Day Night Job B20 B21 B22 B23 B24 B25 B26 B27 D B28 1 B29 2 Work Shift Day Day Day Day Day Night Night Night Night Night Direct Materials Cost $680 $540 $360 $510 $790 $530 $510 $380 $590 $500 Direct Labor Cost $800 $640 $640 $920 $1,120 $200 $960 $1,240 $1,040 $600 Applied Overhead $1,280 $1,024 $1,024 $1,472 $1,792 $320 $1,536 $1,984 $1,664 $960 Sales $3,378 $2,805 $3,086 $3,607 $6,638 $1,839 $3,352 $2,903 $4,887 $2,540 Assignment Steps: 1. Download data file AT Data Job GP. 2. Double left-click on Tableau icon to open it. 3. Left-click on Microsoft Excel in the blue Connect pane on left-hand side to show data files. 4. Navigate to the data file you just downloaded and double left-click the data file name: AT Data Job GP. 5. Left-click on orange-shaded Sheet 1 at bottom of screen. 6. Double left-click Sheet 1 at top of blank worksheet. Enter title of worksheet as Gross Profit Ratio; then left-click to center-text; then left-click OK. 7. On the top ribbon (or menu bar on Mac), left-click Analysis and select Create Calculated Field. 8. Name calculated field Cost of Goods Sold. 9. In the calculated field, type [Direct Materials Cost]+[Direct Labor Cost]+[Applied Overhead] and left-click OK. 10. On the top ribbon (or menu bar on Mac), left click Analysis and select Create Calculated Field. 11. Name calculated field Gross Profit. 12. In the calculated field, type [Sales]-[Cost of Goods Sold] and left-click OK. 13. On the top ribbon (or menu bar on Mac), left-click Analysis and select Create Calculated Field. 14. Name calculated field Gross Profit Ratio. 15. In the calculated field, type SUM([Gross Profit])/SUM([Sales]) and left-click OK. 16. Left-click Gross Profit Ratio and drag it from left-hand side Tables pane to the Rows shelf. This creates a bar graph of gross profit ratio. 17. Left-click and hold Gross Profit Ratio and drag it from left-hand side Tables pane to the Label card (located under Marks near middle of screen). This adds a label to the display. Pause and complete Requirement 1. 18. Double-left click Gross Profit Ratio at top of worksheet. Change title of worksheet to Gross Profit Ratio by Job; then left-click OK. 7. On the top ribbon (or menu bar on Mac), left-click Analysis and select Create Calculated Field. 8. Name calculated field Cost of Goods Sold. 9. In the calculated field, type [Direct Materials Cost]+[Direct Labor Cost]+[Applied Overhead] and left-click OK. 10. On the top ribbon (or menu bar on Mac), left click Analysis and select Create Calculated Field. 11. Name calculated field Gross Profit. 12. In the calculated field, type [Sales]-[Cost of Goods Sold] and left-click OK. 13. On the top ribbon (or menu bar on Mac), left-click Analysis and select Create Calculated Field. 14. Name calculated field Gross Profit Ratio. 15. In the calculated field, type SUM([Gross Profit])/SUM([Sales]) and left-click OK. 16. Left-click Gross Profit Ratio and drag it from left-hand side Tables pane to the Rows shelf. This creates a bar graph of gross profit ratio. 17. Left-click and hold Gross Profit Ratio and drag it from left-hand side Tables pane to the Label card (located under Marks near middle of screen). This adds a label to the display. Pause and complete Requirement 1. 18. Double-left click Gross Profit Ratio at top of worksheet. Change title of worksheet to Gross Profit Ratio by Job; then left-click OK. 19. Left-click and hold Job and drag it from left-hand side Tables pane to the Columns shelf (on the upper right). This creates a bar graph of gross profit ratio by job. 20. Sort jobs in descending order of gross profit by selecting sort descending from top ribbon (or menu bar on Mac). Pause and complete Requirement 2. 21. Right-click (or Control-Click on Mac) Sheet 1 on the bottom ribbon and select Duplicate. 22. Double-left click Gross Profit Ratio by Job at top of worksheet. Change title of worksheet to Gross Profit Ratio by Work Shift; then left-click OK. 23. Right-click (or Control-Click on Mac) Job in the Columns pane and click Remove. 24. Left-click and hold Work Shift and drag from left-hand side Tables pane to the Columns shelf (on the upper right). Pause and complete Requirement 3. Complete this question by entering your answers in the tabs below. Required 1A Required 1B Required 2A Required 2B Required 3A Determine the gross profit ratio. (Round your answer to 2 decimals.) Gross profit ratio % Required 3B Complete this question by entering your answers in the tabs below. Required 1A Required 1B Required 2A Required 2B Required 3A Required 3B Determine gross profit ratio by job. (Round your answers to 2 decimals.) Job Number Gross Profit Ratio B20 % % % B21 B22 B23 B24 B25 B26 B27 B28 B29 % % % % % % % Complete this question by entering your answers in the tabs below. Required 1A Required 1B Required 2A Required 2B Required 3A Required 3B Determine gross profit ratio by work shift. (Round your answers to 2 decimals.) Gross Profit Ratio % % Work Shift Day Night Job B20 B21 B22 B23 B24 B25 B26 B27 D B28 1 B29 2 Work Shift Day Day Day Day Day Night Night Night Night Night Direct Materials Cost $680 $540 $360 $510 $790 $530 $510 $380 $590 $500 Direct Labor Cost $800 $640 $640 $920 $1,120 $200 $960 $1,240 $1,040 $600 Applied Overhead $1,280 $1,024 $1,024 $1,472 $1,792 $320 $1,536 $1,984 $1,664 $960 Sales $3,378 $2,805 $3,086 $3,607 $6,638 $1,839 $3,352 $2,903 $4,887 $2,540
Expert Answer:
Answer rating: 100% (QA)
Here are the stepbystep workings 1 Gross Profit Ratio Create Cost of G... View the full answer

Related Book For 
Intermediate Accounting
ISBN: 978-1260481952
10th edition
Authors: J. David Spiceland, James Sepe, Mark Nelson, Wayne Thomas
Posted Date:
Students also viewed these accounting questions
-
Earlyrain Inc.'s 2023 income statement, excluding the earnings per share portion of the statement, was as follows: Revenues Expenses: Depreciation Income taxes Other expenses Profit from continuing...
-
A small consulting company wants to make the switch to QuickBooks Online. All of their expenses are paid at the time they are incurred, so there is no need to track bills in the system. There is only...
-
In the Chapter 3 Data Analytics Case, you applied Tableau to examine a data set and create calculations to compare two companies profitability. For the case in this chapter, you continue in your role...
-
In Exercises 912, use the given conditions to write an equation for each line in point-slope form and general form Passing through (4, -7) and perpendicular to the line whose equation is x - 2y - 3 =...
-
A 40.0-F capacitor is connected across a 60.0-Hz generator. An inductor is then connected in parallel with the capacitor. What is the value of the inductance if the rms currents in the inductor and...
-
Your plc is a fast-growing, hi-tech business. Its income statement for the year ended 30 September 2010 and its balance sheet as of 30 September 2010 are shown below. The company has the opportunity...
-
Gold Nest Company of Guandong, China, is a family-owned enterprise that makes birdcages for the South China market. A popular pastime among older Chinese men is to take their pet birds on daily...
-
Millbridge Memorial Hospital provides comprehensive physical exams. The charge per exam is $ 100, while the variable cost per exam is $ 65. Thirty percent of the patients who come in for exams are...
-
angles of a triangle and the lengths of the sides opposite them be answering the questions below. 549 48 35% 90% F 389 T 61 PU 103 29 G M Triangle Measures of the Angles Lengths of Sides Opposite the...
-
1. How will you characterize Tupperwares distribution strategy in relation to the theoretical models? 2. What are the advantages and disadvantages of Tupperwares distribution model? 3. How do you...
-
Explain why your variable is important and deserves to be monitored, explained and predicted. 2. Create a graph in Excel showing the evolution of your chosen variable since 2000 till June 2023. 3....
-
The cost of logistics varies widely from organisation to organisation. What factors affect these costs? Are the costs fixed or can they be controlled?
-
What information used to prepare an owners' equity statement is obtained from the distribution of net income statement?
-
Applied manufacturing overhead costs are recorded: a. On the left (debit) of the Work in Process Inventory account. b. On the right (credit) side of the Work in Process Inventory account. c. On the...
-
What accounts are debited and credited when a partner withdraws cash from the partnership?
-
Very few organisations deal with the final customer for a product. Most operations work upstream and form one step of the supply chain, often passing materials to internal customers within the same...
-
Part I: Give an example of an approach used by a company to redesign a job(s). You can choose a job within your organization or find one online. Part II: Among the various alternative sch...
-
Prove the following D,(cos x) = - sin x (Hint: Apply the identity cos(A + B) = cos A cos B sin A sin B)
-
Distinguish between the direct method and the indirect method for reporting the results of operating activities in the statement of cash flows.
-
Ahnberg Corporation had 800,000 shares of common stock issued and outstanding at January 1. No common shares were issued during the year, but on January 1 Ahnberg issued 100,000 shares of convertible...
-
The balance sheet of Consolidated Paper, Inc., included the following shareholders equity accounts at December 31, 2020: During 2021, several events and transactions affected the retained earnings of...
-
Chelsea Fabricating applies variable overhead to products on the basis of standard direct labor hours. Presented is selected information for last month when 10,000 units were produced. Required Solve...
-
Presented are partial flexible cost budgets for various levels of output. Required Solve for items a though n. Direct materials Direct labor.. Variable overhead.. Fixed overhead.. Total Rate per unit...
-
Petra Company uses standard costs for cost control and internal reporting. Fixed costs are budgeted at \($36,000\) per month at a normal operating level of 10,000 units of production output. During...

Study smarter with the SolutionInn App