1. Based on the information in Figure 2, illustrate in a diagram how Bruno would decide to...
Question:
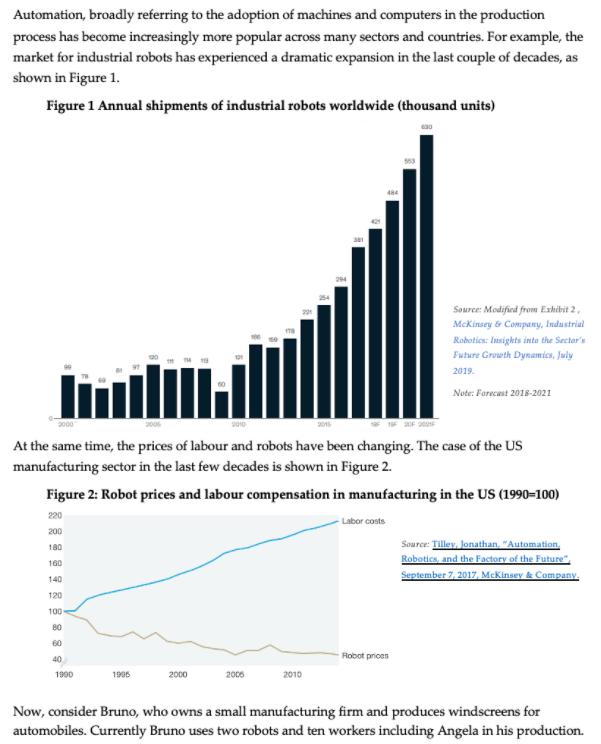
1. Based on the information in Figure 2, illustrate in a diagram how Bruno would decide to use more robots in his firm to minimise production costs. Your diagram should have the number of workers on the horizontal axis and the number of robots on the vertical axis. It is not necessary to use specific numbers.
2. Explain in 100-130 words why the market for industrial robots have expanded in the last couple of decades as shown in Figure 1. You must refer to the information from Figure 2 and the diagram you drew in the previous question.
3. Draw the production function of Bruno’s firm. Your diagram should have the number of workers on the horizontal axis and the number of windscreens on the vertical axis. Illustrate the effect of Bruno’s decision to use more robots on his production function. Briefly explain your diagram within 50 words.
Expert Answer: