

Can you tell me what to change to win this Business Strategy Game E Company (practice) DECISION
Fantastic news! We've Found the answer you've been seeking!
Question:
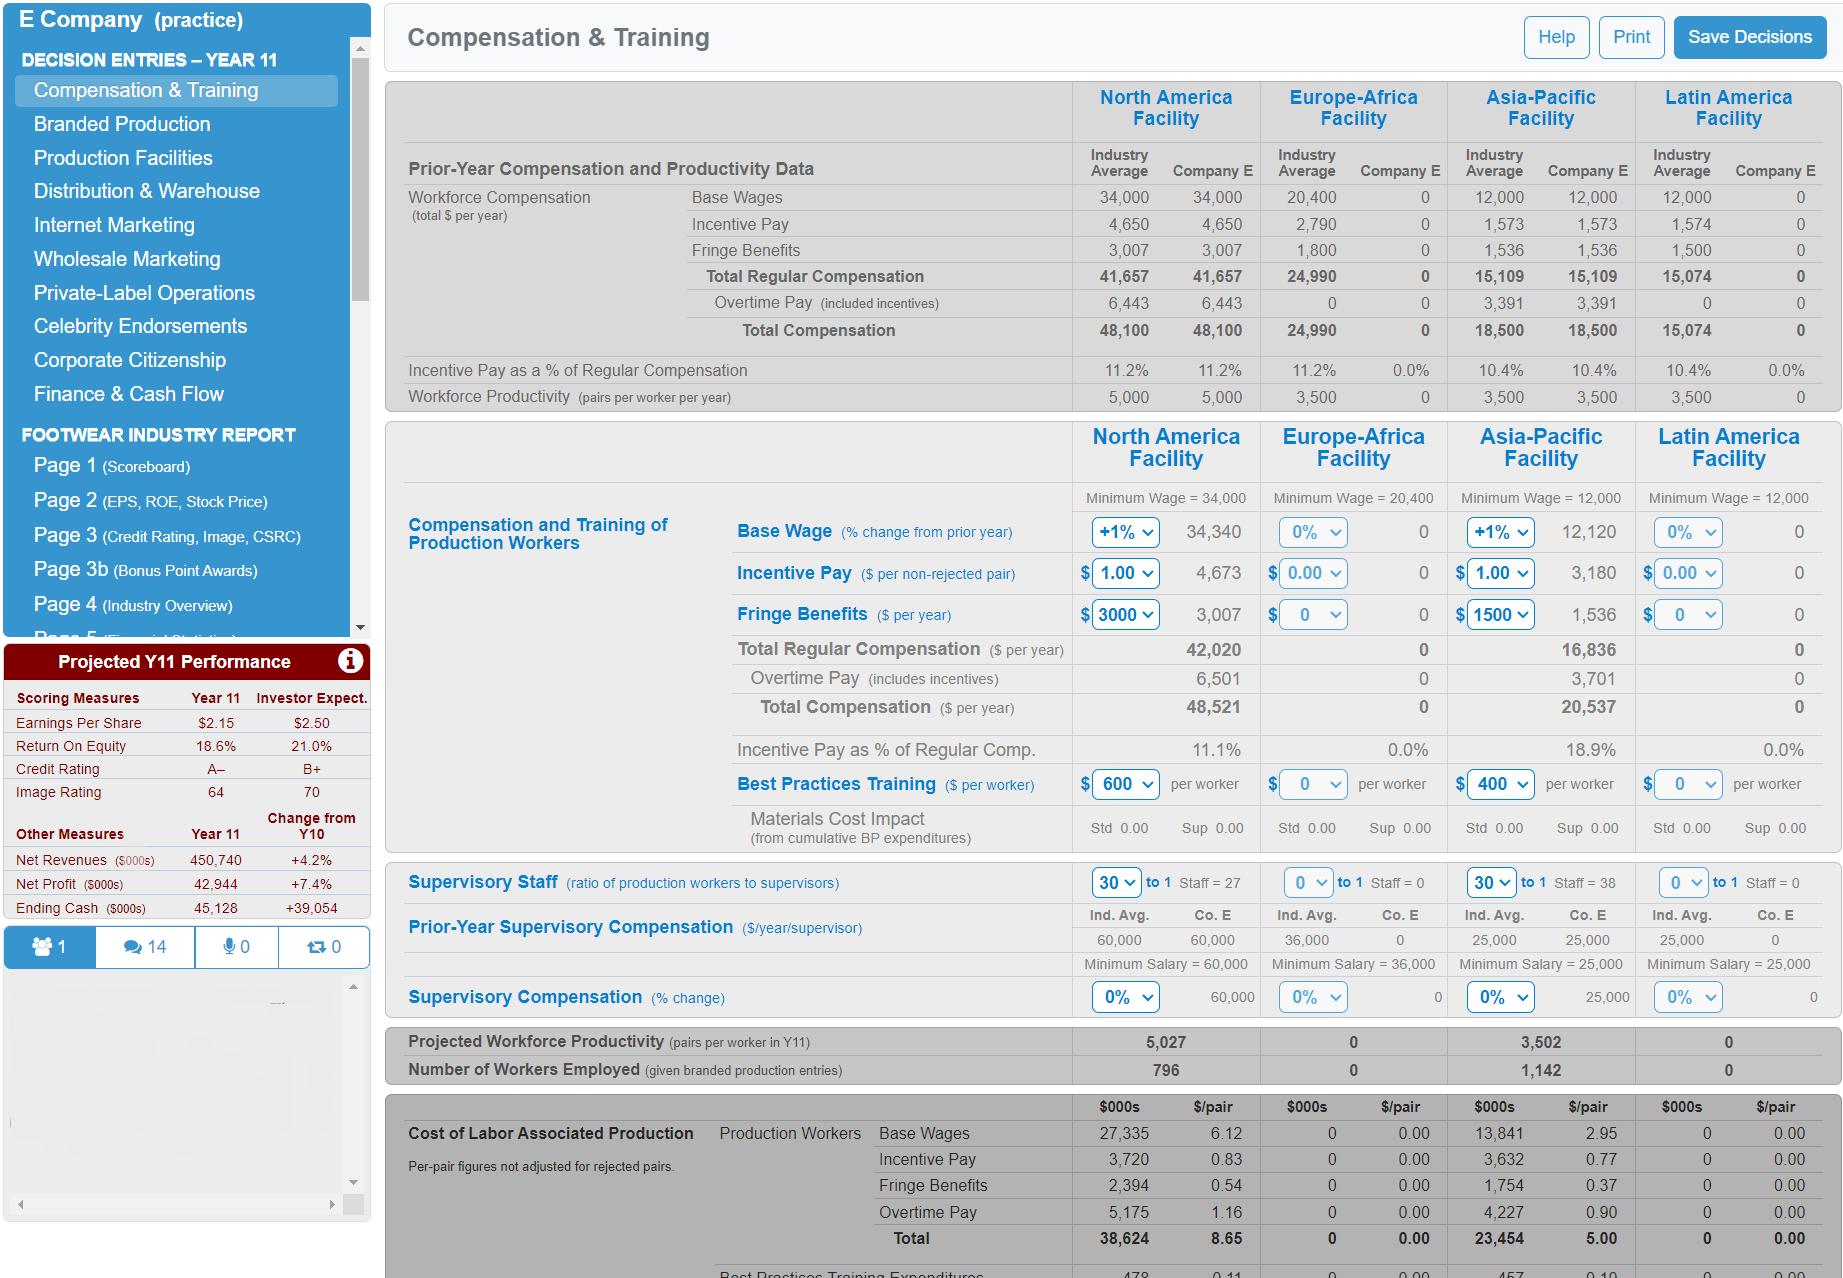
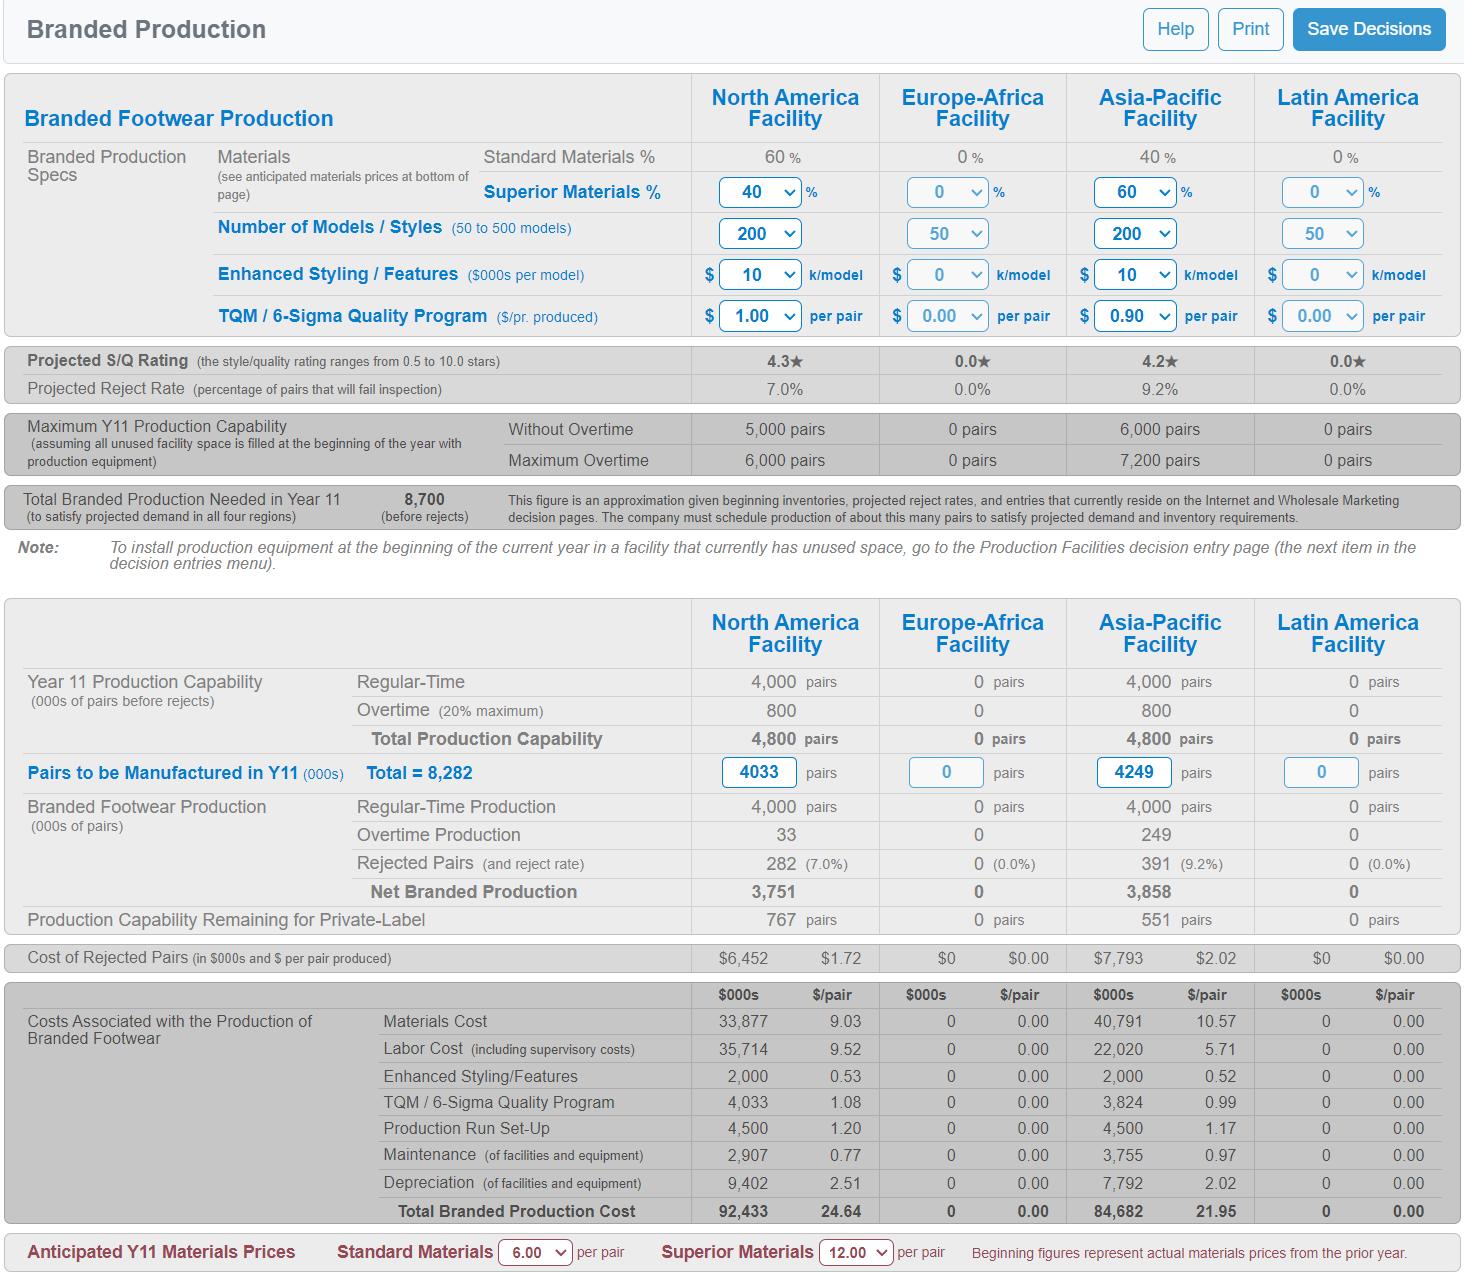
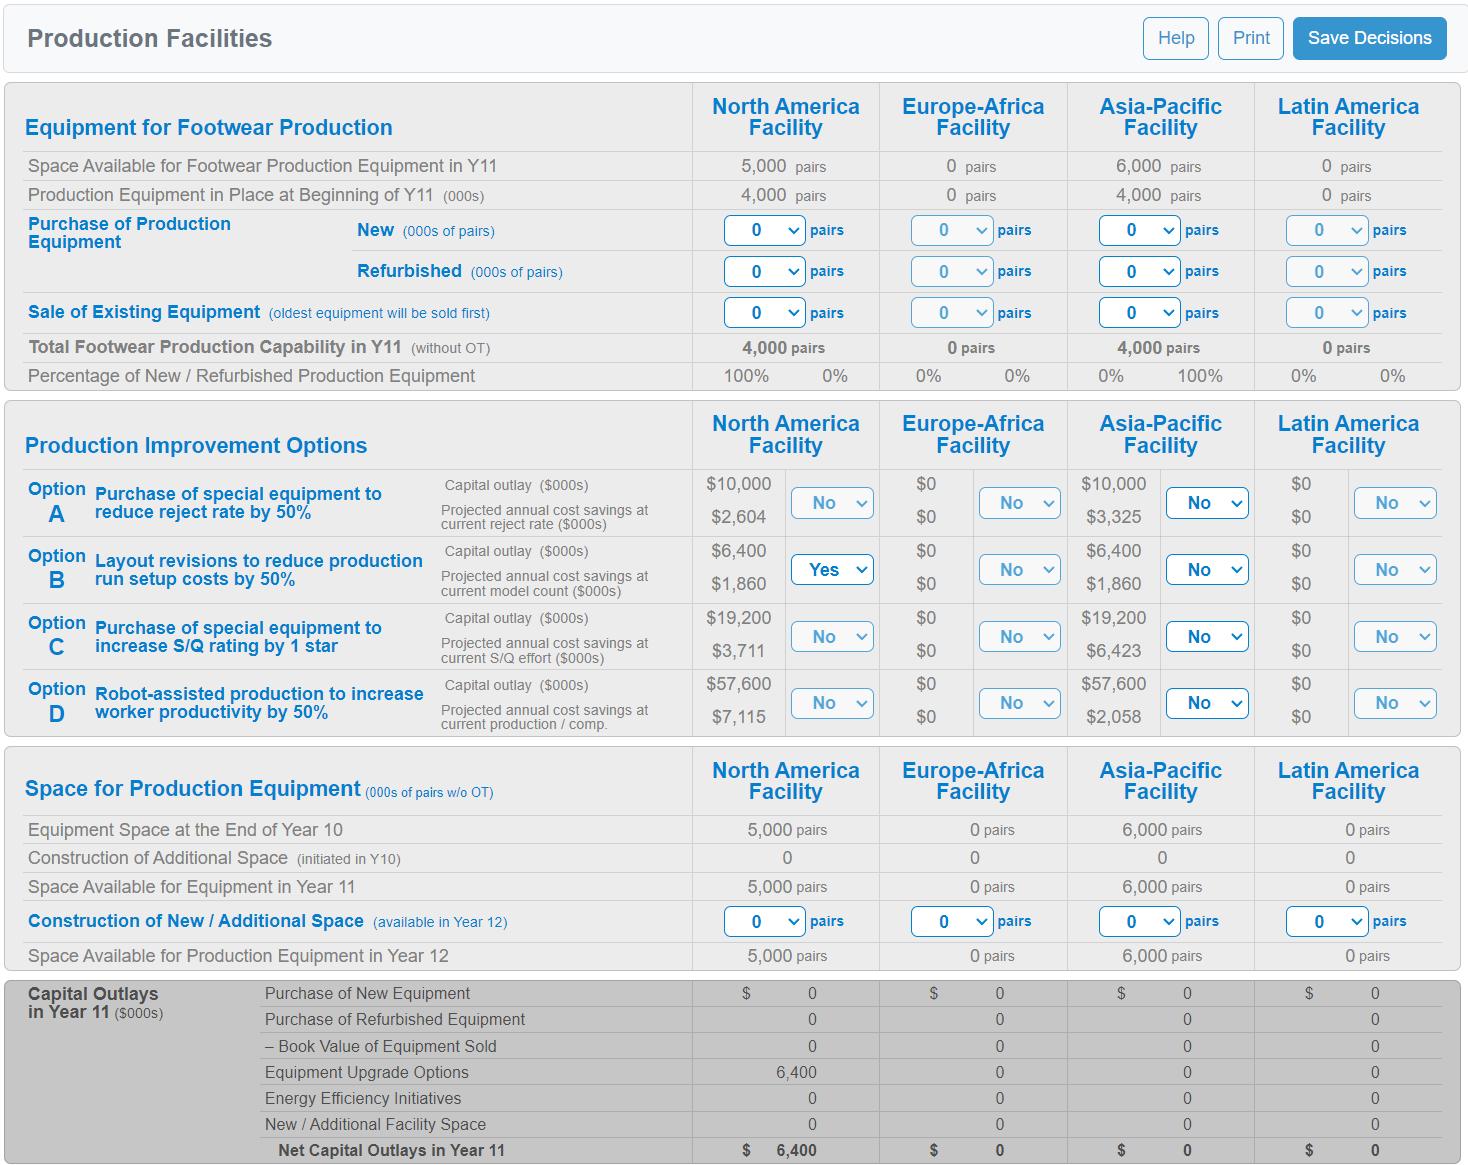
Can you tell me what to change to win this Business Strategy Game
Expert Answer:
To improve your performance in the Business Strategy Game BSG you need to analyze the provided data and make strategic decisions accordingly Here are ... View the full answer

Related Book For 
Auditing Cases An Interactive Learning Approach
ISBN: 978-0132423502
4th Edition
Authors: Steven M Glover, Douglas F Prawitt
Posted Date:
