

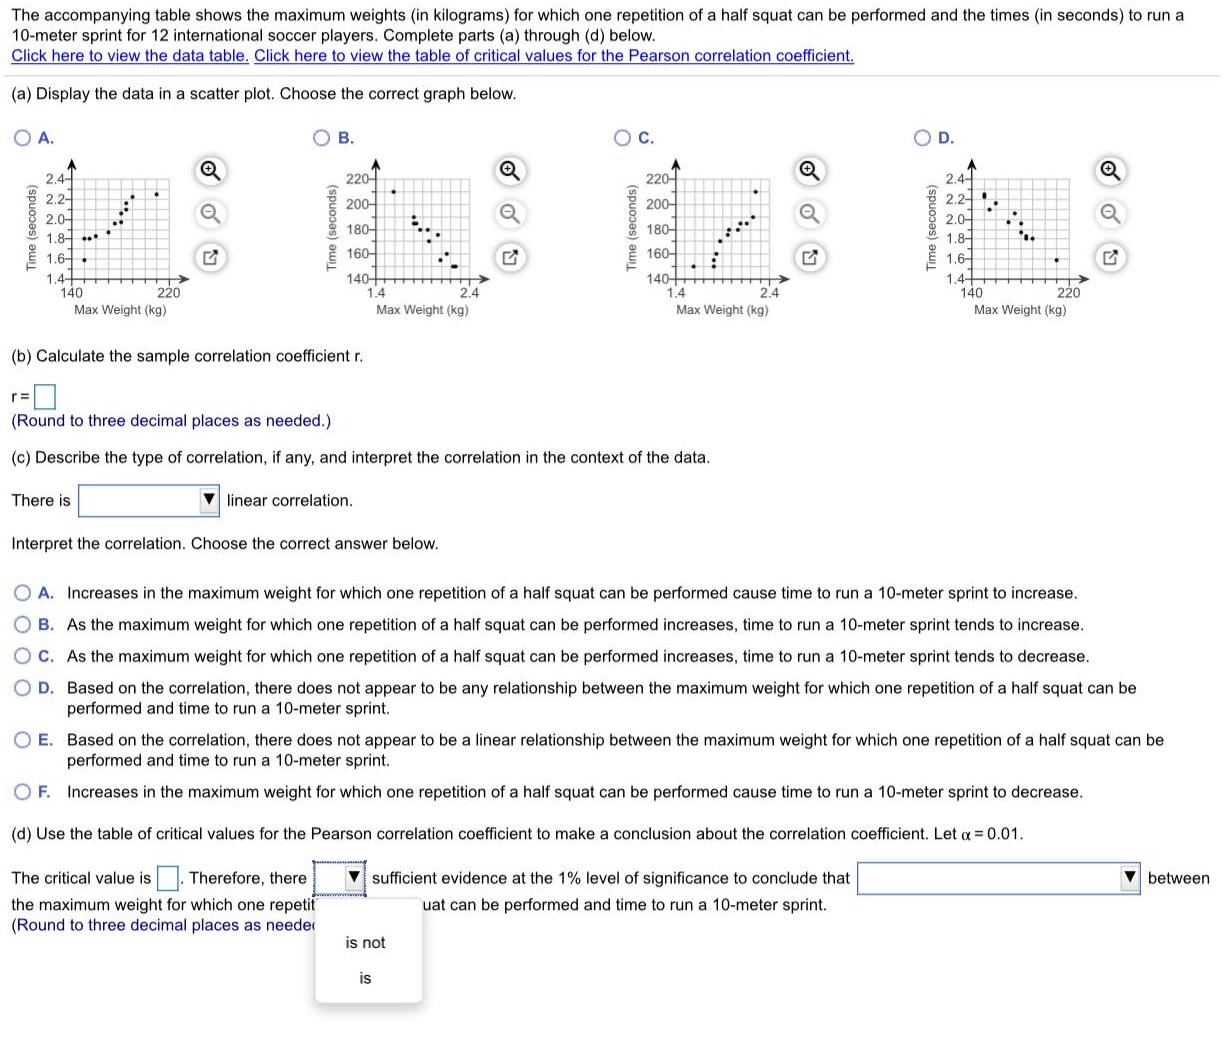
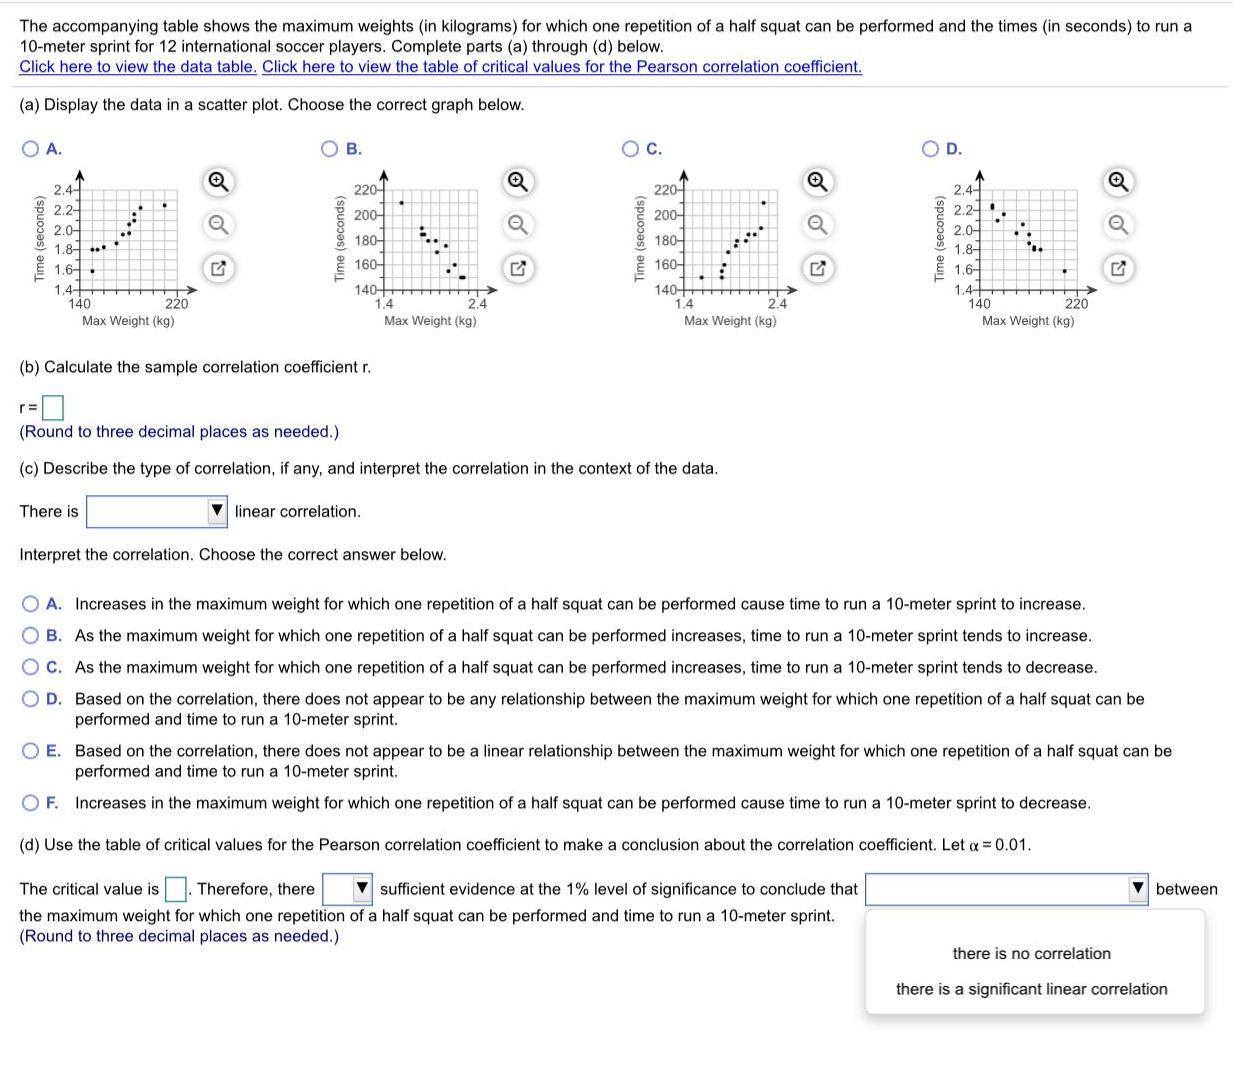
The accompanying table shows the maximum weights (in kilograms) for which one repetition of a half...
Fantastic news! We've Found the answer you've been seeking!
Question:

Transcribed Image Text:
The accompanying table shows the maximum weights (in kilograms) for which one repetition of a half squat can be performed and the times (in seconds) to run a 10-meter sprint for 12 international soccer players. Complete parts (a) through (d) below. Click here to view the data table. Click here to view the table of critical values for the Pearson correlation coefficient. (a) Display the data in a scatter plot. Choose the correct graph below. O A. В. С. D. 2.4- 2.2- 2.0- 1.8- 2.4- 220- 220 2.2- 200- 200- 2.0- 180- 180- 1.8- .* 160- 160- 1.6- 1.4 140 Max Weight (kg) 1.6- 1.4 140 Max Weight (kg) 140- 1.4 140+ 1.4 220 2.4 Max Weight (kg) 2.4 220 Max Weight (kg) (b) Calculate the sample correlation coefficient r. (Round to three decimal places as needed.) (c) Describe the type of correlation, if any, and interpret the correlation in the context of the data. There is V linear correlation. Interprett correct answer below, a perfect positive O A. In eight for which one repetition of a half squat can be performed cause time to run a 10-meter sprint to increase. no О В. А vhich one repetition of a half squat can be performed increases, time to run a 10-meter sprint tends to increase. a strong negative ОС. А vhich one repetition of a half squat can be performed increases, time to run a 10-meter sprint tends to decrease. a weak positive O D. B re does not appear to be any relationship between the maximum weight for which one repetition of a half squat can be 10-meter sprint. pe a weak negative ОЕ. В re does not appear to be a linear relationship between the maximum weight for which one repetition of a half squat can be 10-meter sprint. a perfect negative pi a strong positive O F. In eight for which one repetition of a half squat can be performed cause time to run a 10-meter sprint to decrease. (d) Use the table of critical values for the Pearson correlation coefficient to make a conclusion about the correlation coefficient. Let a = 0.01. The critical value is. Therefore, there sufficient evidence at the 1% level of significance to conclude that V between the maximum weight for which one repetition of a half squat can be performed and time to run a 10-meter sprint. (Round to three decimal places as needed.) The accompanying table shows the maximum weights (in kilograms) for which one repetition of a half squat can be performed and the times (in seconds) to run a 10-meter sprint for 12 international soccer players. Complete parts (a) through (d) below. Click here to view the data table. Click here to view the table critical values for the Pearson correlation coefficient. (a) Display the data in a scatter plot. Choose the correct graph below. O A. В. OC. OD. 220 2.4- 2.2- 2.0- 220- 2.4- 2.2- 2.0- 1.8- 1.6- 1.4 140 Max Weight (kg) 200- 200- 180- 180- 1.8- .* 1.6-. 160- 160- 1.4+ 140 Max Weight (kg) 140- 1.4 140- 1.4 220 2.4 220 2.4 Max Weight (kg) Max Weight (kg) (b) Calculate the sample correlation coefficient r. (Round to three decimal places as needed.) (c) Describe the type of correlation, if any, and interpret the correlation in the context of the data. There is linear correlation. Interpret the correlation. Choose the correct answer below. O A. Increases in the maximum weight for which one repetition of a half squat can be performed cause time to run a 10-meter sprint to increase. O B. As the maximum weight for which one repetition of a half squat can be performed increases, time to run a 10-meter sprint tends to increase. O C. As the maximum weight for which one repetition of a half squat can be performed increases, time to run a 10-meter sprint tends to decrease. O D. Based on the correlation, there does not appear to be any relationship between the maximum weight for which one repetition of a half squat can be performed and time to run a 10-meter sprint. O E. Based on the correlation, there does not appear to be a linear relationship between the maximum weight for which one repetition of a half squat can be performed and time to run a 10-meter sprint. O F. Increases in the maximum weight for which one repetition of a half squat can be performed cause time to run a 10-meter sprint to decrease. (d) Use the table of critical values for the Pearson correlation coefficient to make a conclusion about the correlation coefficient. Let a = 0.01. The critical value is. Therefore, there the maximum weight for which one repetit (Round to three decimal places as needer sufficient evidence at the 1% level of significance to conclude that between uat can be performed and time to run a 10-meter sprint. is not is The accompanying table shows the maximum weights (in kilograms) for which one repetition of a half squat can be performed and the times (in seconds) to run a 10-meter sprint for 12 international soccer players. Complete parts (a) through (d) below. Click here to view the data table. Click here to view the table of critical values for the Pearson correlation coefficient. (a) Display the data in a scatter plot. Choose the correct graph below. OA. В. OC. OD. 2.4- 220- 220어 2.4- 2.2- 2.2- 2.0- 1.8- 1.6- 1.4 200어 200- 2.0어 1.8- ..* 1,6- 180- 180- 160- 160- 1.4+ 140 Max Weight (kg) 140- 1.4 Max Weight (kg) 140- 1.4 220 2.4 2.4 140 220 Max Weight (kg) Max Weight (kg) (b) Calculate the sample correlation coefficient r. (Round to three decimal places as needed.) (c) Describe the type of correlation, if any, and interpret the correlation in the context of the data. There is linear correlation. Interpret the correlation. Choose the correct answer below. O A. Increases in the maximum weight for which one repetition of a half squat can be performed cause time to run a 10-meter sprint to increase. O B. As the maximum weight for which one repetition of a half squat can be performed increases, time to run a 10-meter sprint tends to increase. O C. As the maximum weight for which one repetition of a half squat can be performed increases, time to run a 10-meter sprint tends to decrease. O D. Based on the correlation, there does not appear to be any relationship between the maximum weight for which one repetition of a half squat can be performed and time to run a 10-meter sprint. O E. Based on the correlation, there does not appear to be a linear relationship between the maximum weight for which one repetition of a half squat can be performed and time to run a 10-meter sprint. O F. Increases in the maximum weight for which one repetition of a half squat can be performed cause time to run a 10-meter sprint to decrease. (d) Use the table of critical values for the Pearson correlation coefficient to make a conclusion about the correlation coefficient. Let a = 0.01. The critical value is Therefore, there V sufficient evidence at the 1% level of significance to conclude that between the maximum weight for which one repetition of a half squat can be performed and time to run a 10-meter sprint. (Round to three decimal places as needed.) there is no correlation there is a significant linear correlation Time (seconds) Time (seconds) Time (seconds) Time (seconds) The accompanying table shows the maximum weights (in kilograms) for which one repetition of a half squat can be performed and the times (in seconds) to run a 10-meter sprint for 12 international soccer players. Complete parts (a) through (d) below. Click here to view the data table. Click here to view the table of critical values for the Pearson correlation coefficient. (a) Display the data in a scatter plot. Choose the correct graph below. O A. В. С. D. 2.4- 2.2- 2.0- 1.8- 2.4- 220- 220 2.2- 200- 200- 2.0- 180- 180- 1.8- .* 160- 160- 1.6- 1.4 140 Max Weight (kg) 1.6- 1.4 140 Max Weight (kg) 140- 1.4 140+ 1.4 220 2.4 Max Weight (kg) 2.4 220 Max Weight (kg) (b) Calculate the sample correlation coefficient r. (Round to three decimal places as needed.) (c) Describe the type of correlation, if any, and interpret the correlation in the context of the data. There is V linear correlation. Interprett correct answer below, a perfect positive O A. In eight for which one repetition of a half squat can be performed cause time to run a 10-meter sprint to increase. no О В. А vhich one repetition of a half squat can be performed increases, time to run a 10-meter sprint tends to increase. a strong negative ОС. А vhich one repetition of a half squat can be performed increases, time to run a 10-meter sprint tends to decrease. a weak positive O D. B re does not appear to be any relationship between the maximum weight for which one repetition of a half squat can be 10-meter sprint. pe a weak negative ОЕ. В re does not appear to be a linear relationship between the maximum weight for which one repetition of a half squat can be 10-meter sprint. a perfect negative pi a strong positive O F. In eight for which one repetition of a half squat can be performed cause time to run a 10-meter sprint to decrease. (d) Use the table of critical values for the Pearson correlation coefficient to make a conclusion about the correlation coefficient. Let a = 0.01. The critical value is. Therefore, there sufficient evidence at the 1% level of significance to conclude that V between the maximum weight for which one repetition of a half squat can be performed and time to run a 10-meter sprint. (Round to three decimal places as needed.) The accompanying table shows the maximum weights (in kilograms) for which one repetition of a half squat can be performed and the times (in seconds) to run a 10-meter sprint for 12 international soccer players. Complete parts (a) through (d) below. Click here to view the data table. Click here to view the table critical values for the Pearson correlation coefficient. (a) Display the data in a scatter plot. Choose the correct graph below. O A. В. OC. OD. 220 2.4- 2.2- 2.0- 220- 2.4- 2.2- 2.0- 1.8- 1.6- 1.4 140 Max Weight (kg) 200- 200- 180- 180- 1.8- .* 1.6-. 160- 160- 1.4+ 140 Max Weight (kg) 140- 1.4 140- 1.4 220 2.4 220 2.4 Max Weight (kg) Max Weight (kg) (b) Calculate the sample correlation coefficient r. (Round to three decimal places as needed.) (c) Describe the type of correlation, if any, and interpret the correlation in the context of the data. There is linear correlation. Interpret the correlation. Choose the correct answer below. O A. Increases in the maximum weight for which one repetition of a half squat can be performed cause time to run a 10-meter sprint to increase. O B. As the maximum weight for which one repetition of a half squat can be performed increases, time to run a 10-meter sprint tends to increase. O C. As the maximum weight for which one repetition of a half squat can be performed increases, time to run a 10-meter sprint tends to decrease. O D. Based on the correlation, there does not appear to be any relationship between the maximum weight for which one repetition of a half squat can be performed and time to run a 10-meter sprint. O E. Based on the correlation, there does not appear to be a linear relationship between the maximum weight for which one repetition of a half squat can be performed and time to run a 10-meter sprint. O F. Increases in the maximum weight for which one repetition of a half squat can be performed cause time to run a 10-meter sprint to decrease. (d) Use the table of critical values for the Pearson correlation coefficient to make a conclusion about the correlation coefficient. Let a = 0.01. The critical value is. Therefore, there the maximum weight for which one repetit (Round to three decimal places as needer sufficient evidence at the 1% level of significance to conclude that between uat can be performed and time to run a 10-meter sprint. is not is The accompanying table shows the maximum weights (in kilograms) for which one repetition of a half squat can be performed and the times (in seconds) to run a 10-meter sprint for 12 international soccer players. Complete parts (a) through (d) below. Click here to view the data table. Click here to view the table of critical values for the Pearson correlation coefficient. (a) Display the data in a scatter plot. Choose the correct graph below. OA. В. OC. OD. 2.4- 220- 220어 2.4- 2.2- 2.2- 2.0- 1.8- 1.6- 1.4 200어 200- 2.0어 1.8- ..* 1,6- 180- 180- 160- 160- 1.4+ 140 Max Weight (kg) 140- 1.4 Max Weight (kg) 140- 1.4 220 2.4 2.4 140 220 Max Weight (kg) Max Weight (kg) (b) Calculate the sample correlation coefficient r. (Round to three decimal places as needed.) (c) Describe the type of correlation, if any, and interpret the correlation in the context of the data. There is linear correlation. Interpret the correlation. Choose the correct answer below. O A. Increases in the maximum weight for which one repetition of a half squat can be performed cause time to run a 10-meter sprint to increase. O B. As the maximum weight for which one repetition of a half squat can be performed increases, time to run a 10-meter sprint tends to increase. O C. As the maximum weight for which one repetition of a half squat can be performed increases, time to run a 10-meter sprint tends to decrease. O D. Based on the correlation, there does not appear to be any relationship between the maximum weight for which one repetition of a half squat can be performed and time to run a 10-meter sprint. O E. Based on the correlation, there does not appear to be a linear relationship between the maximum weight for which one repetition of a half squat can be performed and time to run a 10-meter sprint. O F. Increases in the maximum weight for which one repetition of a half squat can be performed cause time to run a 10-meter sprint to decrease. (d) Use the table of critical values for the Pearson correlation coefficient to make a conclusion about the correlation coefficient. Let a = 0.01. The critical value is Therefore, there V sufficient evidence at the 1% level of significance to conclude that between the maximum weight for which one repetition of a half squat can be performed and time to run a 10-meter sprint. (Round to three decimal places as needed.) there is no correlation there is a significant linear correlation Time (seconds) Time (seconds) Time (seconds) Time (seconds)
Expert Answer:

Related Book For 

Posted Date:
Students also viewed these mathematics questions
-
The maximum weights (in kilograms) for which one repetition of a half squat can be performed and the times (in seconds) to run a 10-meter sprint for 12 international soccer players (a) Display the...
-
The maximum weights (in kilograms) for which one repetition of a half squat can be performed and the jump heights (in centimeters) for 12 international soccer players (a) Display the data in a...
-
The accompanying table shows Tanisha's and Ari's individual marginal benefit of different amounts of street cleanings per month. Suppose that the marginal cost of street cleanings is constant at $9...
-
In Exercises use the differential equation and the specified initial condition to find y. dy dx || 1 4 - x y(0) = -
-
Using the data in the file Macro2010 develop an autoregressive model for the Personal Consumption Expenditures. First, use the data for the period 1980, first quarter, through 2000, fourth quarter,...
-
Bell Entertainment sponsors rock concerts. The company is considering a contract to hire a band at a cost of $84,000 per concert. Required a. What are the total band cost and the cost per person if...
-
Colin Agee, chairperson of the board of directors and chief executive officer of Image, Inc., is pondering a recommendation to make to the firm's board of directors in response to actions taken by...
-
A radioactive material of thermal conductivity k is cast as a solid sphere of radius ro and placed in a liquid bath for which the temperature T and convection coefficient h are known. Heat is...
-
the marine division of pacific corporation has average invested assets of $100,000,000 sales revenue of $50,240,000 results in net operating income of $9,965,000. the hurdle rate is 5%. what is the...
-
The July transactions of Acorn Industries are described in Problem 7-2B. Problem 7-2B, Acorn Industries completes these transactions during July of the current year (the terms of all its credit sales...
-
The segments AB and BC of the bent bar have the same flexural rigidity EI. Find the horizontal component of EIS at end C. C 2 m B 60 KN 3 m FIG. P6.109 A
-
6. You have a lot of time to think while rolling along at 35 mph on a 32km dirt road. Meanwhile your friends decide to continue driving at 45mph. How much sooner will they arrive at the destination?
-
Japan, the world's third largest economy, has been experiencing the issue of population aging to an unprecedented degree. More than 20 percent of Japan's population is over 65 years old, the highest...
-
Background It is 1960. Under CTP's guidance, EP has become a major worldwide star. In fact, he is the biggest star in the western world. Any impartial person must admit that CTP is a marketing and...
-
A boy twirls a 1.8 kg toy airplane on a string. The radius of the circle is 68 cm and the speed of the plane is 4.1 m/s. One of the wings (mass of wing = 0.5 kg) suddenly breaks off, but the boy...
-
Find the average rate of change for f(x) = 10x+x a) From x = 1 to x=2 b) from [4, 4+h]
-
Required Information Robert Products Incorporated consists of three decentralized divisions: Bayside Division, Cole Division, and Diamond Division. The president of Robert Products has given the...
-
What do you think?
-
Assume that the marginal cost of production is increasing. Can you determine whether the average variable cost is increasing or decreasing? Explain.
-
What is meant by deadweight loss? Why does a price ceiling usually result in a deadweight loss?
-
A vegetable fiber is traded in a competitive world market, and the world price is $9 per pound. Unlimited quantities are available for import into the United States at this price. The U.S. domestic...
-
Ifa firm wishes to compare the performance of two divisions, why might divisional operating income be a poor basis for comparison?
-
Distinguish between traceable expenses and common expenses. Which are more likely to be controllable at the department level?
-
What is meant by departmental contribution to common expenses? What advantages does this measure have over net income in measuring departmental performance?

Study smarter with the SolutionInn App