

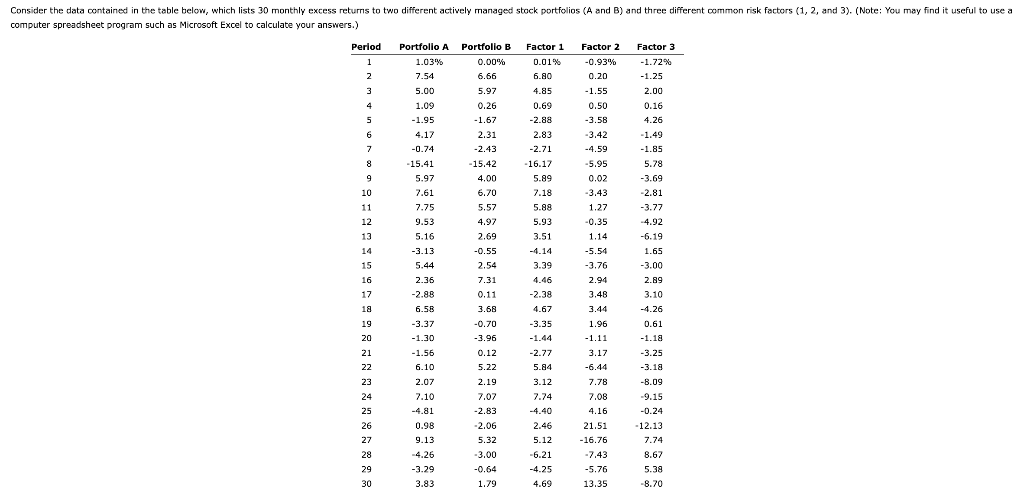
Consider the data contained in the table below, which lists 30 monthly excess returns to two...
Fantastic news! We've Found the answer you've been seeking!
Question:
Transcribed Image Text:
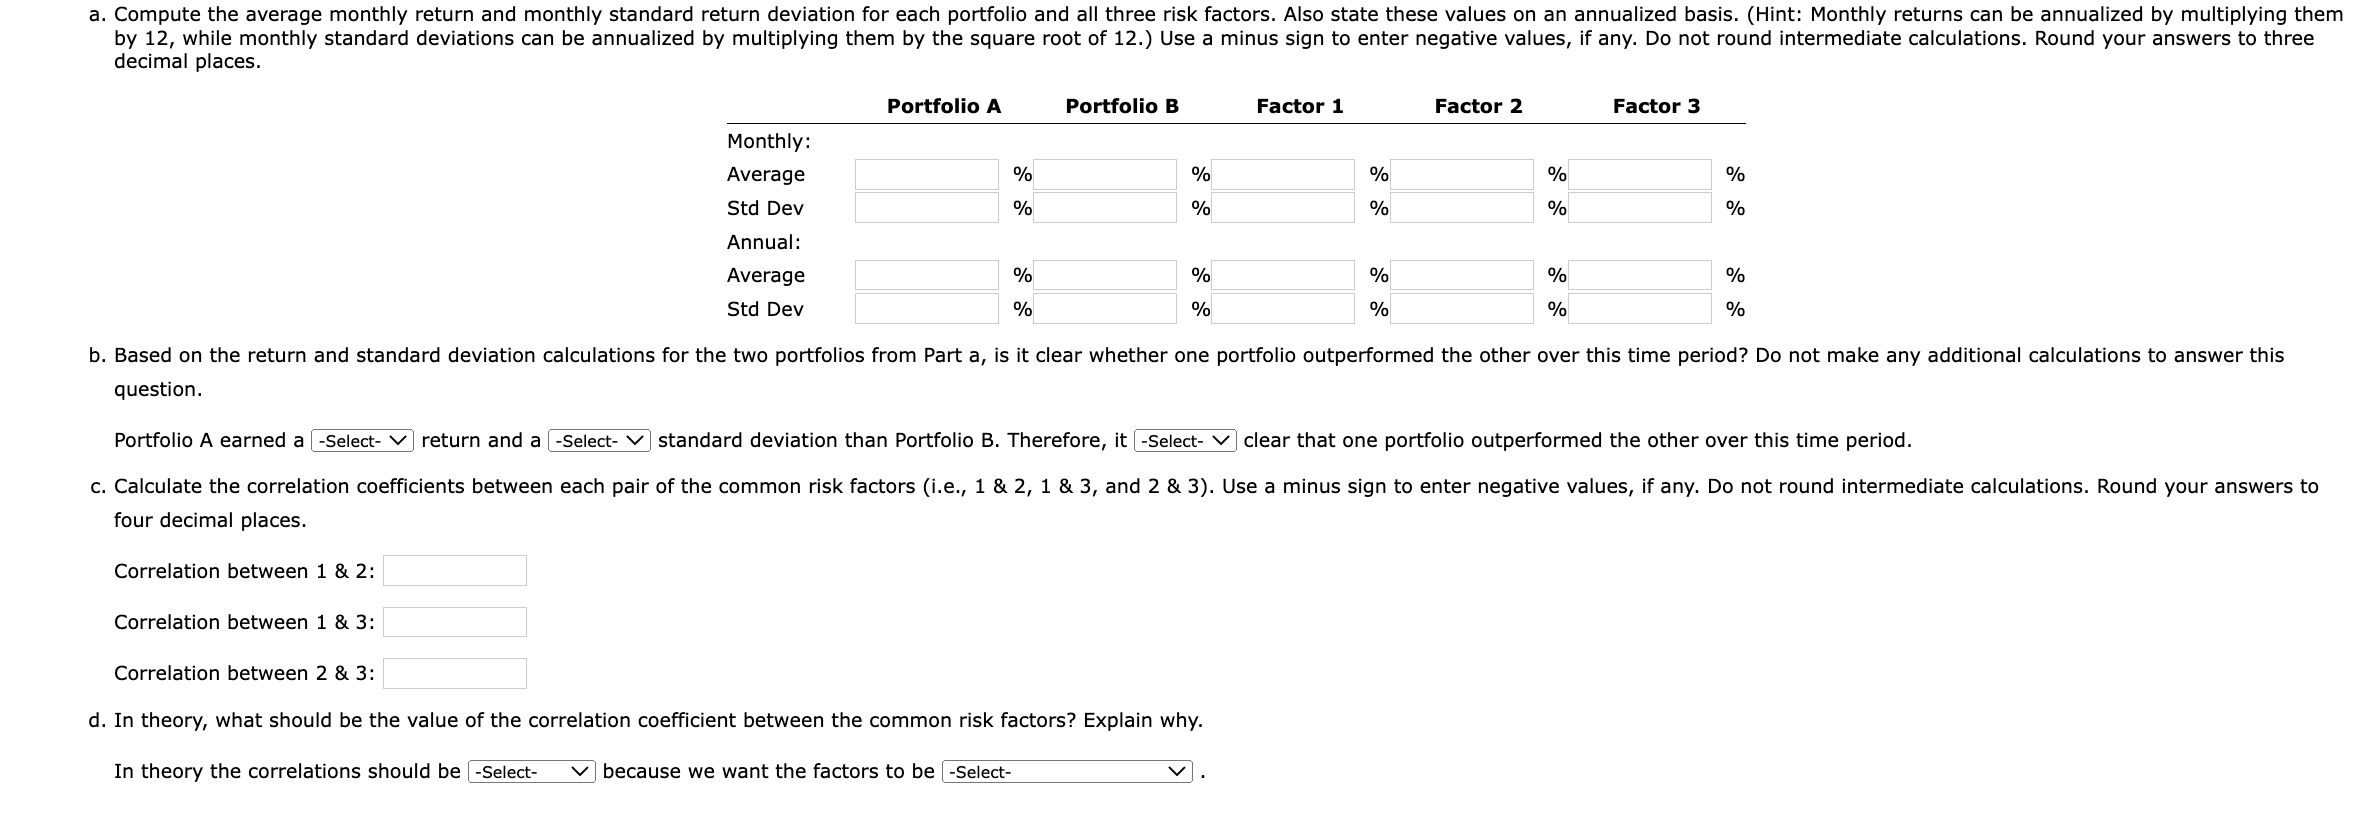
Consider the data contained in the table below, which lists 30 monthly excess returns to two different actively managed stock portfolios (A and B) and three different common risk factors (1, 2, and 3). (Note: You may find it useful to use a computer spreadsheet program such as Microsoft Excel to calculate your answers.) Period 1 2 3 4 5 6 7 8 9 10 11 12 13 14 15 16 17 18 19 20 21 22 23 24 25 26 27 28 29 30 Portfolio A 1.03% 7.54 5.00 1.09 -1.95 4.17 -0.74 -15.41 5.97 7.61 7.75 9.53 5.16 -3.13 5.44 2.36 -2.88 6.58 -3.37 -1.30 -1.56 6.10 2.07 7.10 -4.81 0.98 9.13 -4.26 -3.29 3.83 Portfolio B 0.00% 6.66 5.97 0.26 -1.67 2.31 -2.43 -15.42 4.00 6.70 5.57 4.97 2.69 -0.55 2.54 7.31 0.11 3.68 -0.70 -3.96 0.12 5.22 2.19 7.07 -2.83 -2.06 5.32 -3.00 -0.64 1.79 Factor 1 0.01% 6.80 4.85 0.69 -2.88 2.83 -2.71 16.17 5.89 7.18 5.88 5.93 3.51 -4.14 3.39 4.46 -2.38 4.67 -3.35 -1.44 -2.77 5.84 3.12 7.74 -4.40 2.46 5.12 -6.21 -4.25 4.69 Factor 2 -0.93% 0.20 -1.55 0.50 -3.58 -3.42 -4.59 -5.95 0.02 -3.43 1.27 -0.35 1.14 -5.54 -3.76 2.94 3.48 3.44 1.96 -1.11 3.17 -6.44 7.78 7.08 4.16 21.51 -16.76 -7.43 -5.76 13.35 Factor 3 -1.72% -1.25 2.00 0.16 4.26 -1.49 -1.85 5.78 -3.69 -2.81 -3.77 -4.92 -6.19 1.65 -3.00 2.89 3.10 -4.26 0.61 -1.18 -3.25 -3.18 -8.09 -9.15 -0.24 -12.13 7.74 8.67 5.38 -8.70 a. Compute the average monthly return and monthly standard return deviation for each portfolio and all three risk factors. Also state these values on an annualized basis. (Hint: Monthly returns can be annualized by multiplying them by 12, while monthly standard deviations can be annualized by multiplying them by the square root of 12.) Use a minus sign to enter negative values, if any. Do not round intermediate calculations. Round your answers to three decimal places. Correlation between 1 & 2: Monthly: Average Std Dev Annual: Average Std Dev Correlation between 1 & 3: Portfolio A Correlation between 2 & 3: % % % % Portfolio B % % % % Factor 1 % % d. In theory, what should be the value of the correlation coefficient between the common risk factors? Explain why. In theory the correlations should be -Select- ✓ because we want the factors to be -Select- % % Factor 2 % % % % b. Based on the return and standard deviation calculations for the two portfolios from Part a, is it clear whether one portfolio outperformed the other over this time period? Do not make any additional calculations to answer this question. Factor 3 Portfolio A earned a -Select- ✓ return and a [-Select- ✓ standard deviation than Portfolio B. Therefore, it -Select- clear that one portfolio outperformed the other over this time period. c. Calculate the correlation coefficients between each pair of the common risk factors (i.e., 1 & 2, 1 & 3, and 2 & 3). Use a minus sign to enter negative values, if any. Do not round intermediate calculations. Round your answers to four decimal places. % % % % Consider the data contained in the table below, which lists 30 monthly excess returns to two different actively managed stock portfolios (A and B) and three different common risk factors (1, 2, and 3). (Note: You may find it useful to use a computer spreadsheet program such as Microsoft Excel to calculate your answers.) Period 1 2 3 4 5 6 7 8 9 10 11 12 13 14 15 16 17 18 19 20 21 22 23 24 25 26 27 28 29 30 Portfolio A 1.03% 7.54 5.00 1.09 -1.95 4.17 -0.74 -15.41 5.97 7.61 7.75 9.53 5.16 -3.13 5.44 2.36 -2.88 6.58 -3.37 -1.30 -1.56 6.10 2.07 7.10 -4.81 0.98 9.13 -4.26 -3.29 3.83 Portfolio B 0.00% 6.66 5.97 0.26 -1.67 2.31 -2.43 -15.42 4.00 6.70 5.57 4.97 2.69 -0.55 2.54 7.31 0.11 3.68 -0.70 -3.96 0.12 5.22 2.19 7.07 -2.83 -2.06 5.32 -3.00 -0.64 1.79 Factor 1 0.01% 6.80 4.85 0.69 -2.88 2.83 -2.71 16.17 5.89 7.18 5.88 5.93 3.51 -4.14 3.39 4.46 -2.38 4.67 -3.35 -1.44 -2.77 5.84 3.12 7.74 -4.40 2.46 5.12 -6.21 -4.25 4.69 Factor 2 -0.93% 0.20 -1.55 0.50 -3.58 -3.42 -4.59 -5.95 0.02 -3.43 1.27 -0.35 1.14 -5.54 -3.76 2.94 3.48 3.44 1.96 -1.11 3.17 -6.44 7.78 7.08 4.16 21.51 -16.76 -7.43 -5.76 13.35 Factor 3 -1.72% -1.25 2.00 0.16 4.26 -1.49 -1.85 5.78 -3.69 -2.81 -3.77 -4.92 -6.19 1.65 -3.00 2.89 3.10 -4.26 0.61 -1.18 -3.25 -3.18 -8.09 -9.15 -0.24 -12.13 7.74 8.67 5.38 -8.70 a. Compute the average monthly return and monthly standard return deviation for each portfolio and all three risk factors. Also state these values on an annualized basis. (Hint: Monthly returns can be annualized by multiplying them by 12, while monthly standard deviations can be annualized by multiplying them by the square root of 12.) Use a minus sign to enter negative values, if any. Do not round intermediate calculations. Round your answers to three decimal places. Correlation between 1 & 2: Monthly: Average Std Dev Annual: Average Std Dev Correlation between 1 & 3: Portfolio A Correlation between 2 & 3: % % % % Portfolio B % % % % Factor 1 % % d. In theory, what should be the value of the correlation coefficient between the common risk factors? Explain why. In theory the correlations should be -Select- ✓ because we want the factors to be -Select- % % Factor 2 % % % % b. Based on the return and standard deviation calculations for the two portfolios from Part a, is it clear whether one portfolio outperformed the other over this time period? Do not make any additional calculations to answer this question. Factor 3 Portfolio A earned a -Select- ✓ return and a [-Select- ✓ standard deviation than Portfolio B. Therefore, it -Select- clear that one portfolio outperformed the other over this time period. c. Calculate the correlation coefficients between each pair of the common risk factors (i.e., 1 & 2, 1 & 3, and 2 & 3). Use a minus sign to enter negative values, if any. Do not round intermediate calculations. Round your answers to four decimal places. % % % %
Expert Answer:

Related Book For 
Investment Analysis and Portfolio Management
ISBN: 978-0538482387
10th Edition
Authors: Frank K. Reilly, Keith C. Brown
Posted Date:
Students also viewed these finance questions
-
(20 points)Write a program that prompts the user to input five decimal numbers. The program should then add the five decimal numbers, convert the sum to the nearest integer, and print the result....
-
Nataro, Incorporated, has sales of $642,000, costs of $330,000, depreciation expense of $75,000, interest expense of $40,000, and a tax rate of 22 percent. What is the net income for this firm? A...
-
Lillian Jordon is considering using some of the cash generated from her mail-order business to open a retail store. The fixed investment in the store is expected to be $3.5 million. The investment...
-
A nutritionist at the Food and Drug Administration is studying the effects of cereal marketing on family meal choices. In particular, she would like to understand how cereal manufacturers market...
-
Ormond Co. acquired all of the outstanding common stock of Daytona Co. on January 1, 2014. Ormond Co. gave shares of its common stock with a fair value of $312 million in exchange for 100% of the...
-
Objective Function \(T=5 x+3 y\) Find the value of the objective function at each corner of the graphed region. (0, 4)- (0, 0) y (5, 7) (8,5) (10, 0) x
-
Construct a combined common-size and common-base year balance sheet for 2007. What will be the common-base year value for the 2007 net fixed assets? a. 0.89 b. 0.92 c. 1.12 d. 1.32 AHS INC. 2007...
-
Review the data from Great Fender given in Exercise E23- 19. Consider the following additional information: Static budget variable overhead........... $ 5,500 Static budget fixed overhead...
-
Perform the elementary row operation - 3R + R R on the given matrix. Write numbers as integers or simplified fractions. 3 1 4 14 2 12-3 Resulting matrix: A
-
Which series has the highest beta. BraveNewCoin Liquid Index for Bitcoin 1D BNC Trading Brave Ne Yellow Green Blue Orange
-
Consider an asset whose price follows a stochastic processdescribed by . Use Ito'sLemma to find the differential of . 1 answer
-
Peloton's business model is based on two main components, Connected Fitness Products (CFPs): Peloton Bike and Tread and subscriptions/users on their digital app and membership. Because of Peloton's...
-
Zenith Co . has two divisions: Processing & Assembly. The Processing Division manufactures auto frame panels then transfers the panels to the Assembly Division where the panels are assembled into...
-
By Thomson's time, it was known that excited atoms emit light waves of only certain frequencies. In his model, the frequency of emitted light is the same as the oscillation frequency of the electron...
-
8. Re-write the following expressions with positive exponents. Do not calculate. a) 4-2 1 b) 5-3 3 c) 7
-
The investment banking community has recently been the object of scorn, both on the regulatory front and in the press. Critics have alleged a distinct lack of independence in banks' behaviour and...
-
Discuss what percent of personality you think is nature and what percent you think is nurture. I don't want you to just come up with two numbers.What I am most interested in is your explanation of...
-
Feller Company purchased a site for a limestone quarry for $100,000 on January 2, 2019. It estimate that the quarry will yield 400,000 tons of limestone. It estimates that its retirement obligation...
-
When examining a firm's financial structure, would you be concerned with the firm's business risk? Why or why not?
-
Consider Commodity Z, which has both exchange-traded futures and option contracts associated with it. As you look in todays paper, you find the following put and call prices for options that expire...
-
The current rate of inflation is 3 percent, and long-term Treasury bonds are yielding 7 percent. You estimate that the rate of inflation will increase to 6 percent. What do you expect to happen to...
-
Visit SunGards web site, http://www.sungard.com, and research its recovery services offered for the following classes: High Availability, System Recovery, and End-User Recover. Write a report of your...
-
Micro Systems, a developer of database software packages, is a publicly held company and listed with the SEC. The company has no internal audit function. In complying with SOX, Micro Systems has...
-
Leigh Industries has an internal audit department consisting of a director and four staff auditors. The director of internal audit, Diane Bauer, reports to the corporate controller, who receives...

Study smarter with the SolutionInn App