

Discuss the correlation coefficients of these five stocks and the betas of these five stocks. Are the
Fantastic news! We've Found the answer you've been seeking!
Question:
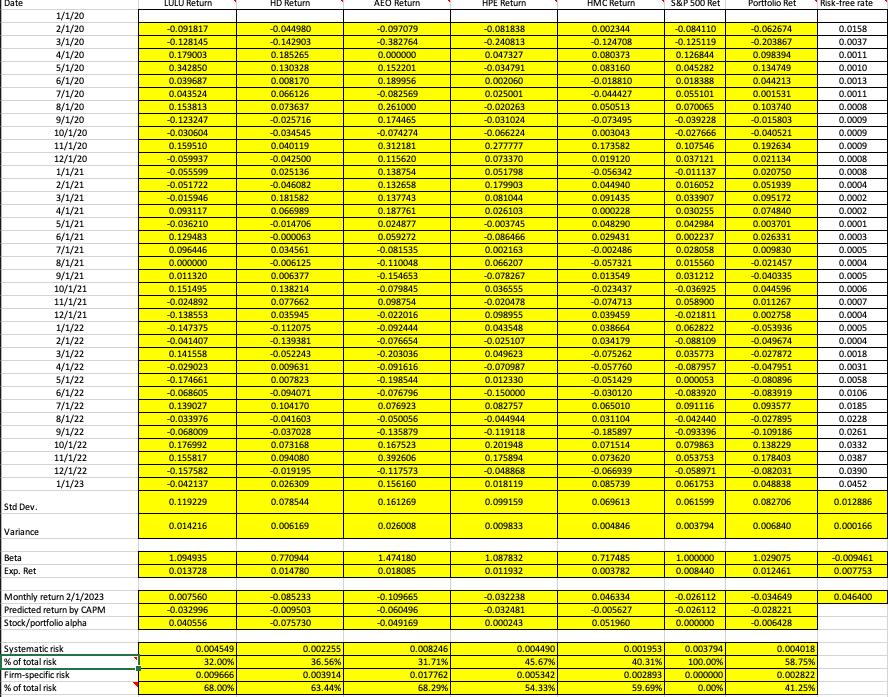
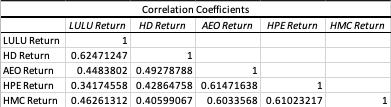
Discuss the correlation coefficients of these five stocks and the betas of these five stocks. Are the beta estimates consistent with your expectation of cyclical stocks or defensive stocks?
2. Is the firm-specific risk (as a percentage of total risk) in your 5-security portfolio lower than that of an individual stock? What does that imply?
3. Review your stock and portfolio alphas. Please discuss which stocks are overvalued or undervalued and justify your reasoning.
Thank you for all of your help!
Expert Answer:
To discuss the correlation coefficients and betas of the five stocks lets first define what these terms mean Correlation coefficient The correlation coefficient measures the strength and direction of ... View the full answer

Related Book For 

Fundamentals of Financial Management
ISBN: 978-0324664553
Concise 6th Edition
Authors: Eugene F. Brigham, Joel F. Houston
Posted Date:
