

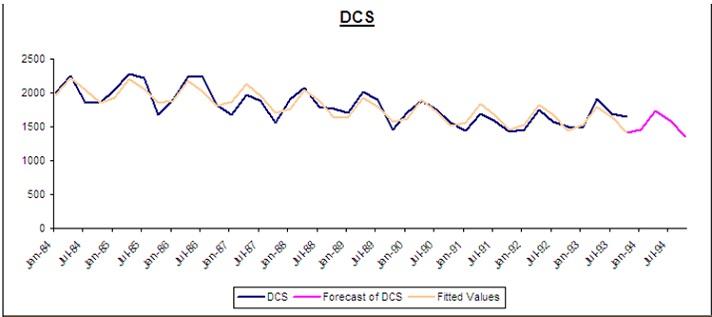
Consider the following multiple regression model of domestic car sales (DCS) where: DCS = domestic car sales
Fantastic news! We've Found the answer you've been seeking!
Question:
Consider the following multiple regression model of domestic car sales (DCS) where:
DCS = domestic car sales
DCSP = domestic car sales price (in dollars)
PR = prime rate as a percent (i.e., 10% would be entered as 10)
Q2 = quarter 2 dummy variable
Q3 = quarter 3 dummy variable
Q4 = quarter 4 dummy variable
Multiple Regression — Result Formula
DCS = 3,266.66 + ((DCSP) × −0.098297) + ((PR) × −21.17) + ((Q2) × 292.88) + ((Q3) × 149.07) + ((Q4) × −60.25)
| Audit Trail — ANOVA Table (Multiple Regression Selected) | |||||||||||||
| Source of variation | SS | df | MS | SEE | |||||||||
| Regression | 1,834,180.23 | 5 | 366,836.05 | ||||||||||
| Error | 494,506.47 | 34 | 14,544.31 | 120.60 | |||||||||
| Total | 2,328,686.70 | 39 | |||||||||||
| Audit Trail — Coefficient Table (Multiple Regression Selected) | |||||||||||||||||||||||||
| Series Description | Included in Model | Coefficient | Standard Error | T-test | P-value | F-test | Elasticity | Overall F-test | |||||||||||||||||
| DCS | Dependent | 3,266.66 | 288.10 | 11.34 | 0.00 | 128.56 | 25.22 | ||||||||||||||||||
| DCSP | Yes | −0.10 | 0.01 | −7.18 | 0.00 | 51.50 | −0.76 | ||||||||||||||||||
| PR | Yes | −21.17 | 13.77 | −1.54 | 0.13 | 2.36 | −0.11 | ||||||||||||||||||
| Q2 | Yes | 292.88 | 54.02 | 5.42 | 0.00 | 29.39 | 0.04 | ||||||||||||||||||
| Q3 | Yes | 149.07 | 54.11 | 2.76 | 0.01 | 7.59 | 0.02 | ||||||||||||||||||
| Q4 | Yes | −60.25 | 54.22 | −1.11 | 0.27 | 1.23 | −0.01 | ||||||||||||||||||
| Audit Trail - Statistics | |||||||
| Accuracy Measures | Value | Forecast Statistics | Value | ||||
| AIC | 492.41 | Durbin Watson | 1.62 | ||||
| BIC | 494.10 | Mean | 1,802.86 | ||||
| Mean Absolute Percentage Error (MAPE) | 5.30 | % | Standard Deviation | 244.36 | |||
| R-Square | 78.76 | % | Max | 2,272.60 | |||
| Adjusted R-Square | 75.64 | % | Min | 1,421.30 | |||
| Root Mean Square Error | 111.19 | Range | 851.30 | ||||
For the domestic car sales regression above, the "third quick check" shows what (i.e., accuracy)?
Expert Answer:

Related Book For 
Statistics for the Behavioral Sciences
ISBN: 978-1111830991
9th edition
Authors: Frederick J Gravetter, Larry B. Wallnau
Posted Date:
