Estimate the income elasticity of revenue for the motor vehicle fuel tax and evaluate the long run
Fantastic news! We've Found the answer you've been seeking!
Question:
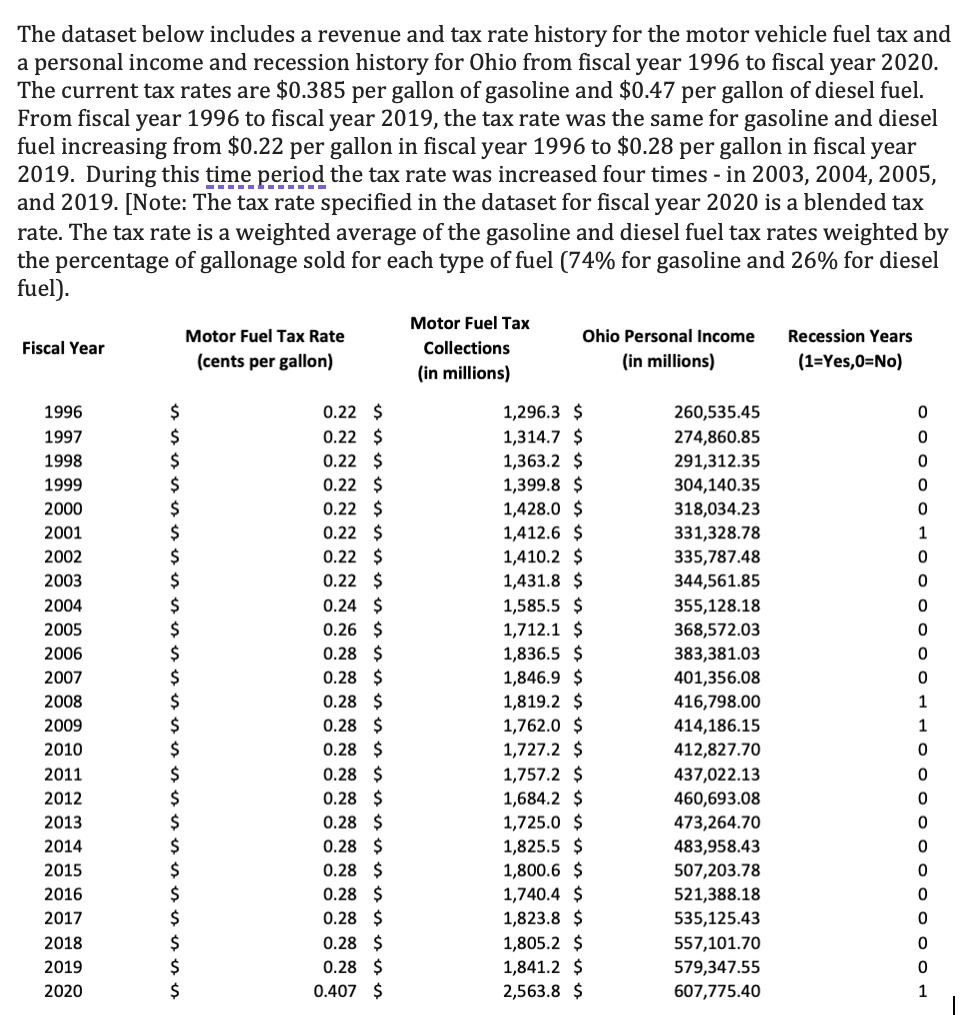
Estimate the income elasticity of revenue for the motor vehicle fuel tax and evaluate the long run growth potential of the tax.
Examine the years when the motor vehicle fuel tax rate was increased and estimate the tax rate elasticity of motor fuel tax revenue. Provide an interpretation the tax rate elasticities you compute.
Transcribed Image Text:
The dataset below includes a revenue and tax rate history for the motor vehicle fuel tax and a personal income and recession history for Ohio from fiscal year 1996 to fiscal year 2020. The current tax rates are $0.385 per gallon of gasoline and $0.47 per gallon of diesel fuel. From fiscal year 1996 to fiscal year 2019, the tax rate was the same for gasoline and diesel fuel increasing from $0.22 per gallon in fiscal year 1996 to $0.28 per gallon in fiscal year 2019. During this time period the tax rate was increased four times - in 2003, 2004, 2005, and 2019. [Note: The tax rate specified in the dataset for fiscal year 2020 is a blended tax rate. The tax rate is a weighted average of the gasoline and diesel fuel tax rates weighted by the percentage of gallonage sold for each type of fuel (74% for gasoline and 26% for diesel fuel). Fiscal Year 1996 1997 1998 1999 2000 2001 2002 2003 2004 2005 2006 2007 2008 2009 2010 2011 2012 2013 2014 2015 2016 2017 2018 2019 2020 $ $ $ $ $ $ $ $ $ $ $ $ $ $ $ $ Motor Fuel Tax Rate (cents per gallon) 0.22 $ 0.22 $ 0.22 $ 0.22 $ 0.22 $ 0.22 $ 0.22 $ 0.22 $ 0.24 $ 0.26 $ 0.28 $ 0.28 $ 0.28 $ 0.28 $ 0.28 $ 0.28 $ 0.28 $ 0.28 $ 0.28 $ 0.28 $ 0.28 $ 0.28 $ 0.28 $ 0.28 $ 0.407 $ Motor Fuel Tax Collections (in millions) 1,296.3 $ 1,314.7 $ 1,363.2 $ 1,399.8 $ 1,428.0 $ Ohio Personal Income Recession Years (in millions) (1=Yes,0=No) 1,412.6 $ 1,410.2 $ 1,431.8 $ 1,585.5 $ 1,712.1 $ 1,836.5 $ 1,846.9 $ 1,819.2 $ 1,762.0 $ 1,727.2 $ 1,757.2 $ 1,684.2 $ 1,725.0 $ 1,825.5 $ 1,800.6 $ 1,740.4 $ 1,823.8 $ 1,805.2 $ 1,841.2 $ 2,563.8 $ 260,535.45 274,860.85 291,312.35 304,140.35 318,034.23 331,328.78 335,787.48 344,561.85 355,128.18 368,572.03 383,381.03 401,356.08 416,798.00 414,186.15 412,827.70 437,022.13 460,693.08 473,264.70 483,958.43 507,203.78 521,388.18 535,125.43 557,101.70 579,347.55 607,775.40 0 0 0 0 0 1 0 0 0 0 0 0 1 1 0 0 0 0 0 0 0 0 0 0 1 I The dataset below includes a revenue and tax rate history for the motor vehicle fuel tax and a personal income and recession history for Ohio from fiscal year 1996 to fiscal year 2020. The current tax rates are $0.385 per gallon of gasoline and $0.47 per gallon of diesel fuel. From fiscal year 1996 to fiscal year 2019, the tax rate was the same for gasoline and diesel fuel increasing from $0.22 per gallon in fiscal year 1996 to $0.28 per gallon in fiscal year 2019. During this time period the tax rate was increased four times - in 2003, 2004, 2005, and 2019. [Note: The tax rate specified in the dataset for fiscal year 2020 is a blended tax rate. The tax rate is a weighted average of the gasoline and diesel fuel tax rates weighted by the percentage of gallonage sold for each type of fuel (74% for gasoline and 26% for diesel fuel). Fiscal Year 1996 1997 1998 1999 2000 2001 2002 2003 2004 2005 2006 2007 2008 2009 2010 2011 2012 2013 2014 2015 2016 2017 2018 2019 2020 $ $ $ $ $ $ $ $ $ $ $ $ $ $ $ $ Motor Fuel Tax Rate (cents per gallon) 0.22 $ 0.22 $ 0.22 $ 0.22 $ 0.22 $ 0.22 $ 0.22 $ 0.22 $ 0.24 $ 0.26 $ 0.28 $ 0.28 $ 0.28 $ 0.28 $ 0.28 $ 0.28 $ 0.28 $ 0.28 $ 0.28 $ 0.28 $ 0.28 $ 0.28 $ 0.28 $ 0.28 $ 0.407 $ Motor Fuel Tax Collections (in millions) 1,296.3 $ 1,314.7 $ 1,363.2 $ 1,399.8 $ 1,428.0 $ Ohio Personal Income Recession Years (in millions) (1=Yes,0=No) 1,412.6 $ 1,410.2 $ 1,431.8 $ 1,585.5 $ 1,712.1 $ 1,836.5 $ 1,846.9 $ 1,819.2 $ 1,762.0 $ 1,727.2 $ 1,757.2 $ 1,684.2 $ 1,725.0 $ 1,825.5 $ 1,800.6 $ 1,740.4 $ 1,823.8 $ 1,805.2 $ 1,841.2 $ 2,563.8 $ 260,535.45 274,860.85 291,312.35 304,140.35 318,034.23 331,328.78 335,787.48 344,561.85 355,128.18 368,572.03 383,381.03 401,356.08 416,798.00 414,186.15 412,827.70 437,022.13 460,693.08 473,264.70 483,958.43 507,203.78 521,388.18 535,125.43 557,101.70 579,347.55 607,775.40 0 0 0 0 0 1 0 0 0 0 0 0 1 1 0 0 0 0 0 0 0 0 0 0 1 I
Expert Answer:
Answer rating: 100% (QA)
Here are the steps to analyze the longrun growth potential of Ohios motor vehicle fuel tax 1 Estimat... View the full answer
Related Book For
Posted Date:
Students also viewed these finance questions
-
The income elasticity of turnips is 0.7. If consumers' incomes were to increase by 10%, what would be the percentage increase in the quantity of turnips consumed? Is turnip a normal good or an...
-
The income elasticity of demand for automobiles in the United States was estimated by a government agency to be between 2.5 and 3.9. a. What does this mean? b. If incomes rise by 10 percent, what...
-
The income elasticity of money demand is 2/3 and the interest elasticity of money demand is -0.1. Real income is expected to grow by 4.5% over the next year, and the real interest rate is expected to...
-
1. The Jarmon Company manufactures and sells a line of exclusive sportswear. Prepare a financial position as at 31st December 2022 from the following information. Account Receivable Long term loan...
-
Eskimo Pie Corporation markets a broad range of frozen treats, including its famous Eskimo Pie ice cream bars. The following items were taken from a recent income statement and balance sheet. In each...
-
How do you get the turtles current heading?
-
You are an internal auditor for the Military Industrial Company. You are presently preparing test transactions for the companys weekly payroll processing pro gram. Each input record to this program...
-
Holcomb Company reported these income statement data for a 2-year period. Holcomb Company uses a periodic inventory system. The inventories at January 1, 2013, and December 31, 2014, are correct....
-
I am doing research on Recommendation for Optimal Approach for Selecting Suppliers in Logistics and Transportation. Just need a detailed explanation if I could. Thanks
-
Reep Construction recently won a contract for the excavation and site preparation of a new rest area on the Pennsylvania Turnpike. In preparing his bid for the job, Bob Reep, founder and president of...
-
Q-1) Create a function that calculates the following mathematical expression and test with different values for "x" and "y" z=3x+ x2 + y + eln (x) D
-
Question 6 + Leisel had the following receipts, payments and other accounting data: RECEIPTS Sales Proceeds from Business Loan (31 October 2021) which is due for repayment on 31 October 2027 Subsidy...
-
As a U.S. exporter you have just sent an invoice for 600,000 Euros payable in 60 days. The current exchange rate is $1.07 per Euro. The 60-day forward rate is $0.99 per Euro. What is the value of the...
-
Sage Hill Company purchased a delivery truck (vehicles) on June 1 for $38,520, paying $18,600 cash and signing a 5%, two-month note for the remaining balance, interest to be paid at maturity. The...
-
Consider a 10 year bond with face value $1000. Pays 6% coupon semi annual and has a yeild to maruryity of 7%. How much would the approximate percentagechange in the price of bond if interest rate in...
-
Question: The following activities occur at Greenwich Corporation, a company that contracts out a temporary workforce to retailers to meet seasonal demand:Required:Classify each of the activities...
-
1. Teddy wants to evaluate the impact of a skills training intervention on participants. He collects baseline data of both treated and control group and recorded outcomes of 150 and 100 for the...
-
Express mass density in kg/m3 and weight density in lb/ft3. 1. Find the mass density of a chunk of rock of mass 215 g that displaces a volume of 75.0 cm3 of water. 2. A block of wood is 55.9 in. x...
-
As you may recall, Nancy Lerner is taking Professor Sterns economics course. She will take two examinations in the course, and her score for the course is the minimum of the scores that she gets on...
-
The demand curve for salted codfish is D (P) = 200 5P and the supply curve S (P) = 5P. (a) On the graph below, use blue ink to draw the demand curve and the supply curve. The equilibrium market...
-
(For this problem, you will want to use a calculator.) A developer would like to build an amusement park in the midst of the once-thriving city of Broken Axle, Michigan. In order to build this park,...
-
Determine the months in backlog using the work on hand spreadsheet. The companys revenues for the last 12 months were \($1,607,000\).
-
The construction company needs to lease an excavator. The company has the option to lease it with an operating lease or a capital lease with a present value of \($150,000\). Using the spreadsheet you...
-
The ACWP at the end of the second week for the project in Problem 10 is \($37,900\) Determine the CPI for the project. Data From Problem 11: 11. A project consists of six tasks. Task A is scheduled...
Study smarter with the SolutionInn App