

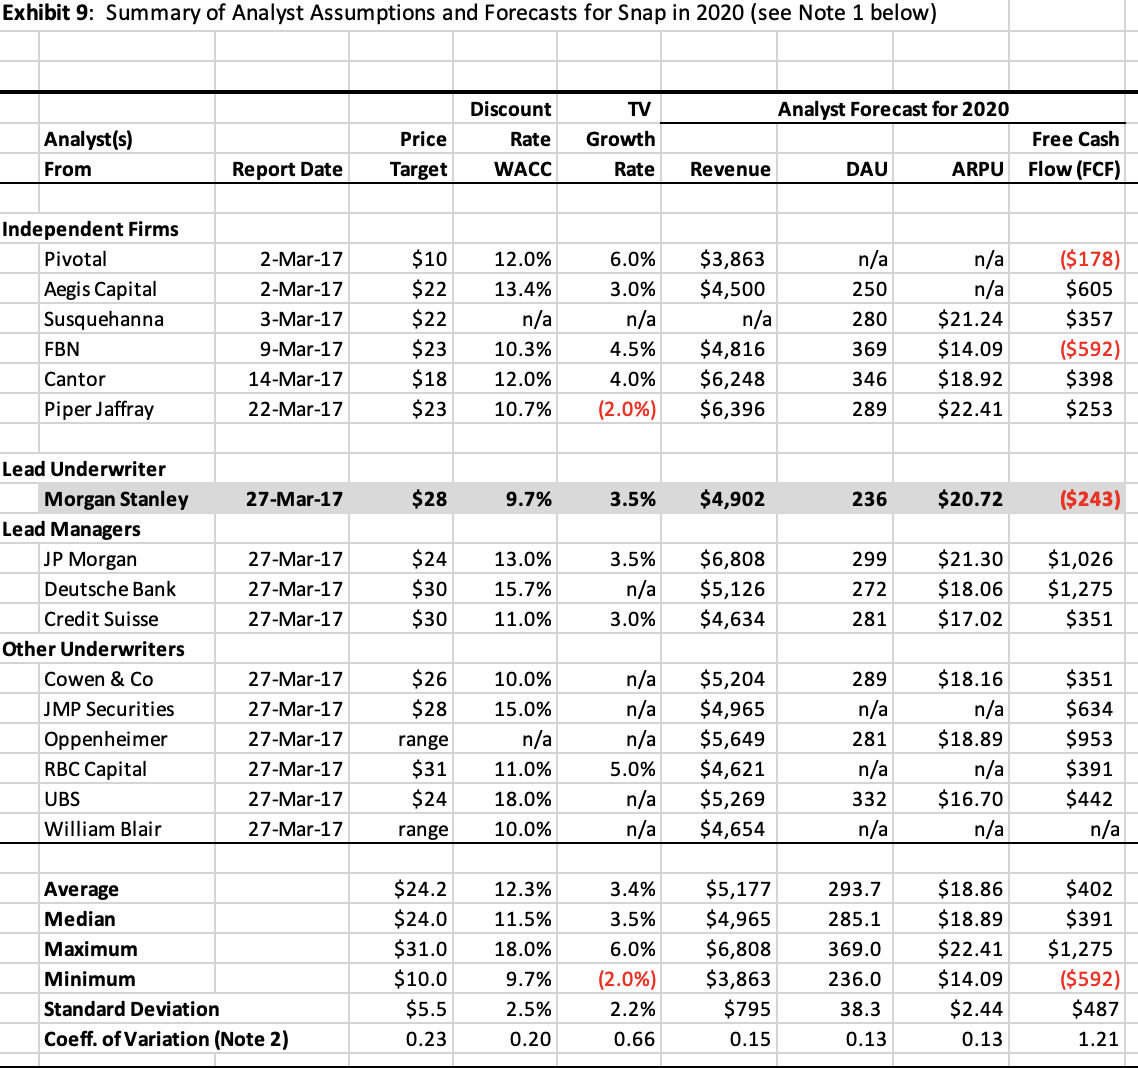
Exhibit 9: Summary of Analyst Assumptions and Forecasts for Snap in 2020 (see Note 1 below)...
Fantastic news! We've Found the answer you've been seeking!
Question:
Transcribed Image Text:
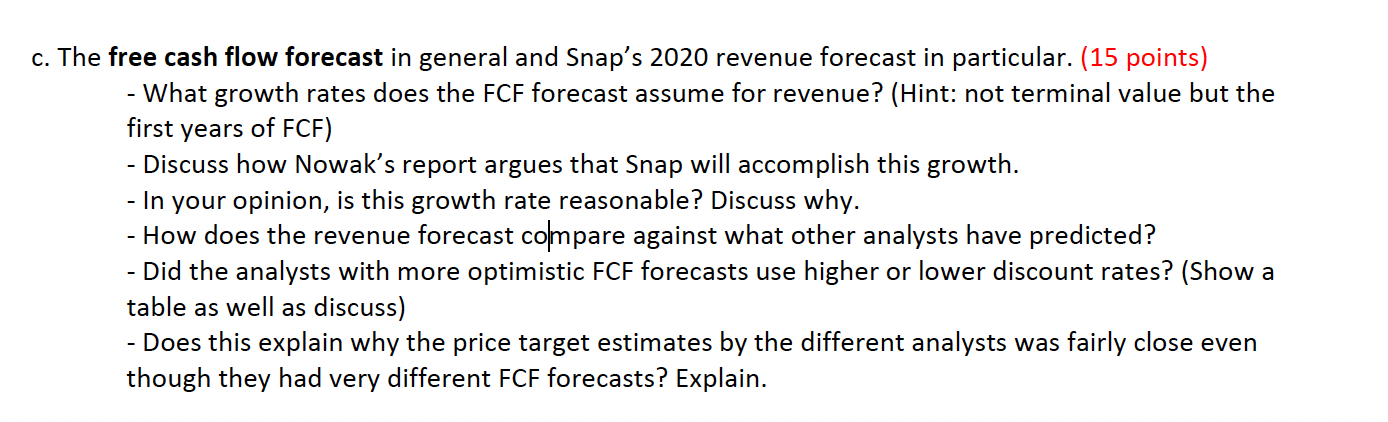
Exhibit 9: Summary of Analyst Assumptions and Forecasts for Snap in 2020 (see Note 1 below) Analyst (s) From Independent Firms Pivotal Aegis Capital Susquehanna FBN Cantor Piper Jaffray Lead Underwriter Morgan Stanley Lead Managers JP Morgan Deutsche Bank Credit Suisse Other Underwriters Cowen & Co JMP Securities Oppenheimer RBC Capital UBS William Blair Average Median Report Date 2-Mar-17 2-Mar-17 3-Mar-17 9-Mar-17 14-Mar-17 22-Mar-17 27-Mar-17 27-Mar-17 27-Mar-17 27-Mar-17 27-Mar-17 27-Mar-17 27-Mar-17 27-Mar-17 27-Mar-17 27-Mar-17 Maximum Minimum Standard Deviation Coeff. of Variation (Note 2) Price Target Discount Rate WACC $10 12.0% $22 13.4% $22 6.0% 3.0% n/a n/a $23 10.3% 4.5% $18 12.0% 4.0% $23 10.7% (2.0%) $28 9.7% $24 13.0% 15.7% $30 $30 11.0% $26 10.0% $28 15.0% range $31 $24 range n/a 11.0% 18.0% 10.0% TV Growth Rate $24.2 12.3% $24.0 11.5% $31.0 18.0% $10.0 9.7% $5.5 2.5% 0.23 0.20 3.5% 3.5% n/a 3.0% n/a n/a n/a 5.0% Revenue $3,863 $4,500 n/a $4,816 $6,248 $6,396 $4,902 $6,808 $5,126 $4,634 $5,204 $4,965 $5,649 $4,621 n/a $5,269 n/a $4,654 3.4% $5,177 3.5% $4,965 6.0% $6,808 (2.0%) $3,863 2.2% $795 0.66 0.15 Analyst Forecast for 2020 DAU n/a 250 280 369 346 289 289 n/a 281 n/a 332 n/a ARPU 236 $20.72 293.7 285.1 369.0 236.0 38.3 n/a n/a 0.13 $21.24 $14.09 $18.92 $22.41 299 $1,026 $21.30 272 $18.06 $1,275 281 $17.02 $351 $18.16 n/a $18.89 n/a $16.70 n/a $18.86 $18.89 Free Cash Flow (FCF) $22.41 $14.09 $2.44 0.13 ($178) $605 $357 ($592) $398 $253 ($243) $351 $634 $953 $391 $442 n/a $402 $391 $1,275 ($592) $487 1.21 c. The free cash flow forecast in general and Snap's 2020 revenue forecast in particular. (15 points) - What growth rates does the FCF forecast assume for revenue? (Hint: not terminal value but the first years of FCF) - Discuss how Nowak's report argues that Snap will accomplish this growth. - In your opinion, is this growth rate reasonable? Discuss why. How does the revenue forecast compare against what other analysts have predicted? - Did the analysts with more optimistic FCF forecasts use higher or lower discount rates? (Show a table as well as discuss) - Does this explain why the price target estimates by the different analysts was fairly close even though they had very different FCF forecasts? Explain. Exhibit 9: Summary of Analyst Assumptions and Forecasts for Snap in 2020 (see Note 1 below) Analyst (s) From Independent Firms Pivotal Aegis Capital Susquehanna FBN Cantor Piper Jaffray Lead Underwriter Morgan Stanley Lead Managers JP Morgan Deutsche Bank Credit Suisse Other Underwriters Cowen & Co JMP Securities Oppenheimer RBC Capital UBS William Blair Average Median Report Date 2-Mar-17 2-Mar-17 3-Mar-17 9-Mar-17 14-Mar-17 22-Mar-17 27-Mar-17 27-Mar-17 27-Mar-17 27-Mar-17 27-Mar-17 27-Mar-17 27-Mar-17 27-Mar-17 27-Mar-17 27-Mar-17 Maximum Minimum Standard Deviation Coeff. of Variation (Note 2) Price Target Discount Rate WACC $10 12.0% $22 13.4% $22 6.0% 3.0% n/a n/a $23 10.3% 4.5% $18 12.0% 4.0% $23 10.7% (2.0%) $28 9.7% $24 13.0% 15.7% $30 $30 11.0% $26 10.0% $28 15.0% range $31 $24 range n/a 11.0% 18.0% 10.0% TV Growth Rate $24.2 12.3% $24.0 11.5% $31.0 18.0% $10.0 9.7% $5.5 2.5% 0.23 0.20 3.5% 3.5% n/a 3.0% n/a n/a n/a 5.0% Revenue $3,863 $4,500 n/a $4,816 $6,248 $6,396 $4,902 $6,808 $5,126 $4,634 $5,204 $4,965 $5,649 $4,621 n/a $5,269 n/a $4,654 3.4% $5,177 3.5% $4,965 6.0% $6,808 (2.0%) $3,863 2.2% $795 0.66 0.15 Analyst Forecast for 2020 DAU n/a 250 280 369 346 289 289 n/a 281 n/a 332 n/a ARPU 236 $20.72 293.7 285.1 369.0 236.0 38.3 n/a n/a 0.13 $21.24 $14.09 $18.92 $22.41 299 $1,026 $21.30 272 $18.06 $1,275 281 $17.02 $351 $18.16 n/a $18.89 n/a $16.70 n/a $18.86 $18.89 Free Cash Flow (FCF) $22.41 $14.09 $2.44 0.13 ($178) $605 $357 ($592) $398 $253 ($243) $351 $634 $953 $391 $442 n/a $402 $391 $1,275 ($592) $487 1.21 Exhibit 9: Summary of Analyst Assumptions and Forecasts for Snap in 2020 (see Note 1 below) Analyst (s) From Independent Firms Pivotal Aegis Capital Susquehanna FBN Cantor Piper Jaffray Lead Underwriter Morgan Stanley Lead Managers JP Morgan Deutsche Bank Credit Suisse Other Underwriters Cowen & Co JMP Securities Oppenheimer RBC Capital UBS William Blair Average Median Report Date 2-Mar-17 2-Mar-17 3-Mar-17 9-Mar-17 14-Mar-17 22-Mar-17 27-Mar-17 27-Mar-17 27-Mar-17 27-Mar-17 27-Mar-17 27-Mar-17 27-Mar-17 27-Mar-17 27-Mar-17 27-Mar-17 Maximum Minimum Standard Deviation Coeff. of Variation (Note 2) Price Target Discount Rate WACC $10 12.0% $22 13.4% $22 6.0% 3.0% n/a n/a $23 10.3% 4.5% $18 12.0% 4.0% $23 10.7% (2.0%) $28 9.7% $24 13.0% 15.7% $30 $30 11.0% $26 10.0% $28 15.0% range $31 $24 range n/a 11.0% 18.0% 10.0% TV Growth Rate $24.2 12.3% $24.0 11.5% $31.0 18.0% $10.0 9.7% $5.5 2.5% 0.23 0.20 3.5% 3.5% n/a 3.0% n/a n/a n/a 5.0% Revenue $3,863 $4,500 n/a $4,816 $6,248 $6,396 $4,902 $6,808 $5,126 $4,634 $5,204 $4,965 $5,649 $4,621 n/a $5,269 n/a $4,654 3.4% $5,177 3.5% $4,965 6.0% $6,808 (2.0%) $3,863 2.2% $795 0.66 0.15 Analyst Forecast for 2020 DAU n/a 250 280 369 346 289 289 n/a 281 n/a 332 n/a ARPU 236 $20.72 293.7 285.1 369.0 236.0 38.3 n/a n/a 0.13 $21.24 $14.09 $18.92 $22.41 299 $1,026 $21.30 272 $18.06 $1,275 281 $17.02 $351 $18.16 n/a $18.89 n/a $16.70 n/a $18.86 $18.89 Free Cash Flow (FCF) $22.41 $14.09 $2.44 0.13 ($178) $605 $357 ($592) $398 $253 ($243) $351 $634 $953 $391 $442 n/a $402 $391 $1,275 ($592) $487 1.21 Exhibit 9: Summary of Analyst Assumptions and Forecasts for Snap in 2020 (see Note 1 below) Analyst (s) From Independent Firms Pivotal Aegis Capital Susquehanna FBN Cantor Piper Jaffray Lead Underwriter Morgan Stanley Lead Managers JP Morgan Deutsche Bank Credit Suisse Other Underwriters Cowen & Co JMP Securities Oppenheimer RBC Capital UBS William Blair Average Median Report Date 2-Mar-17 2-Mar-17 3-Mar-17 9-Mar-17 14-Mar-17 22-Mar-17 27-Mar-17 27-Mar-17 27-Mar-17 27-Mar-17 27-Mar-17 27-Mar-17 27-Mar-17 27-Mar-17 27-Mar-17 27-Mar-17 Maximum Minimum Standard Deviation Coeff. of Variation (Note 2) Price Target Discount Rate WACC $10 12.0% $22 13.4% $22 6.0% 3.0% n/a n/a $23 10.3% 4.5% $18 12.0% 4.0% $23 10.7% (2.0%) $28 9.7% $24 13.0% 15.7% $30 $30 11.0% $26 10.0% $28 15.0% range $31 $24 range n/a 11.0% 18.0% 10.0% TV Growth Rate $24.2 12.3% $24.0 11.5% $31.0 18.0% $10.0 9.7% $5.5 2.5% 0.23 0.20 3.5% 3.5% n/a 3.0% n/a n/a n/a 5.0% Revenue $3,863 $4,500 n/a $4,816 $6,248 $6,396 $4,902 $6,808 $5,126 $4,634 $5,204 $4,965 $5,649 $4,621 n/a $5,269 n/a $4,654 3.4% $5,177 3.5% $4,965 6.0% $6,808 (2.0%) $3,863 2.2% $795 0.66 0.15 Analyst Forecast for 2020 DAU n/a 250 280 369 346 289 289 n/a 281 n/a 332 n/a ARPU 236 $20.72 293.7 285.1 369.0 236.0 38.3 n/a n/a 0.13 $21.24 $14.09 $18.92 $22.41 299 $1,026 $21.30 272 $18.06 $1,275 281 $17.02 $351 $18.16 n/a $18.89 n/a $16.70 n/a $18.86 $18.89 Free Cash Flow (FCF) $22.41 $14.09 $2.44 0.13 ($178) $605 $357 ($592) $398 $253 ($243) $351 $634 $953 $391 $442 n/a $402 $391 $1,275 ($592) $487 1.21 Exhibit 9: Summary of Analyst Assumptions and Forecasts for Snap in 2020 (see Note 1 below) Analyst (s) From Independent Firms Pivotal Aegis Capital Susquehanna FBN Cantor Piper Jaffray Lead Underwriter Morgan Stanley Lead Managers JP Morgan Deutsche Bank Credit Suisse Other Underwriters Cowen & Co JMP Securities Oppenheimer RBC Capital UBS William Blair Average Median Report Date 2-Mar-17 2-Mar-17 3-Mar-17 9-Mar-17 14-Mar-17 22-Mar-17 27-Mar-17 27-Mar-17 27-Mar-17 27-Mar-17 27-Mar-17 27-Mar-17 27-Mar-17 27-Mar-17 27-Mar-17 27-Mar-17 Maximum Minimum Standard Deviation Coeff. of Variation (Note 2) Price Target Discount Rate WACC $10 12.0% $22 13.4% $22 6.0% 3.0% n/a n/a $23 10.3% 4.5% $18 12.0% 4.0% $23 10.7% (2.0%) $28 9.7% $24 13.0% 15.7% $30 $30 11.0% $26 10.0% $28 15.0% range $31 $24 range n/a 11.0% 18.0% 10.0% TV Growth Rate $24.2 12.3% $24.0 11.5% $31.0 18.0% $10.0 9.7% $5.5 2.5% 0.23 0.20 3.5% 3.5% n/a 3.0% n/a n/a n/a 5.0% Revenue $3,863 $4,500 n/a $4,816 $6,248 $6,396 $4,902 $6,808 $5,126 $4,634 $5,204 $4,965 $5,649 $4,621 n/a $5,269 n/a $4,654 3.4% $5,177 3.5% $4,965 6.0% $6,808 (2.0%) $3,863 2.2% $795 0.66 0.15 Analyst Forecast for 2020 DAU n/a 250 280 369 346 289 289 n/a 281 n/a 332 n/a ARPU 236 $20.72 293.7 285.1 369.0 236.0 38.3 n/a n/a 0.13 $21.24 $14.09 $18.92 $22.41 299 $1,026 $21.30 272 $18.06 $1,275 281 $17.02 $351 $18.16 n/a $18.89 n/a $16.70 n/a $18.86 $18.89 Free Cash Flow (FCF) $22.41 $14.09 $2.44 0.13 ($178) $605 $357 ($592) $398 $253 ($243) $351 $634 $953 $391 $442 n/a $402 $391 $1,275 ($592) $487 1.21 c. The free cash flow forecast in general and Snap's 2020 revenue forecast in particular. (15 points) - What growth rates does the FCF forecast assume for revenue? (Hint: not terminal value but the first years of FCF) - Discuss how Nowak's report argues that Snap will accomplish this growth. - In your opinion, is this growth rate reasonable? Discuss why. How does the revenue forecast compare against what other analysts have predicted? - Did the analysts with more optimistic FCF forecasts use higher or lower discount rates? (Show a table as well as discuss) - Does this explain why the price target estimates by the different analysts was fairly close even though they had very different FCF forecasts? Explain. c. The free cash flow forecast in general and Snap's 2020 revenue forecast in particular. (15 points) - What growth rates does the FCF forecast assume for revenue? (Hint: not terminal value but the first years of FCF) - Discuss how Nowak's report argues that Snap will accomplish this growth. - In your opinion, is this growth rate reasonable? Discuss why. How does the revenue forecast compare against what other analysts have predicted? - Did the analysts with more optimistic FCF forecasts use higher or lower discount rates? (Show a table as well as discuss) - Does this explain why the price target estimates by the different analysts was fairly close even though they had very different FCF forecasts? Explain. c. The free cash flow forecast in general and Snap's 2020 revenue forecast in particular. (15 points) - What growth rates does the FCF forecast assume for revenue? (Hint: not terminal value but the first years of FCF) - Discuss how Nowak's report argues that Snap will accomplish this growth. - In your opinion, is this growth rate reasonable? Discuss why. How does the revenue forecast compare against what other analysts have predicted? - Did the analysts with more optimistic FCF forecasts use higher or lower discount rates? (Show a table as well as discuss) - Does this explain why the price target estimates by the different analysts was fairly close even though they had very different FCF forecasts? Explain. c. The free cash flow forecast in general and Snap's 2020 revenue forecast in particular. (15 points) - What growth rates does the FCF forecast assume for revenue? (Hint: not terminal value but the first years of FCF) - Discuss how Nowak's report argues that Snap will accomplish this growth. - In your opinion, is this growth rate reasonable? Discuss why. How does the revenue forecast compare against what other analysts have predicted? - Did the analysts with more optimistic FCF forecasts use higher or lower discount rates? (Show a table as well as discuss) - Does this explain why the price target estimates by the different analysts was fairly close even though they had very different FCF forecasts? Explain.
Expert Answer:
Answer rating: 100% (QA)
c The free cash flow forecast in general and Snaps 2020 revenue forecast in particular 15 points What growth rates does the FCF forecast assume for revenue Hint not terminal value but the first years ... View the full answer

Related Book For 

Intermediate Accounting Volume 2
ISBN: 9781260881240
8th Edition
Authors: Thomas H. Beechy, Joan E. Conrod, Elizabeth Farrell, Ingrid McLeod-Dick, Kayla Tomulka, Romi-Lee Sevel
Posted Date:
Students also viewed these finance questions
-
Specifically, did the Nodal and Mesh analysis methods yield the same results for the branch current, IX and the branch voltage, VX? Why
-
The following additional information is available for the Dr. Ivan and Irene Incisor family from Chapters 1-6. On December 12, Irene purchased the building where her store is located. She paid...
-
The following additional information is available for the Dr. Ivan and Irene Incisor family from Chapters 1-5. Ivan's grandfather died and left a portfolio of municipal bonds. In 2012, they pay Ivan...
-
You kick a soccer ball, compressing it suddenly to 2/3 of its original volume. In the process, you do 410 J of work on the air (assumed to be an ideal gas) inside the ball. (a) What is the change in...
-
Refer to Equation 5.40 which discusses the regression-through-the-origin (i.e., zero-intercept) model. If there is in fact an intercept present in the model but you run it through the origin, what...
-
The process abc shown in the pV-diagram in Fig. E19.11 involves 0.0175 mole of an ideal gas. (a) What was the lowest temperature the gas reached in this process? Where did it occur? (b) How much work...
-
Find the present value of (1) a single payment of $12,000 at 6 percent for 12 years, (2) 12 annual payments of $1,000 at 6 percent, (3) a single payment of $2,500 at 9 percent for five years, and (4)...
-
McDormand Co. manufactures products in batches of 100 units per batch. The company uses a standard cost system and prepares budgets that call for 500 of these batches per period. Fixed overhead is...
-
ABC. Inc is expected to pay a dividend of $38.19 per share. The dividends are expected to increase by 5% each year. The required rate of return on the stock is 14%. What is the stock's expected price...
-
The following T accounts show transactions that were recorded in December 20X1 by Cedar Canyon Nursery and Landscape, a firm that specializes in residential and commercial landscaping. The entries...
-
State the condition for grant of surveyor's license under the surveyor's license board.
-
Smith produces electronic calculators. Suppose Smiths standard cost per calculator is \($26\) for materials and \($65\) for conversion costs. The following data apply to July production: Requirements...
-
Kuyu Company uses the periodic inventory system. Kuyu started the period with \(\$ 12,000\) in inventory. The company purchased an additional \(\$ 25,000\) of merchandise, and returned \(\$ 1,500\)...
-
On September 12, Burt, Inc., purchased merchandise for \(\$ 4,800\), with terms of \(2 / 10, n / 30\). On September 16 , the firm returned \(\$ 500\) of the merchandise to the seller. Payment of the...
-
On July 1, Hernandez, Inc. purchased merchandise for \(\$ 2,500\), with terms of \(1 / 10, n / 30\). On July 5 , the firm returned \(\$ 1,000\) of the merchandise to the seller. Payment of the...
-
Daily air quality is measured by the air quality index (AQI) reported by the Environmental Protection Agency. This index reports the pollution level and what associated health eects might be a...
-
Using the following financial statements for Protegen Incorporated, how much cash did the company receive from customers during 2020? BALANCE SHEET As of December 31, Assets Cash Accounts Receivable...
-
What mass of H2 will be produced when 122 g of Zn are reacted? Zn(s) + 2HCl(aq) ( ZnCl2(aq) + H2(g)
-
Stacy Corp. would have had identical income before tax on both its income tax returns and statements of profit and loss for the years 20X4 through 20X7, except for equipment that cost $120,000. The...
-
Ramca Corp.s accounting year ends on 31 December. During the three most recent years, its common shares outstanding changed as follows: Required: 1. For purposes of calculating EPS at the end of each...
-
Burgher Ltd. had a taxable loss of $300,000 in 20X7. The tax rate in 20X7 is 32%. In the past three years, the company had the following taxable income and tax rates: There are no temporary...
-
Explain how to record purchases of inventory using a periodic inventory system. - In a periodic inventory system, purchases of inventory are recorded by increasing the purchases account. - If a...
-
(Average compounding rate) WindyRoad is an investment company which has two mutual funds. The WindyRoad Dull Fund invests in boring corporate bonds, and its Lively Fund invests in high-risk,...
-
What are the differences between merchandisers and manufacturers?(Appendix)

Study smarter with the SolutionInn App