

General Mills, Inc. The fiscal year 2017 annual report of Gen- cral Mills, Inc. is available...
Fantastic news! We've Found the answer you've been seeking!
Question:
Transcribed Image Text:
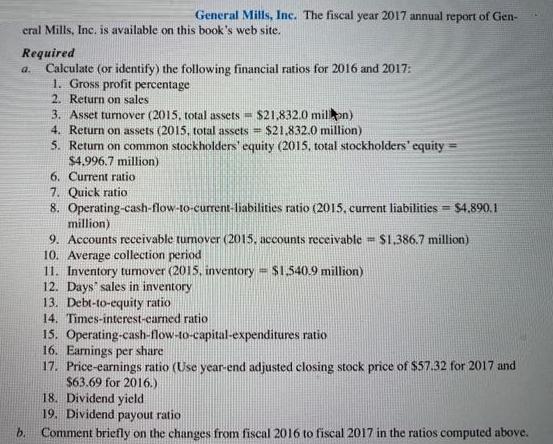
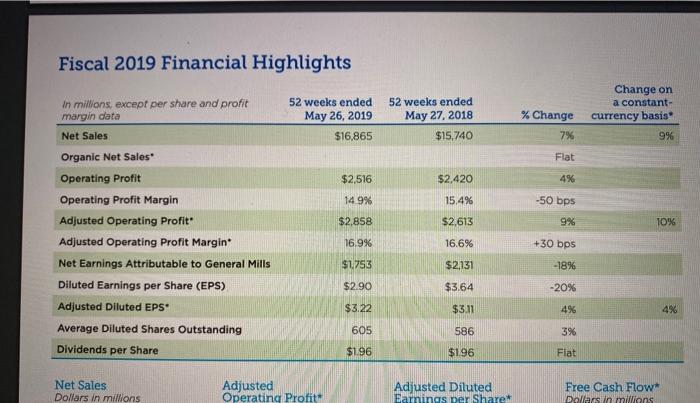
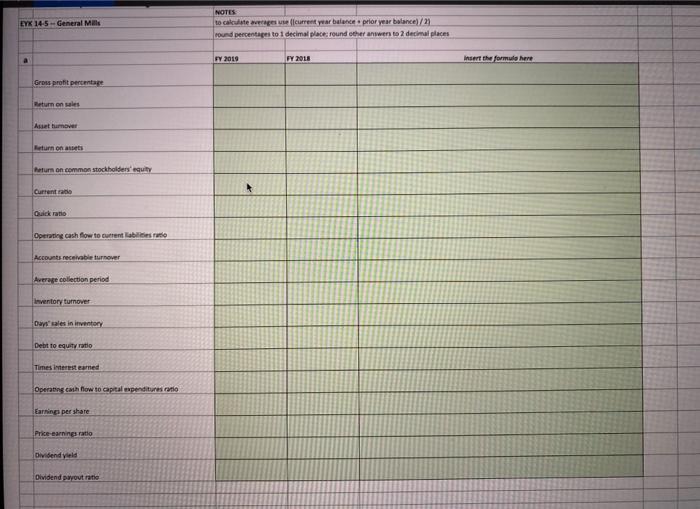
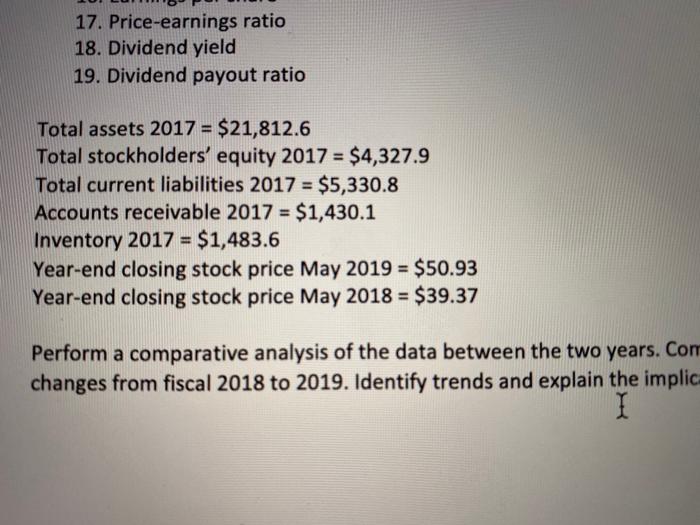
General Mills, Inc. The fiscal year 2017 annual report of Gen- cral Mills, Inc. is available on this book's web site. Required Calculate (or identify) the following financial ratios for 2016 and 2017: 1. Gross profit percentage a. 2. Return on sales $21,832.0 milon) 3. Asset turnover (2015, total assets = 4. Return on assets (2015, total assets = $21,832.0 million) 5. Returm on common stockholders' equity (2015, total stockholders' equity = $4.996,7 million) 6. Current ratio 7. Quick ratio 8. Operating-cash-flow-to-current-liabilities ratio (2015. current liabilities = $4,890,1 million) 9. Accounts receivable tumover (2015, accounts receivable = $1,386.7 million) 10. Average collection period 11. Inventory tumover (2015, inventory = $1.540.9 million) 12. Days" sales in inventory 13. Debt-to-equity ratio 14. Times-interest-carned ratio 15. Operating-cash-flow-to-capital-expenditures ratio 16. Earnings per share 17. Price-earnings ratio (Use year-end adjusted closing stock price of $57.32 for 2017 and $63.69 for 2016.) 18. Dividend yield 19. Dividend payout ratio Comment briefly on the changes from fiscal 2016 to fiscal 2017 in the ratios computed above. %3! %3! b. Fiscal 2019 Financial Highlights Change on a constant- In millions, except per share and profit margin data 52 weeks ended May 26, 2019 52 weeks ended May 27, 2018 % Change currency basis* Net Sales $16,865 $15,740 7% 9% Organic Net Sales Flat Operating Profit $2,516 $2,420 4% Operating Profit Margin 14. 9% 15.4% -50 bps Adjusted Operating Profit $2,858 $2,613 9% T0% Adjusted Operating Profit Margin 16.9% 16.6% +30 bps Net Earnings Attributable to General Mills $1,753 $2131 -18% Diluted Earnings per Share (EPS) $2.90 $3.64 -20% Adjusted Diluted EPS $3.22 $3.11 4% 4% Average Diluted Shares Outstanding 605 586 3% Dividends per Share $1.96 $1.96 Flat Net Sales Dollars in millions Adjusted Operating Profit* Adjusted Diluted Earnings per Share Free Cash Flow* Dollars in millions NOTES EYK 14-5-General Mills to calculate averages use (lcurrent year balance prior year balance) / 2) round percentages to 1 decimal place: round other answers to 2 decimal places FY 2019 FY 2018 insert the formulo here Gross profit percentage Return on sales Asset turmover Return on assets heturn on common stockhokders' equity Current ratio Ouick rato Operating cash flow to current labilities ratio Accounts receivable turnover Average collection period inventory turnover Days sales in inventory Debt to equity ratio Times interest earned Operating cash flow to capital expenditures ratio Earnings per share Price-earnings ratio Dividend yleld Dividend payout ratie 17. Price-earnings ratio 18. Dividend yield 19. Dividend payout ratio Total assets 2017 = $21,812.6 Total stockholders' equity 2017 = $4,327.9 Total current liabilities 2017 = $5,330.8 Accounts receivable 2017 = $1,430.1 Inventory 2017 = $1,483.6 Year-end closing stock price May 2019 = $50.93 Year-end closing stock price May 2018 = $39.37 %3D %3D %3D %3D %3D Perform a comparative analysis of the data between the two years. Com changes from fiscal 2018 to 2019. Identify trends and explain the implic General Mills, Inc. The fiscal year 2017 annual report of Gen- cral Mills, Inc. is available on this book's web site. Required Calculate (or identify) the following financial ratios for 2016 and 2017: 1. Gross profit percentage a. 2. Return on sales $21,832.0 milon) 3. Asset turnover (2015, total assets = 4. Return on assets (2015, total assets = $21,832.0 million) 5. Returm on common stockholders' equity (2015, total stockholders' equity = $4.996,7 million) 6. Current ratio 7. Quick ratio 8. Operating-cash-flow-to-current-liabilities ratio (2015. current liabilities = $4,890,1 million) 9. Accounts receivable tumover (2015, accounts receivable = $1,386.7 million) 10. Average collection period 11. Inventory tumover (2015, inventory = $1.540.9 million) 12. Days" sales in inventory 13. Debt-to-equity ratio 14. Times-interest-carned ratio 15. Operating-cash-flow-to-capital-expenditures ratio 16. Earnings per share 17. Price-earnings ratio (Use year-end adjusted closing stock price of $57.32 for 2017 and $63.69 for 2016.) 18. Dividend yield 19. Dividend payout ratio Comment briefly on the changes from fiscal 2016 to fiscal 2017 in the ratios computed above. %3! %3! b. Fiscal 2019 Financial Highlights Change on a constant- In millions, except per share and profit margin data 52 weeks ended May 26, 2019 52 weeks ended May 27, 2018 % Change currency basis* Net Sales $16,865 $15,740 7% 9% Organic Net Sales Flat Operating Profit $2,516 $2,420 4% Operating Profit Margin 14. 9% 15.4% -50 bps Adjusted Operating Profit $2,858 $2,613 9% T0% Adjusted Operating Profit Margin 16.9% 16.6% +30 bps Net Earnings Attributable to General Mills $1,753 $2131 -18% Diluted Earnings per Share (EPS) $2.90 $3.64 -20% Adjusted Diluted EPS $3.22 $3.11 4% 4% Average Diluted Shares Outstanding 605 586 3% Dividends per Share $1.96 $1.96 Flat Net Sales Dollars in millions Adjusted Operating Profit* Adjusted Diluted Earnings per Share Free Cash Flow* Dollars in millions NOTES EYK 14-5-General Mills to calculate averages use (lcurrent year balance prior year balance) / 2) round percentages to 1 decimal place: round other answers to 2 decimal places FY 2019 FY 2018 insert the formulo here Gross profit percentage Return on sales Asset turmover Return on assets heturn on common stockhokders' equity Current ratio Ouick rato Operating cash flow to current labilities ratio Accounts receivable turnover Average collection period inventory turnover Days sales in inventory Debt to equity ratio Times interest earned Operating cash flow to capital expenditures ratio Earnings per share Price-earnings ratio Dividend yleld Dividend payout ratie 17. Price-earnings ratio 18. Dividend yield 19. Dividend payout ratio Total assets 2017 = $21,812.6 Total stockholders' equity 2017 = $4,327.9 Total current liabilities 2017 = $5,330.8 Accounts receivable 2017 = $1,430.1 Inventory 2017 = $1,483.6 Year-end closing stock price May 2019 = $50.93 Year-end closing stock price May 2018 = $39.37 %3D %3D %3D %3D %3D Perform a comparative analysis of the data between the two years. Com changes from fiscal 2018 to 2019. Identify trends and explain the implic General Mills, Inc. The fiscal year 2017 annual report of Gen- cral Mills, Inc. is available on this book's web site. Required Calculate (or identify) the following financial ratios for 2016 and 2017: 1. Gross profit percentage a. 2. Return on sales $21,832.0 milon) 3. Asset turnover (2015, total assets = 4. Return on assets (2015, total assets = $21,832.0 million) 5. Returm on common stockholders' equity (2015, total stockholders' equity = $4.996,7 million) 6. Current ratio 7. Quick ratio 8. Operating-cash-flow-to-current-liabilities ratio (2015. current liabilities = $4,890,1 million) 9. Accounts receivable tumover (2015, accounts receivable = $1,386.7 million) 10. Average collection period 11. Inventory tumover (2015, inventory = $1.540.9 million) 12. Days" sales in inventory 13. Debt-to-equity ratio 14. Times-interest-carned ratio 15. Operating-cash-flow-to-capital-expenditures ratio 16. Earnings per share 17. Price-earnings ratio (Use year-end adjusted closing stock price of $57.32 for 2017 and $63.69 for 2016.) 18. Dividend yield 19. Dividend payout ratio Comment briefly on the changes from fiscal 2016 to fiscal 2017 in the ratios computed above. %3! %3! b. Fiscal 2019 Financial Highlights Change on a constant- In millions, except per share and profit margin data 52 weeks ended May 26, 2019 52 weeks ended May 27, 2018 % Change currency basis* Net Sales $16,865 $15,740 7% 9% Organic Net Sales Flat Operating Profit $2,516 $2,420 4% Operating Profit Margin 14. 9% 15.4% -50 bps Adjusted Operating Profit $2,858 $2,613 9% T0% Adjusted Operating Profit Margin 16.9% 16.6% +30 bps Net Earnings Attributable to General Mills $1,753 $2131 -18% Diluted Earnings per Share (EPS) $2.90 $3.64 -20% Adjusted Diluted EPS $3.22 $3.11 4% 4% Average Diluted Shares Outstanding 605 586 3% Dividends per Share $1.96 $1.96 Flat Net Sales Dollars in millions Adjusted Operating Profit* Adjusted Diluted Earnings per Share Free Cash Flow* Dollars in millions NOTES EYK 14-5-General Mills to calculate averages use (lcurrent year balance prior year balance) / 2) round percentages to 1 decimal place: round other answers to 2 decimal places FY 2019 FY 2018 insert the formulo here Gross profit percentage Return on sales Asset turmover Return on assets heturn on common stockhokders' equity Current ratio Ouick rato Operating cash flow to current labilities ratio Accounts receivable turnover Average collection period inventory turnover Days sales in inventory Debt to equity ratio Times interest earned Operating cash flow to capital expenditures ratio Earnings per share Price-earnings ratio Dividend yleld Dividend payout ratie 17. Price-earnings ratio 18. Dividend yield 19. Dividend payout ratio Total assets 2017 = $21,812.6 Total stockholders' equity 2017 = $4,327.9 Total current liabilities 2017 = $5,330.8 Accounts receivable 2017 = $1,430.1 Inventory 2017 = $1,483.6 Year-end closing stock price May 2019 = $50.93 Year-end closing stock price May 2018 = $39.37 %3D %3D %3D %3D %3D Perform a comparative analysis of the data between the two years. Com changes from fiscal 2018 to 2019. Identify trends and explain the implic General Mills, Inc. The fiscal year 2017 annual report of Gen- cral Mills, Inc. is available on this book's web site. Required Calculate (or identify) the following financial ratios for 2016 and 2017: 1. Gross profit percentage a. 2. Return on sales $21,832.0 milon) 3. Asset turnover (2015, total assets = 4. Return on assets (2015, total assets = $21,832.0 million) 5. Returm on common stockholders' equity (2015, total stockholders' equity = $4.996,7 million) 6. Current ratio 7. Quick ratio 8. Operating-cash-flow-to-current-liabilities ratio (2015. current liabilities = $4,890,1 million) 9. Accounts receivable tumover (2015, accounts receivable = $1,386.7 million) 10. Average collection period 11. Inventory tumover (2015, inventory = $1.540.9 million) 12. Days" sales in inventory 13. Debt-to-equity ratio 14. Times-interest-carned ratio 15. Operating-cash-flow-to-capital-expenditures ratio 16. Earnings per share 17. Price-earnings ratio (Use year-end adjusted closing stock price of $57.32 for 2017 and $63.69 for 2016.) 18. Dividend yield 19. Dividend payout ratio Comment briefly on the changes from fiscal 2016 to fiscal 2017 in the ratios computed above. %3! %3! b. Fiscal 2019 Financial Highlights Change on a constant- In millions, except per share and profit margin data 52 weeks ended May 26, 2019 52 weeks ended May 27, 2018 % Change currency basis* Net Sales $16,865 $15,740 7% 9% Organic Net Sales Flat Operating Profit $2,516 $2,420 4% Operating Profit Margin 14. 9% 15.4% -50 bps Adjusted Operating Profit $2,858 $2,613 9% T0% Adjusted Operating Profit Margin 16.9% 16.6% +30 bps Net Earnings Attributable to General Mills $1,753 $2131 -18% Diluted Earnings per Share (EPS) $2.90 $3.64 -20% Adjusted Diluted EPS $3.22 $3.11 4% 4% Average Diluted Shares Outstanding 605 586 3% Dividends per Share $1.96 $1.96 Flat Net Sales Dollars in millions Adjusted Operating Profit* Adjusted Diluted Earnings per Share Free Cash Flow* Dollars in millions NOTES EYK 14-5-General Mills to calculate averages use (lcurrent year balance prior year balance) / 2) round percentages to 1 decimal place: round other answers to 2 decimal places FY 2019 FY 2018 insert the formulo here Gross profit percentage Return on sales Asset turmover Return on assets heturn on common stockhokders' equity Current ratio Ouick rato Operating cash flow to current labilities ratio Accounts receivable turnover Average collection period inventory turnover Days sales in inventory Debt to equity ratio Times interest earned Operating cash flow to capital expenditures ratio Earnings per share Price-earnings ratio Dividend yleld Dividend payout ratie 17. Price-earnings ratio 18. Dividend yield 19. Dividend payout ratio Total assets 2017 = $21,812.6 Total stockholders' equity 2017 = $4,327.9 Total current liabilities 2017 = $5,330.8 Accounts receivable 2017 = $1,430.1 Inventory 2017 = $1,483.6 Year-end closing stock price May 2019 = $50.93 Year-end closing stock price May 2018 = $39.37 %3D %3D %3D %3D %3D Perform a comparative analysis of the data between the two years. Com changes from fiscal 2018 to 2019. Identify trends and explain the implic General Mills, Inc. The fiscal year 2017 annual report of Gen- cral Mills, Inc. is available on this book's web site. Required Calculate (or identify) the following financial ratios for 2016 and 2017: 1. Gross profit percentage a. 2. Return on sales $21,832.0 milon) 3. Asset turnover (2015, total assets = 4. Return on assets (2015, total assets = $21,832.0 million) 5. Returm on common stockholders' equity (2015, total stockholders' equity = $4.996,7 million) 6. Current ratio 7. Quick ratio 8. Operating-cash-flow-to-current-liabilities ratio (2015. current liabilities = $4,890,1 million) 9. Accounts receivable tumover (2015, accounts receivable = $1,386.7 million) 10. Average collection period 11. Inventory tumover (2015, inventory = $1.540.9 million) 12. Days" sales in inventory 13. Debt-to-equity ratio 14. Times-interest-carned ratio 15. Operating-cash-flow-to-capital-expenditures ratio 16. Earnings per share 17. Price-earnings ratio (Use year-end adjusted closing stock price of $57.32 for 2017 and $63.69 for 2016.) 18. Dividend yield 19. Dividend payout ratio Comment briefly on the changes from fiscal 2016 to fiscal 2017 in the ratios computed above. %3! %3! b. Fiscal 2019 Financial Highlights Change on a constant- In millions, except per share and profit margin data 52 weeks ended May 26, 2019 52 weeks ended May 27, 2018 % Change currency basis* Net Sales $16,865 $15,740 7% 9% Organic Net Sales Flat Operating Profit $2,516 $2,420 4% Operating Profit Margin 14. 9% 15.4% -50 bps Adjusted Operating Profit $2,858 $2,613 9% T0% Adjusted Operating Profit Margin 16.9% 16.6% +30 bps Net Earnings Attributable to General Mills $1,753 $2131 -18% Diluted Earnings per Share (EPS) $2.90 $3.64 -20% Adjusted Diluted EPS $3.22 $3.11 4% 4% Average Diluted Shares Outstanding 605 586 3% Dividends per Share $1.96 $1.96 Flat Net Sales Dollars in millions Adjusted Operating Profit* Adjusted Diluted Earnings per Share Free Cash Flow* Dollars in millions NOTES EYK 14-5-General Mills to calculate averages use (lcurrent year balance prior year balance) / 2) round percentages to 1 decimal place: round other answers to 2 decimal places FY 2019 FY 2018 insert the formulo here Gross profit percentage Return on sales Asset turmover Return on assets heturn on common stockhokders' equity Current ratio Ouick rato Operating cash flow to current labilities ratio Accounts receivable turnover Average collection period inventory turnover Days sales in inventory Debt to equity ratio Times interest earned Operating cash flow to capital expenditures ratio Earnings per share Price-earnings ratio Dividend yleld Dividend payout ratie 17. Price-earnings ratio 18. Dividend yield 19. Dividend payout ratio Total assets 2017 = $21,812.6 Total stockholders' equity 2017 = $4,327.9 Total current liabilities 2017 = $5,330.8 Accounts receivable 2017 = $1,430.1 Inventory 2017 = $1,483.6 Year-end closing stock price May 2019 = $50.93 Year-end closing stock price May 2018 = $39.37 %3D %3D %3D %3D %3D Perform a comparative analysis of the data between the two years. Com changes from fiscal 2018 to 2019. Identify trends and explain the implic General Mills, Inc. The fiscal year 2017 annual report of Gen- cral Mills, Inc. is available on this book's web site. Required Calculate (or identify) the following financial ratios for 2016 and 2017: 1. Gross profit percentage a. 2. Return on sales $21,832.0 milon) 3. Asset turnover (2015, total assets = 4. Return on assets (2015, total assets = $21,832.0 million) 5. Returm on common stockholders' equity (2015, total stockholders' equity = $4.996,7 million) 6. Current ratio 7. Quick ratio 8. Operating-cash-flow-to-current-liabilities ratio (2015. current liabilities = $4,890,1 million) 9. Accounts receivable tumover (2015, accounts receivable = $1,386.7 million) 10. Average collection period 11. Inventory tumover (2015, inventory = $1.540.9 million) 12. Days" sales in inventory 13. Debt-to-equity ratio 14. Times-interest-carned ratio 15. Operating-cash-flow-to-capital-expenditures ratio 16. Earnings per share 17. Price-earnings ratio (Use year-end adjusted closing stock price of $57.32 for 2017 and $63.69 for 2016.) 18. Dividend yield 19. Dividend payout ratio Comment briefly on the changes from fiscal 2016 to fiscal 2017 in the ratios computed above. %3! %3! b. Fiscal 2019 Financial Highlights Change on a constant- In millions, except per share and profit margin data 52 weeks ended May 26, 2019 52 weeks ended May 27, 2018 % Change currency basis* Net Sales $16,865 $15,740 7% 9% Organic Net Sales Flat Operating Profit $2,516 $2,420 4% Operating Profit Margin 14. 9% 15.4% -50 bps Adjusted Operating Profit $2,858 $2,613 9% T0% Adjusted Operating Profit Margin 16.9% 16.6% +30 bps Net Earnings Attributable to General Mills $1,753 $2131 -18% Diluted Earnings per Share (EPS) $2.90 $3.64 -20% Adjusted Diluted EPS $3.22 $3.11 4% 4% Average Diluted Shares Outstanding 605 586 3% Dividends per Share $1.96 $1.96 Flat Net Sales Dollars in millions Adjusted Operating Profit* Adjusted Diluted Earnings per Share Free Cash Flow* Dollars in millions NOTES EYK 14-5-General Mills to calculate averages use (lcurrent year balance prior year balance) / 2) round percentages to 1 decimal place: round other answers to 2 decimal places FY 2019 FY 2018 insert the formulo here Gross profit percentage Return on sales Asset turmover Return on assets heturn on common stockhokders' equity Current ratio Ouick rato Operating cash flow to current labilities ratio Accounts receivable turnover Average collection period inventory turnover Days sales in inventory Debt to equity ratio Times interest earned Operating cash flow to capital expenditures ratio Earnings per share Price-earnings ratio Dividend yleld Dividend payout ratie 17. Price-earnings ratio 18. Dividend yield 19. Dividend payout ratio Total assets 2017 = $21,812.6 Total stockholders' equity 2017 = $4,327.9 Total current liabilities 2017 = $5,330.8 Accounts receivable 2017 = $1,430.1 Inventory 2017 = $1,483.6 Year-end closing stock price May 2019 = $50.93 Year-end closing stock price May 2018 = $39.37 %3D %3D %3D %3D %3D Perform a comparative analysis of the data between the two years. Com changes from fiscal 2018 to 2019. Identify trends and explain the implic General Mills, Inc. The fiscal year 2017 annual report of Gen- cral Mills, Inc. is available on this book's web site. Required Calculate (or identify) the following financial ratios for 2016 and 2017: 1. Gross profit percentage a. 2. Return on sales $21,832.0 milon) 3. Asset turnover (2015, total assets = 4. Return on assets (2015, total assets = $21,832.0 million) 5. Returm on common stockholders' equity (2015, total stockholders' equity = $4.996,7 million) 6. Current ratio 7. Quick ratio 8. Operating-cash-flow-to-current-liabilities ratio (2015. current liabilities = $4,890,1 million) 9. Accounts receivable tumover (2015, accounts receivable = $1,386.7 million) 10. Average collection period 11. Inventory tumover (2015, inventory = $1.540.9 million) 12. Days" sales in inventory 13. Debt-to-equity ratio 14. Times-interest-carned ratio 15. Operating-cash-flow-to-capital-expenditures ratio 16. Earnings per share 17. Price-earnings ratio (Use year-end adjusted closing stock price of $57.32 for 2017 and $63.69 for 2016.) 18. Dividend yield 19. Dividend payout ratio Comment briefly on the changes from fiscal 2016 to fiscal 2017 in the ratios computed above. %3! %3! b. Fiscal 2019 Financial Highlights Change on a constant- In millions, except per share and profit margin data 52 weeks ended May 26, 2019 52 weeks ended May 27, 2018 % Change currency basis* Net Sales $16,865 $15,740 7% 9% Organic Net Sales Flat Operating Profit $2,516 $2,420 4% Operating Profit Margin 14. 9% 15.4% -50 bps Adjusted Operating Profit $2,858 $2,613 9% T0% Adjusted Operating Profit Margin 16.9% 16.6% +30 bps Net Earnings Attributable to General Mills $1,753 $2131 -18% Diluted Earnings per Share (EPS) $2.90 $3.64 -20% Adjusted Diluted EPS $3.22 $3.11 4% 4% Average Diluted Shares Outstanding 605 586 3% Dividends per Share $1.96 $1.96 Flat Net Sales Dollars in millions Adjusted Operating Profit* Adjusted Diluted Earnings per Share Free Cash Flow* Dollars in millions NOTES EYK 14-5-General Mills to calculate averages use (lcurrent year balance prior year balance) / 2) round percentages to 1 decimal place: round other answers to 2 decimal places FY 2019 FY 2018 insert the formulo here Gross profit percentage Return on sales Asset turmover Return on assets heturn on common stockhokders' equity Current ratio Ouick rato Operating cash flow to current labilities ratio Accounts receivable turnover Average collection period inventory turnover Days sales in inventory Debt to equity ratio Times interest earned Operating cash flow to capital expenditures ratio Earnings per share Price-earnings ratio Dividend yleld Dividend payout ratie 17. Price-earnings ratio 18. Dividend yield 19. Dividend payout ratio Total assets 2017 = $21,812.6 Total stockholders' equity 2017 = $4,327.9 Total current liabilities 2017 = $5,330.8 Accounts receivable 2017 = $1,430.1 Inventory 2017 = $1,483.6 Year-end closing stock price May 2019 = $50.93 Year-end closing stock price May 2018 = $39.37 %3D %3D %3D %3D %3D Perform a comparative analysis of the data between the two years. Com changes from fiscal 2018 to 2019. Identify trends and explain the implic General Mills, Inc. The fiscal year 2017 annual report of Gen- cral Mills, Inc. is available on this book's web site. Required Calculate (or identify) the following financial ratios for 2016 and 2017: 1. Gross profit percentage a. 2. Return on sales $21,832.0 milon) 3. Asset turnover (2015, total assets = 4. Return on assets (2015, total assets = $21,832.0 million) 5. Returm on common stockholders' equity (2015, total stockholders' equity = $4.996,7 million) 6. Current ratio 7. Quick ratio 8. Operating-cash-flow-to-current-liabilities ratio (2015. current liabilities = $4,890,1 million) 9. Accounts receivable tumover (2015, accounts receivable = $1,386.7 million) 10. Average collection period 11. Inventory tumover (2015, inventory = $1.540.9 million) 12. Days" sales in inventory 13. Debt-to-equity ratio 14. Times-interest-carned ratio 15. Operating-cash-flow-to-capital-expenditures ratio 16. Earnings per share 17. Price-earnings ratio (Use year-end adjusted closing stock price of $57.32 for 2017 and $63.69 for 2016.) 18. Dividend yield 19. Dividend payout ratio Comment briefly on the changes from fiscal 2016 to fiscal 2017 in the ratios computed above. %3! %3! b. Fiscal 2019 Financial Highlights Change on a constant- In millions, except per share and profit margin data 52 weeks ended May 26, 2019 52 weeks ended May 27, 2018 % Change currency basis* Net Sales $16,865 $15,740 7% 9% Organic Net Sales Flat Operating Profit $2,516 $2,420 4% Operating Profit Margin 14. 9% 15.4% -50 bps Adjusted Operating Profit $2,858 $2,613 9% T0% Adjusted Operating Profit Margin 16.9% 16.6% +30 bps Net Earnings Attributable to General Mills $1,753 $2131 -18% Diluted Earnings per Share (EPS) $2.90 $3.64 -20% Adjusted Diluted EPS $3.22 $3.11 4% 4% Average Diluted Shares Outstanding 605 586 3% Dividends per Share $1.96 $1.96 Flat Net Sales Dollars in millions Adjusted Operating Profit* Adjusted Diluted Earnings per Share Free Cash Flow* Dollars in millions NOTES EYK 14-5-General Mills to calculate averages use (lcurrent year balance prior year balance) / 2) round percentages to 1 decimal place: round other answers to 2 decimal places FY 2019 FY 2018 insert the formulo here Gross profit percentage Return on sales Asset turmover Return on assets heturn on common stockhokders' equity Current ratio Ouick rato Operating cash flow to current labilities ratio Accounts receivable turnover Average collection period inventory turnover Days sales in inventory Debt to equity ratio Times interest earned Operating cash flow to capital expenditures ratio Earnings per share Price-earnings ratio Dividend yleld Dividend payout ratie 17. Price-earnings ratio 18. Dividend yield 19. Dividend payout ratio Total assets 2017 = $21,812.6 Total stockholders' equity 2017 = $4,327.9 Total current liabilities 2017 = $5,330.8 Accounts receivable 2017 = $1,430.1 Inventory 2017 = $1,483.6 Year-end closing stock price May 2019 = $50.93 Year-end closing stock price May 2018 = $39.37 %3D %3D %3D %3D %3D Perform a comparative analysis of the data between the two years. Com changes from fiscal 2018 to 2019. Identify trends and explain the implic
Expert Answer:

Related Book For 
Financial Accounting Information For Decisions
ISBN: 978-0324672701
6th Edition
Authors: Robert w Ingram, Thomas L Albright
Posted Date:
Students also viewed these accounting questions
-
The following information appeared in the 2017 annual report of Rumours, Inc.: Long-Term Debt Rumours, Inc. issued $10 million, 10% coupon bonds on January 1, 2014, due on December 31, 2018. The...
-
This problem is based on the 2017 annual report of Campbell Soup Company in the appendix. Required: Find in the Selected Financial Data (also known as the Five-Year Review), or calculate, the...
-
This problem is based on the 2017 annual report of Campbell Soup Company in the appendix. Required: Find in the Selected Financial Data (also known as the Five-Year Review), or calculate, the...
-
For each polynomial function, find (a) (-1), (b) (2), and (c) (0). f(x) = x + 2x - 8
-
In Exercises 32, find the mean, the median, and the mode of the data, if possible. If any measure cannot be found or does not represent the center of the data, explain why. Grade Point Averages of...
-
Design a class that holds the following personal data: name, address, age, and phone number. Write appropriate accessor and mutator methods. Demonstrate the class by writing a program that creates...
-
Following on from Question 1.2: How much is that stakeholders liability limited to (in other words what is the maximum they stand to lose)? Question 1.2 In the context of a company limited by shares,...
-
Valley Corporation is attempting to select the best of a group of independent projects competing for the firms fixed capital budget of $4.5 million. The firm recognizes that any unused portion of...
-
How correct or accurate is this entry based on these events: Powell Company began the Year 3 accounting period with $40,000 cash, $86,000 inventory, $60,000 common stock, and $66,000 retained...
-
In February of 2023, during the preparation of Julia's 2022 return, you explained to her the options for using either the section 179 deduction or special depreciation for the purchases of her 2022...
-
Define which leases are to be capitalized on the lessees balance sheet under IFRS 16. Explain how this is different from the criteria that were previously used in U.S. GAAP (see Wiley 2ed Chapter 21...
-
List two design issues for the corruption EBT during the process of linking from the analysis phase to the design phase.
-
What are the four characteristics that a BO must satisfy to fully qualify as a BO in any particular pattern?
-
What criteria do you use to filter the list of BOs?
-
List some of the patterns related to the corruption analysis pattern.
-
How do you apply a stable analysis pattern to a particular context?
-
i cant figure this section out Froya Fabrikker A/S of Bergen, Norway, is a small company that manufactures speciaity heavy equipment for use in North Sea oil frelds. The company uses a job-order...
-
For the following exercises, write the first four terms of the sequence. a n = 2 n 2
-
The accounting staff at Moonbeam Enterprises prepares monthly financial statements. At the end of April 2004 the company had the following account balances: Land ..................$45,000 Notes...
-
Georgia Company borrowed $600,000 from a bank on May 1, 2004. The bank required a return of 12% on the loan. The loan is to be repaid over 12 months in equal installments. Georgia Companys fiscal...
-
Appendix B of this book contains a copy of the 2002 annual report of General Mills, Inc. Required Review the annual report and write a short report in which you respond to each of the issues raised...
-
The Largo Gift Hut operates a small souvenir shop in Key Largo, Florida. The shop has two departments, retail sales and mail order. Rent, utilities, and other operating expenses are allocated to the...
-
Microline is considering buying computer cabinets from an outside vendor. Currently, Microline makes the cabinets in its own manufacturing facility. Microline can buy the cabinets for $15 each. The...
-
Gem Products is considering buying the casters it uses in the manufacture of office chairs from an outside vendor. Currently, Gem Products makes the casters in its own manufacturing facility. Gem...

Study smarter with the SolutionInn App