Question
For the following set of forecasts (17, 20, 25, 31, 39) and actual values (19, 24, 28, 32, 38), calculate the MAD. Data collected on
- For the following set of forecasts (17, 20, 25, 31, 39) and actual values (19, 24, 28, 32, 38), calculate the MAD.
- Data collected on the annual demand for 50-pound fertilizer at Pikes Garden Supply is
shown below (in 1000’s of bags). Find the forecast for year 6 using (i) a three-year
moving average approach and (ii) a two year moving average approach. Calculate
the MAD to determine which method is better..
Year | Demand | Forecast | |
1 | 5 | ||
2 | 7 | ||
3 | 4 | ||
4 | 8 | ||
5 | 8 | ||
6 | 10 | ||
7 | 9 | ||
8 | 12 |
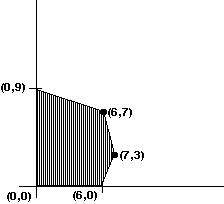
- The graph of the feasible region for a mixture problem is shown below. Find the point that maximizes the profit function P = 2x + 3y.

4. Customers arrive at a supply room, managed by a single clerk, with mean rate of 25 per hour. Service takes a mean of 2 minutes,
Calculate:
- The probability that the clerk is busy.
- The probability that the clerk is idle.
- The average number of customers in the system.
- The average number of customers waiting to be served.
5.
Using the graph above, find (a) coordinates of all the feasible regions and (b) the maximum profit for the equation P= 10X + 25Y
6. (a) What is queuing theory?
(b) List and briefly describe any two methods of forecasting.
(c) What is linear programming?
(d) Write brief notes on the importance of quantitative analysis.
7. In no less than 400 words, tell a student from another college what you are some of the things you have learned while doing the course Quantitative Analysis.
8. a. Which forecasting method assumes that next period’s forecast is equal to this period’s actual value?
b. A firm has the following order history over the last 6 months.
January 120
February 95
March 100
April 75
May 100
June 50
c. What would be a 3-month weighted moving average forecast for July, using weights of .4 for the most recent month, .3 for the month preceding the most recent month, and .3 for the month preceding that one?
9.a. Which forecasting method is the simplest?
b. State 2 assumptions of the waiting line models presented in your readings.
10. The area of a parking lot is 400 square meters. A car requires 5 square meters. A bus requires 8 square meters. The attendant can handle only 60 vehicles. If a car is charged $4.75 and a bus $9.50, how many of each should be accepted to maximize income?
(0,9) (0,0) (6,0) (6,7)
Step by Step Solution
3.41 Rating (164 Votes )
There are 3 Steps involved in it
Step: 1
Answer 10 Actual values Forec...
Get Instant Access to Expert-Tailored Solutions
See step-by-step solutions with expert insights and AI powered tools for academic success
Step: 2

Step: 3

Ace Your Homework with AI
Get the answers you need in no time with our AI-driven, step-by-step assistance
Get Started


