

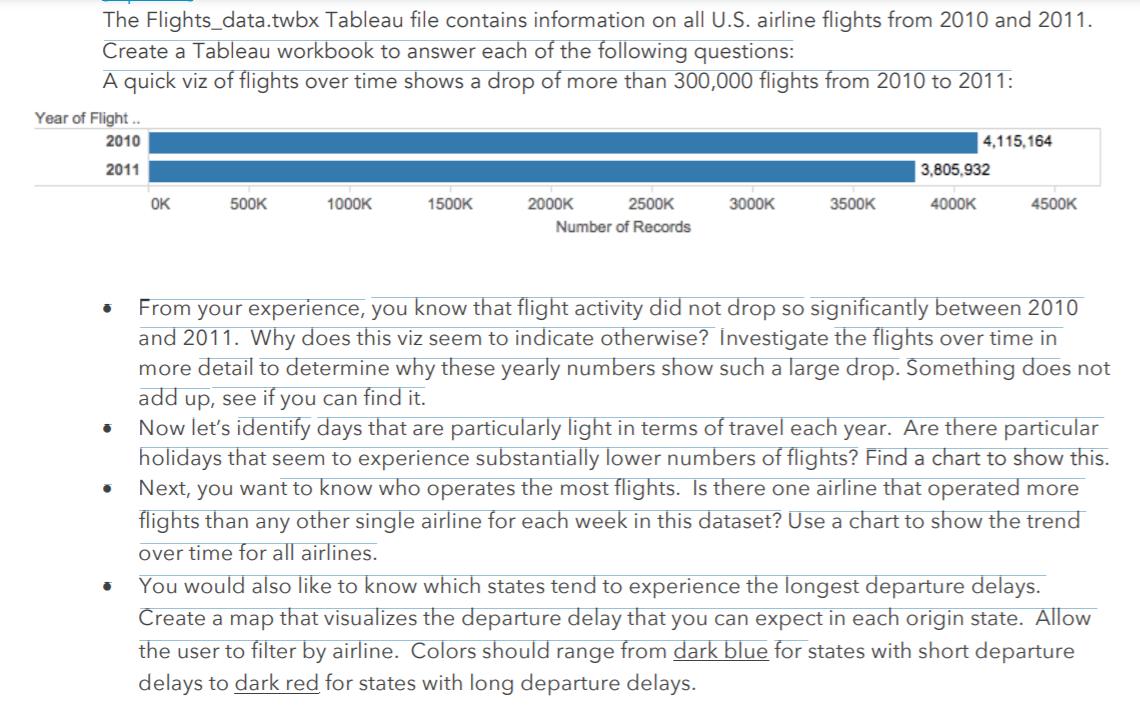
The Flights_data.twbx Tableau file contains information on all U.S. airline flights from 2010 and 2011. Create...
Fantastic news! We've Found the answer you've been seeking!
Question:
Expert Answer:

Related Book For 

Elementary Statistics
ISBN: 978-0538733502
11th edition
Authors: Robert R. Johnson, Patricia J. Kuby
Posted Date:
