

Hansson needs to evaluate a potential expansion opportunity. You (done individually), as a special consulting team...
Fantastic news! We've Found the answer you've been seeking!
Question:
Transcribed Image Text:
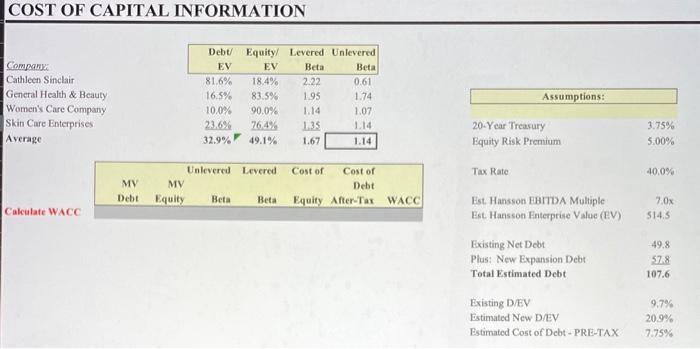
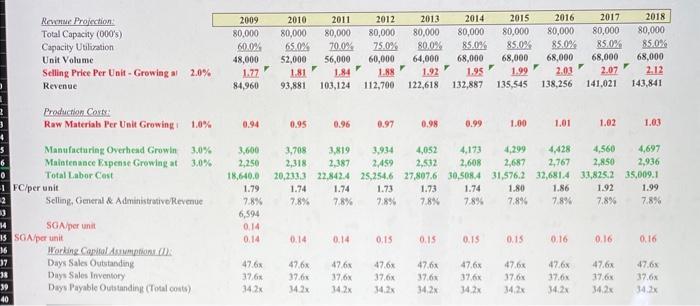
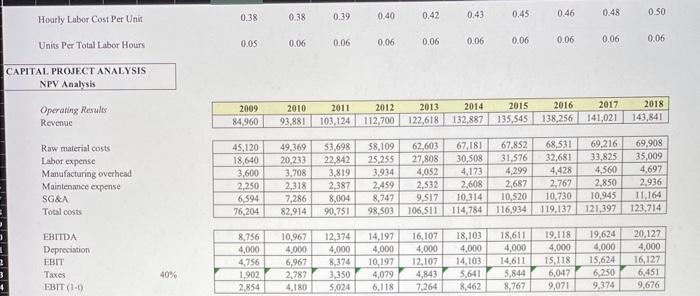
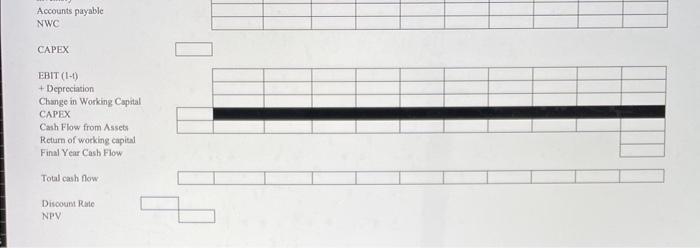
Hansson needs to evaluate a potential expansion opportunity. You (done individually), as a special consulting team Hansson hires, need to provide a sound recommendation to him in the end. Discussion Questions: 1. How does HPL's margins and leverage compare to its peers? 2. Are the projection assumptions made by Mr. Gates realistic? Would you suggest any changes and if so, why? 3. Calculate the WACC based on the new debt and equity level assuming the project moves forward. What discount rate for the project would you suggest and why? 4. Perform a sensitivity analysis on key inputs and how do they impact the results? 5. What recommendation would you make to Mr. Hansson regarding accepting or rejecting the expansion and why? Please use the below file for your analysis: COST OF CAPITAL INFORMATION Company Cathleen Sinclair General Health & Beauty Women's Care Company Skin Care Enterprises Average Calculate WACC Debt EV 81.6% 16.5% 10.0% 23.6% 32.9% Unlevered MV MV Debt Equity Beta Equity/ Levered Unlevered EV Beta 18.4% 83.5% 90.0% 76.4% 49.1% Leveredi 2.22 1.95 1.14 1.35 1.67 Cost of Beta 0.61 1.74 1.07 1.14 1.14 Cost of Debt Beta Equity After-Tax WACC Assumptions: 20-Year Treasury Equity Risk Premium Tax Rate Est. Hansson EBITDA Multiple Est. Hansson Enterprise Value (EV) Existing Net Debt Plus: New Expansion Debt Total Estimated Debt Existing D/EV Estimated New D/EV Estimated Cost of Debt-PRE-TAX 3.75% 5.00% 40.0% 7,0x 514.5 49.8 57.8 107.6 9.7% 20.9% 7.75% 5 Revenue Projection Total Capacity (000's) Capacity Utilization Unit Volume Selling Price Per Unit - Growing al 2.0% Revenue 37 Production Contr Raw Materials Per Unit Growing 6 0 1 FC/per unit 12 38 39 40 1.0% Manufacturing Overhead Growin 3.0% Maintenance Expense Growing at 3.0% Total Labor Cost 13 114 15 SGA/per unit 16 Selling, General & Administrative Revenue SGA/per unit Working Capital Assumptions (D Days Sales Outstanding Days Sales Inventory Days Payable Outstanding (Total costs) 2009 2010 80,000 80,000 60.0% 65.0% 52,000 48,000 1.77 84,960 3,600 2,250 18,640.0 1.79 7.8% 6,594 0.14 0.14 47.6x 37,6x 34.2x 1.81 1.84 93,881 103,124 0.95 1.74 7.8% 2011 2012 2013 2014 2015 2016 2017 2018 80,000 80,000 80,000 80,000 80,000 80,000 80,000 80,000 85.0% 85.0% 85.0% 85.0% 85.0% 70.0% 75.0% 80.0% 56,000 60,000 64,000 68,000 68,000 68,000 68,000 68,000 1.88 1.92 1.95 2.12 1.99 2.03 2.07 112,700 122,618 132,887 135,545 138,256 141,021 143,841 7 ▼ 0.14 47,6x 37.6x 34.2x 0.96 0.97 1.74 1.73 7.8% 7.8% 0.14 47,6x 37,6x 34.2x 3,708 3,819 3,934 4,428 4,560 4,697 4,052 4,173 4,299 2,532 2,608 2,687 2,767 2,850 2,318 2,387 2,459 2,936 20,233.3 22,842.4 25,254,6 27,807.6 30,508,4 31,576.2 32,681.4 33,825.2 35,009.1 0.15 0.98 47.6x 37,6x 34.2x 1.73 7.8% 0.15 0.99 47.6x 37.6x 34,2x 1.74 7.8% 1.00 0.15 1.80 7.8% 0.15 1.01 47.6x 47.6x 37,6x 37.6x 34,2x 34,2x F 0.16 1.02 1.86 1.92 7.8% 7.8% 47.6x 37.6x 34,2x 0.16 1.03 47.6x 37.6x 34,2x 1.99 7.8% 0.16 47.6x 37.6x 34.2x Hourly Labor Cost Per Unit Units Per Total Labor Hours CAPITAL PROJECT ANALYSIS NPV Analysis Operating Results Revenue Raw material costs Labor expense Manufacturing overhead Maintenance expense SG&A Total costs EBITDA Depreciation EBIT Taxes EBIT (1-0) 40% 0.38 0,05 2009 84,960 6,594 76,204 0.38 8,756 4,000 4,756 0.06 2010 93,881 45,120 49,369 18,640 3,600 2,250 0.39 10,967 4,000 6,967 1,902 2,787 2,854 0.06 53,698 22,842 20,233 3,708 3,819 2,318 2,387 7,286 82,914 2011 2012 103,124 112,700 8,004 90,751 0.40 0.06 3,350 4,180 5,024 0.42 0.06 2013 122,618 4,079 6,118 3,934 4,052 2,459 8,747 98,503 0.43 12,374 14,197 4,000 4,000 4,000 8,374 10,197 12,107 0.06 58,109 62,603 67,181 25,255 27,808 0.45 2014 2015 132,887 135,545 2,532 2,608 9,517 106,511 114,784 0.06 0.46 0.06 68,531 67,852 32,681 31,576 4,428 30,508 4,173 4,299 2,687 10,314 10,520 10,730 2,767 16,107 18,103 18,611 4,000 4,000 14,103 4,843 5,641 7,264 8,462 2016 138,256 0.48 0.06 2017 141,021 69,216 33,825 4,560 2,850 10,945 116,934 119,137 121,397 19,118 19,624 4,000 4,000 14,611 15,118 15,624 5,844 6,047 6,250 8,767 9,071 9,374 0.50 0.06 2018 143,841 69,908 35,009 4,697 2,936 11,164 123,714 20,127 4,000 16,127 6,451 9,676 Accounts payable NWC CAPEX EBIT (1-1) + Depreciation Change in Working Capital CAPEX Cash Flow from Assets Return of working capital Final Year Cash Flow Total cash flow Discount Rate NPV Hansson needs to evaluate a potential expansion opportunity. You (done individually), as a special consulting team Hansson hires, need to provide a sound recommendation to him in the end. Discussion Questions: 1. How does HPL's margins and leverage compare to its peers? 2. Are the projection assumptions made by Mr. Gates realistic? Would you suggest any changes and if so, why? 3. Calculate the WACC based on the new debt and equity level assuming the project moves forward. What discount rate for the project would you suggest and why? 4. Perform a sensitivity analysis on key inputs and how do they impact the results? 5. What recommendation would you make to Mr. Hansson regarding accepting or rejecting the expansion and why? Please use the below file for your analysis: COST OF CAPITAL INFORMATION Company Cathleen Sinclair General Health & Beauty Women's Care Company Skin Care Enterprises Average Calculate WACC Debt EV 81.6% 16.5% 10.0% 23.6% 32.9% Unlevered MV MV Debt Equity Beta Equity/ Levered Unlevered EV Beta 18.4% 83.5% 90.0% 76.4% 49.1% Leveredi 2.22 1.95 1.14 1.35 1.67 Cost of Beta 0.61 1.74 1.07 1.14 1.14 Cost of Debt Beta Equity After-Tax WACC Assumptions: 20-Year Treasury Equity Risk Premium Tax Rate Est. Hansson EBITDA Multiple Est. Hansson Enterprise Value (EV) Existing Net Debt Plus: New Expansion Debt Total Estimated Debt Existing D/EV Estimated New D/EV Estimated Cost of Debt-PRE-TAX 3.75% 5.00% 40.0% 7,0x 514.5 49.8 57.8 107.6 9.7% 20.9% 7.75% 5 Revenue Projection Total Capacity (000's) Capacity Utilization Unit Volume Selling Price Per Unit - Growing al 2.0% Revenue 37 Production Contr Raw Materials Per Unit Growing 6 0 1 FC/per unit 12 38 39 40 1.0% Manufacturing Overhead Growin 3.0% Maintenance Expense Growing at 3.0% Total Labor Cost 13 114 15 SGA/per unit 16 Selling, General & Administrative Revenue SGA/per unit Working Capital Assumptions (D Days Sales Outstanding Days Sales Inventory Days Payable Outstanding (Total costs) 2009 2010 80,000 80,000 60.0% 65.0% 52,000 48,000 1.77 84,960 3,600 2,250 18,640.0 1.79 7.8% 6,594 0.14 0.14 47.6x 37,6x 34.2x 1.81 1.84 93,881 103,124 0.95 1.74 7.8% 2011 2012 2013 2014 2015 2016 2017 2018 80,000 80,000 80,000 80,000 80,000 80,000 80,000 80,000 85.0% 85.0% 85.0% 85.0% 85.0% 70.0% 75.0% 80.0% 56,000 60,000 64,000 68,000 68,000 68,000 68,000 68,000 1.88 1.92 1.95 2.12 1.99 2.03 2.07 112,700 122,618 132,887 135,545 138,256 141,021 143,841 7 ▼ 0.14 47,6x 37.6x 34.2x 0.96 0.97 1.74 1.73 7.8% 7.8% 0.14 47,6x 37,6x 34.2x 3,708 3,819 3,934 4,428 4,560 4,697 4,052 4,173 4,299 2,532 2,608 2,687 2,767 2,850 2,318 2,387 2,459 2,936 20,233.3 22,842.4 25,254,6 27,807.6 30,508,4 31,576.2 32,681.4 33,825.2 35,009.1 0.15 0.98 47.6x 37,6x 34.2x 1.73 7.8% 0.15 0.99 47.6x 37.6x 34,2x 1.74 7.8% 1.00 0.15 1.80 7.8% 0.15 1.01 47.6x 47.6x 37,6x 37.6x 34,2x 34,2x F 0.16 1.02 1.86 1.92 7.8% 7.8% 47.6x 37.6x 34,2x 0.16 1.03 47.6x 37.6x 34,2x 1.99 7.8% 0.16 47.6x 37.6x 34.2x Hourly Labor Cost Per Unit Units Per Total Labor Hours CAPITAL PROJECT ANALYSIS NPV Analysis Operating Results Revenue Raw material costs Labor expense Manufacturing overhead Maintenance expense SG&A Total costs EBITDA Depreciation EBIT Taxes EBIT (1-0) 40% 0.38 0,05 2009 84,960 6,594 76,204 0.38 8,756 4,000 4,756 0.06 2010 93,881 45,120 49,369 18,640 3,600 2,250 0.39 10,967 4,000 6,967 1,902 2,787 2,854 0.06 53,698 22,842 20,233 3,708 3,819 2,318 2,387 7,286 82,914 2011 2012 103,124 112,700 8,004 90,751 0.40 0.06 3,350 4,180 5,024 0.42 0.06 2013 122,618 4,079 6,118 3,934 4,052 2,459 8,747 98,503 0.43 12,374 14,197 4,000 4,000 4,000 8,374 10,197 12,107 0.06 58,109 62,603 67,181 25,255 27,808 0.45 2014 2015 132,887 135,545 2,532 2,608 9,517 106,511 114,784 0.06 0.46 0.06 68,531 67,852 32,681 31,576 4,428 30,508 4,173 4,299 2,687 10,314 10,520 10,730 2,767 16,107 18,103 18,611 4,000 4,000 14,103 4,843 5,641 7,264 8,462 2016 138,256 0.48 0.06 2017 141,021 69,216 33,825 4,560 2,850 10,945 116,934 119,137 121,397 19,118 19,624 4,000 4,000 14,611 15,118 15,624 5,844 6,047 6,250 8,767 9,071 9,374 0.50 0.06 2018 143,841 69,908 35,009 4,697 2,936 11,164 123,714 20,127 4,000 16,127 6,451 9,676 Accounts payable NWC CAPEX EBIT (1-1) + Depreciation Change in Working Capital CAPEX Cash Flow from Assets Return of working capital Final Year Cash Flow Total cash flow Discount Rate NPV
Expert Answer:
Answer rating: 100% (QA)
ANSWER To provide a sound recommendation to Mr Hansson regarding the potential expansion opportunity lets address the discussion questions one by one 1 Comparison of HPLs margins and leverage to its p... View the full answer

Related Book For 
Management Accounting
ISBN: 9780730369387
4th Edition
Authors: Leslie G. Eldenburg, Albie Brooks, Judy Oliver, Gillian Vesty, Rodney Dormer, Vijaya Murthy, Nick Pawsey
Posted Date:
Students also viewed these finance questions
-
Managing Scope Changes Case Study Scope changes on a project can occur regardless of how well the project is planned or executed. Scope changes can be the result of something that was omitted during...
-
Read the case study "Southwest Airlines," found in Part 2 of your textbook. Review the "Guide to Case Analysis" found on pp. CA1 - CA11 of your textbook. (This guide follows the last case in the...
-
List three specific parts of the Case Guide, Objectives and Strategy Section (See below) that you had the most difficulty understanding. Describe your current understanding of these parts. Provide...
-
Discuss the ways that managed care organizations can infl uence the adoption of new technologies.
-
Ellison Company's balance sheet shows: Common stock, $20 par..............................$3,000,000 Paid-in capital in excess of par........................1,050,000 Retained...
-
a. Suppose that an instructor decides to add five points to every students exam score in a class. What effect would this have on the mean exam score for the class? On the median exam score? What...
-
1. Classify the following as either a revenue or a capital expenditure: a. Completed an addition to an office building for $250,000 cash. b. Paid $160 for the monthly cost of replacement filters on...
-
Worldwide Scientific Equipment is considering a cash acquisition of Medical Labs for $1.6 million. Medical Labs will provide the following pattern of cash inflows and synergistic benefits for the...
-
point(s) possible Submit test Identify a pattern in the list of numbers. Then use this pattern to find the next number. 26, 22, 18, 14, 10, OA. 4 B. 0 OC. 2 OD. 6
-
An international graduate student will receive a $28,000 foundation scholarship and reduced tuition. He must pay $1,500 in tuition for each of the autumn, winter, and spring quarters, and $500 in the...
-
Kelly Sassin and Sarah Conner are working on the following problem: There is a solid, insulating sphere (R =3 m) with a total charge of -20 C and with uniform charge density. What is the electric...
-
Explain the essence of the term professional ethics.
-
What are the different methods available for selecting a sample? What method would auditors normally prefer?
-
Discuss the factors that must be considered in determining sample size.
-
Describe the circumstances that are required for use of each of the two different types of qualified auditors reports.
-
Indicate the information that may be used by the auditor to determine the expected population deviation rate.
-
. 7'27 a Search ( Manual Homework... Ex 1 Gilden Company identi?es the following items for possible inclusion in the taking of a physical inventory. Indicate whether each item should be included...
-
In the synthesis of the keto acid just given, the dicarboxylic acid decarboxylates in a specific way; it gives Explain. HO rather than HO
-
Explain how cost data is sourced in a costing framework.
-
Each of the costs below is incurred by Fairgood & Hernandez, a small CPA firm. Required Identify whether each of the following costs most likely relates to an (i) organisation sustaining activity,...
-
SmallScale Publishing has just commenced business and will sell only one title, New to Business. Market analysis has indicated that sales for the next 6 months should be 5 000 copies. The accountant...
-
The partnership of Malle and Stine is considering three long-term capital in- vestment proposals. Relevant data on each project are as follows. Salvage value is expected to be zero at the end of each...
-
Wamser Service Center just purchased an automobile hoist for \($39,000\). The hoist has an 8-year life and an estimated salvage value of \($3,000\). Installation costs and freight charges were...
-
Sarah Kay is managing director of the City Day Care Center. City is currently set up as a lull-lime child care facility for children between the ages of 12 months and 6 years. Sarah Kay is trying to...

Study smarter with the SolutionInn App