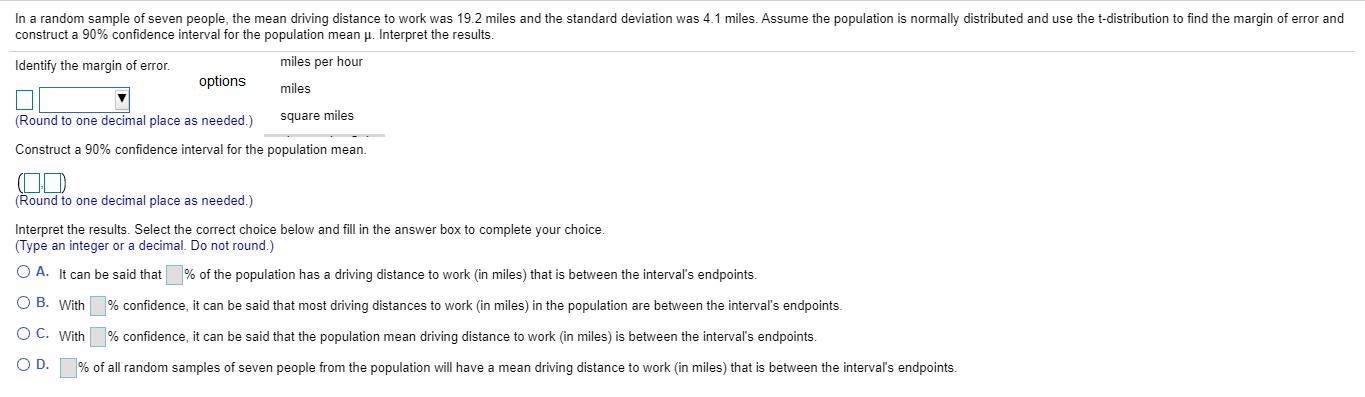
In a random sample of seven people, the mean driving distance to work was 19.2 miles...
Fantastic news! We've Found the answer you've been seeking!
Question:
Transcribed Image Text:
In a random sample of seven people, the mean driving distance to work was 19.2 miles and the standard deviation was 4.1 miles. Assume the population is normally distributed and use the t-distribution to find the margin of error and construct a 90% confidence interval for the population mean u. Interpret the results. Identify the margin of error. miles per hour options miles square miles (Round to one decimal place as needed.) Construct a 90% confidence interval for the population mean. (Round to one decimal place as needed.) Interpret the results. Select the correct choice below and fill in the answer box to complete your choice. (Type an integer or a decimal. Do not round.) O A. It can be said that % of the population has a driving distance to work (in miles) that is between the interval's endpoints. O B. With OC. With % confidence, it can be said that most driving distances to work (in miles) in the population are between the interval's endpoints. % confidence, it can be said that the population mean driving distance to work (in miles) is between the interval's endpoints. % of all random samples of seven people from the population will have a mean driving distance to work (in miles) that is between the interval's endpoints. OD. In a random sample of seven people, the mean driving distance to work was 19.2 miles and the standard deviation was 4.1 miles. Assume the population is normally distributed and use the t-distribution to find the margin of error and construct a 90% confidence interval for the population mean u. Interpret the results. Identify the margin of error. miles per hour options miles square miles (Round to one decimal place as needed.) Construct a 90% confidence interval for the population mean. (Round to one decimal place as needed.) Interpret the results. Select the correct choice below and fill in the answer box to complete your choice. (Type an integer or a decimal. Do not round.) O A. It can be said that % of the population has a driving distance to work (in miles) that is between the interval's endpoints. O B. With OC. With % confidence, it can be said that most driving distances to work (in miles) in the population are between the interval's endpoints. % confidence, it can be said that the population mean driving distance to work (in miles) is between the interval's endpoints. % of all random samples of seven people from the population will have a mean driving distance to work (in miles) that is between the interval's endpoints. OD.
Expert Answer:
Answer rating: 100% (QA)
Sample size n7 Mean x bar192miles Standard deviation s41 miles dfn1716 t c t 0... View the full answer
Related Book For
Elementary Statistics Picturing the World
ISBN: 978-0321911216
6th edition
Authors: Ron Larson, Betsy Farber
Posted Date:
Students also viewed these mathematics questions
-
An industrial psychologist selected a random sample of seven young urban professional couples who own their homes. The size of their home (square feet) is compared with that of their parents. At the...
-
In a random sample of 95 manufacturing firms, 67 indicated that their company attained ISO certification within the last two years. Find a 99% confidence interval for the population proportion of...
-
In a random sample of 120 large retailers, 85 used regression as a method of forecasting. In an independent random sample of 163 small retailers, 78 used regression as a method of forecasting. Find a...
-
1. Was 1MDB a fraudulent venture from the beginning? Why or why not? 2. How did the US Government become involved in the 1MDB saga? 3. What does the involvement of so many financial institutions in...
-
How does the concept of shared characteristics relate to the market segmentation process?
-
If L= x 2 dL dt dx 2 dy dL + y 1, 1 dt = 4, find dt when x = 15 and y = 8. dt (Simplify your answer.)
-
In Example 13-1, we assumed we were going to use all available solvent. There are other alternatives. Determine if the following alternatives are capable of producing outlet water of desired acetic...
-
1. Is fairness the economic basis for government laws and regulations designed to remedy market failures? If so, why; if not, what is the economic basis? 2. Explain, using precise economic...
-
Is it true that in order to prove a wrongful death you must establish preponderance of the evidence that at least 51 percent likely the death was wrongful
-
Each of the flowchart segments in Figure 3-24 is unstructured. Redraw each segment so that it does the same processes under the same conditions, but is structured. a. D Yes NO Yes B? E? No F H C. Yes...
-
Write a Python program to display a number in left, right, and center aligned with a width of 10. Left aligned (width 10) Right aligned (width 10) Center aligned (width 10). Original Number "22" 22...
-
Amy purchases equipment for $ 3 2 5 , 0 0 0 on January 1 , 2 0 2 4 . The equipment is expected to have a five - year life, with a residual value of $ 1 0 , 0 0 0 at the end of five years. Amy uses...
-
Acquiring versus Not Acquiring Alliance Partners As noted earlier, alliance partners with a high degree of network centrality benefit from being centrally located in a network of players. One debate...
-
What could be the key requirements that should be met with regard to procurement in South Africa?
-
Parker Plastic, Incorporated, manufactures plastic mats to use with rolling office chairs. Its standard cost information for last year follows: Standard Quantity Standard Price ( Rate ) Standard Unit...
-
The economy of South Africa has been in the doldrums for some time. Global uncertainty inadequate power supply and some structural constraints continue to hinder growth. These endogenous and...
-
The price of a non-dividend paying stock at time 1, S, is related to the price at time 0, So, as follows: S = us, with probability p and S =dS, with probability (1-p). The continuously compounded...
-
Write a paper about how diet relates to breast cancer in women study design to use: case control study purpose & rationale the purpose of this final project is to utilize the methods and...
-
In a study of bumblebee bats, one of the worlds smallest mammals, the weights were normally distributed, with a mean of 2.0 grams and a standard deviation of 0.25 gram. Find the probability that a...
-
A card is selected from a standard deck and replaced. This experiment is repeated a total of five times. Find the probability of selecting exactly three clubs. a. Identify a trial, a success, and a...
-
Use a pie chart to display the data set. Describe any patterns. Use the data set, which represents the results of a survey that asked U.S. adults where they would be at midnight when the new year...
-
As Example 6.8 clearly illustrates, the pdf of a random variable that is symmetric about the origin is not in general a valid reproducing kernel. Take two such iid random variables \(X\) and...
-
Given two Hilbert spaces \(\mathscr{H}\) and \(\mathscr{G}\), we call a mapping \(A: \mathscr{H} ightarrow \mathscr{G}\) a Hilbert space isomorphism if it is (i) a linear map; that is, \(A(a f+b...
-
Let \(\mathbf{X}\) be an \(n \times p\) model matrix. Show that \(\mathbf{X}^{\top} \mathbf{X}+n \gamma \mathbf{I} \mathbf{I}_{p}\) for \(\gamma>0\) is invertible.
Study smarter with the SolutionInn App