

A. Group project: (20 Marks) In next sheets, you have the income statement and financial position...
Fantastic news! We've Found the answer you've been seeking!
Question:
Transcribed Image Text:
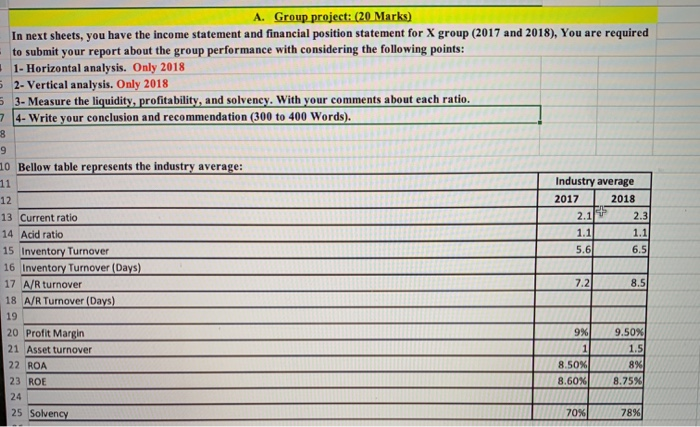
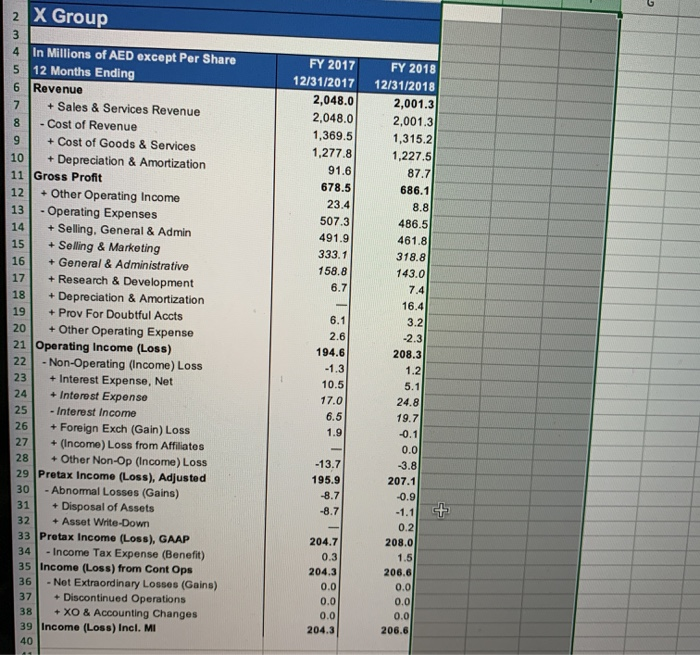
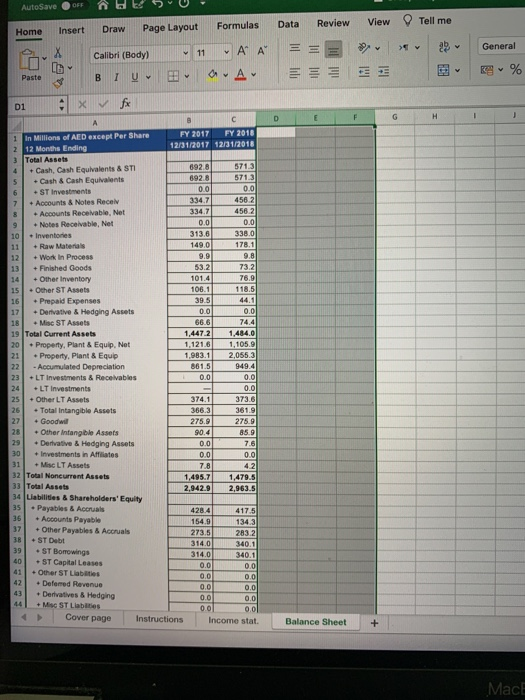
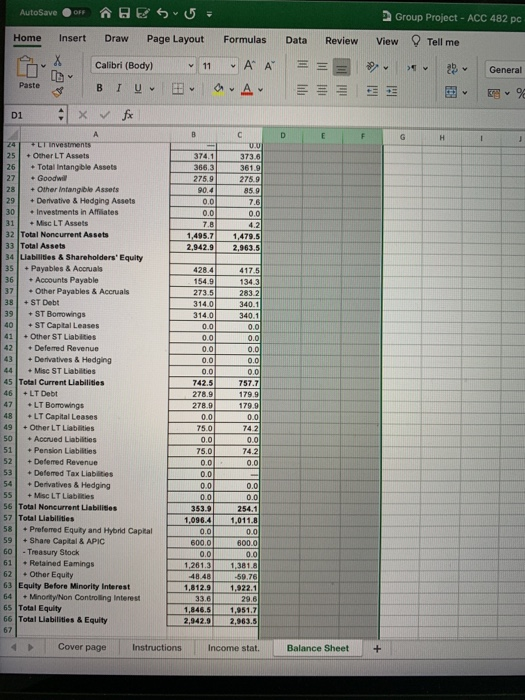
A. Group project: (20 Marks) In next sheets, you have the income statement and financial position statement for X group (2017 and 2018), You are required to submit your report about the group performance with considering the following points: 1- Horizontal analysis. Only 2018 5 2- Vertical analysis. Only 2018 53- Measure the liquidity, profitability, and solvency. With your comments about each ratio. 7 4-Write your conclusion and recommendation (300 to 400 Words). 8 9 10 Bellow table represents the industry average: 11 12 13 Current ratio 14 Acid ratio 15 Inventory Turnover 16 Inventory Turnover (Days) 17 A/R turnover 18 A/R Turnover (Days) 19 20 Profit Margin 21 Asset turnover 22 ROA 23 ROE 24 25 Solvency Industry average 2017 2018 2.1 1.1 5.6 7.2 9% 1 8.50% 8.60% 70% 2.3 1.1 6.5 8.5 9.50% 1.5 8% 8.75% 78% 2 X Group 3 4 In Millions of AED except Per Share 5 12 Months Ending 6 7 8 9 10 11 Gross Profit 12 13 14 15 16 17 18 19 20 + Other Operating Expense 21 Operating Income (Loss) 22 -Non-Operating (Income) Loss 23 24 25 26 27 Revenue + Sales & Services Revenue - Cost of Revenue + Cost of Goods & Services + Depreciation & Amortization + Interest Expense, Net + Interest Expense - Interest Income + Foreign Exch (Gain) Loss + (Income) Loss from Affiliates 28 + Other Non-Op (Income) Loss 29 Pretax Income (Loss), Adjusted 30 - Abnormal Losses (Gains) 31 + Disposal of Assets 32 + Asset Write-Down 33 Pretax Income (Loss), GAAP 34 - Income Tax Expense (Benefit) Income (Loss) from Cont Ops 35 36 - Net Extraordinary Losses (Gains) 37 + Discontinued Operations 38 + XO & Accounting Changes 39 Income (Loss) Incl. MI 40 NN MM. wwwww + Other Operating Income - Operating Expenses + Selling, General. Admin + Selling & Marketing + General & Administrative + Research & Development + Depreciation & Amortization + Prov For Doubtful Accts FY 2017 12/31/2017 2,048.0 2,048.0 1,369.5 1,277.8 91.6 678.5 23.4 507.3 491.9 333.1 158.8 6.7 - 6.1 2.6 194.6 -1.3 10.5 17.0 6.5 1.9 -13.7 195.9 -8.7 -8.7 204.7 0.3 204.3 0.0 0.0 0.0 204.3 FY 2018 12/31/2018 2,001.3 2,001.3 1,315.2 1,227.5 87.7 686.1 8.8 486.5 461.8 318.8 143.0 7.4 16.4 3.2 -2.3 208.3 1.2 5.1 24.8 19.7 -0.1 0.0 -3.8 207.1 -0.9 -1.1 0.2 208.0 1.5 206.6 0.0 0.0 0.0 206.6 52 5 Home Insert 1 2 D1 3 4 5 6 7 8 9 10 11 12 13 14 15 AutoSave OFF 16 17 18 Paste 22 23 24 25 26 27 28 29 30 Ib V 36 37 38 39 40 41 42 43 X ✓ fx A In Millions of AED except Per Share 12 Months Ending + Raw Materials + Work In Process + Finished Goods + Prepaid Expenses + Derivative & Hedging Assets + Misc ST Assets 19 Total Current Assets Draw Page Layout Calibri (Body) I UV Total Assets + Cash, Cash Equivalents & STI + Cash & Cash Equivalents +ST Investments + Accounts & Notes Receiv + Accounts Receivable, Net + Notes Receivable, Net + Inventories + Other Inventory + Other ST Assets B 20 + Property, Plant & Equip, Net 21 +LT Investments + Other LT Assets + Property, Plant & Equip - Accumulated Depreciation +LT Investments & Receivables + Total Intangible Assets + Goodwill + Other Intangible Assets + Derivative & Hedging Assets + Investments in Affiliates 31 +Misc LT Assets 32 Total Noncurrent Assets 33 Total Assets 34 Liabilities & Shareholders' Equity 35 + Payables & Accruals + Accounts Payable + Other Payables & Accruals + ST Debt +ST Borrowings +ST Capital Leases + Other ST Liabilities + Deferred Revenue + Derivatives & Hedging +Misc ST Liabilities Cover page 6:0 V Instructions 11 692.8 692.8 B с FY 2017 FY 2018 12/31/2017 12/31/2018 au 0.0 334.7 334.7 0.0 313.6 149.0 9.9 53.2 101.4 106.1 39.5 0.0 66.6 1,447.2 1,121.6 1,983.1 861.5 0.0 374.1 366.3 275.9 90.4 0.0 0.0 7.8 1,495.7 2,942.9 Formulas 428.4 154.9 273.5 314.0 314.0 ν Α' Α' Αν 0.0 0.0 0.0 0.0 0.0 571.3 571.3 0.0 456.2 456.2 0.0 338.0 178.1 9.8 73.2 76.9 118.5 44.1 0.0 74.4 1,484.0 1,105.9 2,055.3 949.4 0.0 0.0 373.6 361.9 275.9 85.9 7.6 0.0 4.2 1,479.5 2,963.5 417.5 134.3 283.2 340.1 340.1 0.0 0.0 0.0 0.0 0.0 Income stat. Data D Review EE E Balance Sheet F View V E + > v G Tell me H V V I General V % J MacE AutoSave Home Insert X Paste D1 39 40 41 OFF P Calibri (Body) B IU x ✓ fx A 24 25 26 27 28 29 30 31 + Misc LT Assets 32 Total Noncurrent Assets +LI Investments + Other LT Assets + Total Intangible Assets + Goodwill Draw Page Layout Formulas • Α' Α' + Other Intangible Assets + Derivative & Hedging Assets + Investments in Affiliates 33 Total Assets 34 Liabilities & Shareholders' Equity 35 + Payables & Accruals 36 + Accounts Payable 37 + Other Payables & Accruals 38 + ST Debt + ST Borrowings + ST Capital Leases + Other ST Liabilities + Deferred Revenue + Derivatives & Hedging + Misc ST Liabilities 4>> 42 43 44 45 Total Current Liabilities 46 +LT Debt 47 48 49 50 +LT Borrowings +LT Capital Leases + Other LT Liabilities + Accrued Liabilities + Pension Liabilities + Deferred Revenue 51 52 53 + Deferred Tax Liabilities 54 + Derivatives & Hedging 55 +Misc LT Liabilities 56 Total Noncurrent Liabilities 57 Total Liabilities 58 59 60 61 62 63 Equity Before Minority Interest 64 + Minority/Non Controlling Interest 65 Total Equity 66 Total Liabilities & Equity 67 + Preferred Equity and Hybrid Capital + Share Capital & APIC - Treasury Stock + Retained Eamings + Other Equity Cover page Instructions = V 11 B 374.1 366.3 1-A5 275.9 90.4 0.0 0.0 7.8 1,495.7 2,942.9 428.4 154.9 273.5 314.0 314.0 0.0 0.0 0.0 0.0 0.0 742.5 278.9 278.9 0.0 75.0 0.0 75.0 0.0 0.0 0.0 0.0 353.9 1,096.4 0.0 600.0 0.0 C U.U 373.6 361.9 275.9 85.9 7.6 0.0 4.2 1,479.5 2,963.5 417.5 134.3 283.2 340.1 340.1 0.0 0.0 0.0 0.0 0.0 757.7 179.9 179.9 0.0 74.2 0.0 74.2 0.0 0.0 0.0 254.1 1,011.8 0.0 600.0 0.0 1,261.3 1,381.8 48.48 -59.76 1,812.9 1,922.1 33.6 29.6 1,846.5 1,951.7 2,942.9 2,963.5 Income stat. Data D Review E E Balance Sheet F Group Project - ACC 482 pc View Tell me 29 V ME + G > H V 1 General % J A. Group project: (20 Marks) In next sheets, you have the income statement and financial position statement for X group (2017 and 2018), You are required to submit your report about the group performance with considering the following points: 1- Horizontal analysis. Only 2018 5 2- Vertical analysis. Only 2018 53- Measure the liquidity, profitability, and solvency. With your comments about each ratio. 7 4-Write your conclusion and recommendation (300 to 400 Words). 8 9 10 Bellow table represents the industry average: 11 12 13 Current ratio 14 Acid ratio 15 Inventory Turnover 16 Inventory Turnover (Days) 17 A/R turnover 18 A/R Turnover (Days) 19 20 Profit Margin 21 Asset turnover 22 ROA 23 ROE 24 25 Solvency Industry average 2017 2018 2.1 1.1 5.6 7.2 9% 1 8.50% 8.60% 70% 2.3 1.1 6.5 8.5 9.50% 1.5 8% 8.75% 78% 2 X Group 3 4 In Millions of AED except Per Share 5 12 Months Ending 6 7 8 9 10 11 Gross Profit 12 13 14 15 16 17 18 19 20 + Other Operating Expense 21 Operating Income (Loss) 22 -Non-Operating (Income) Loss 23 24 25 26 27 Revenue + Sales & Services Revenue - Cost of Revenue + Cost of Goods & Services + Depreciation & Amortization + Interest Expense, Net + Interest Expense - Interest Income + Foreign Exch (Gain) Loss + (Income) Loss from Affiliates 28 + Other Non-Op (Income) Loss 29 Pretax Income (Loss), Adjusted 30 - Abnormal Losses (Gains) 31 + Disposal of Assets 32 + Asset Write-Down 33 Pretax Income (Loss), GAAP 34 - Income Tax Expense (Benefit) Income (Loss) from Cont Ops 35 36 - Net Extraordinary Losses (Gains) 37 + Discontinued Operations 38 + XO & Accounting Changes 39 Income (Loss) Incl. MI 40 NN MM. wwwww + Other Operating Income - Operating Expenses + Selling, General. Admin + Selling & Marketing + General & Administrative + Research & Development + Depreciation & Amortization + Prov For Doubtful Accts FY 2017 12/31/2017 2,048.0 2,048.0 1,369.5 1,277.8 91.6 678.5 23.4 507.3 491.9 333.1 158.8 6.7 - 6.1 2.6 194.6 -1.3 10.5 17.0 6.5 1.9 -13.7 195.9 -8.7 -8.7 204.7 0.3 204.3 0.0 0.0 0.0 204.3 FY 2018 12/31/2018 2,001.3 2,001.3 1,315.2 1,227.5 87.7 686.1 8.8 486.5 461.8 318.8 143.0 7.4 16.4 3.2 -2.3 208.3 1.2 5.1 24.8 19.7 -0.1 0.0 -3.8 207.1 -0.9 -1.1 0.2 208.0 1.5 206.6 0.0 0.0 0.0 206.6 52 5 Home Insert 1 2 D1 3 4 5 6 7 8 9 10 11 12 13 14 15 AutoSave OFF 16 17 18 Paste 22 23 24 25 26 27 28 29 30 Ib V 36 37 38 39 40 41 42 43 X ✓ fx A In Millions of AED except Per Share 12 Months Ending + Raw Materials + Work In Process + Finished Goods + Prepaid Expenses + Derivative & Hedging Assets + Misc ST Assets 19 Total Current Assets Draw Page Layout Calibri (Body) I UV Total Assets + Cash, Cash Equivalents & STI + Cash & Cash Equivalents +ST Investments + Accounts & Notes Receiv + Accounts Receivable, Net + Notes Receivable, Net + Inventories + Other Inventory + Other ST Assets B 20 + Property, Plant & Equip, Net 21 +LT Investments + Other LT Assets + Property, Plant & Equip - Accumulated Depreciation +LT Investments & Receivables + Total Intangible Assets + Goodwill + Other Intangible Assets + Derivative & Hedging Assets + Investments in Affiliates 31 +Misc LT Assets 32 Total Noncurrent Assets 33 Total Assets 34 Liabilities & Shareholders' Equity 35 + Payables & Accruals + Accounts Payable + Other Payables & Accruals + ST Debt +ST Borrowings +ST Capital Leases + Other ST Liabilities + Deferred Revenue + Derivatives & Hedging +Misc ST Liabilities Cover page 6:0 V Instructions 11 692.8 692.8 B с FY 2017 FY 2018 12/31/2017 12/31/2018 au 0.0 334.7 334.7 0.0 313.6 149.0 9.9 53.2 101.4 106.1 39.5 0.0 66.6 1,447.2 1,121.6 1,983.1 861.5 0.0 374.1 366.3 275.9 90.4 0.0 0.0 7.8 1,495.7 2,942.9 Formulas 428.4 154.9 273.5 314.0 314.0 ν Α' Α' Αν 0.0 0.0 0.0 0.0 0.0 571.3 571.3 0.0 456.2 456.2 0.0 338.0 178.1 9.8 73.2 76.9 118.5 44.1 0.0 74.4 1,484.0 1,105.9 2,055.3 949.4 0.0 0.0 373.6 361.9 275.9 85.9 7.6 0.0 4.2 1,479.5 2,963.5 417.5 134.3 283.2 340.1 340.1 0.0 0.0 0.0 0.0 0.0 Income stat. Data D Review EE E Balance Sheet F View V E + > v G Tell me H V V I General V % J MacE AutoSave Home Insert X Paste D1 39 40 41 OFF P Calibri (Body) B IU x ✓ fx A 24 25 26 27 28 29 30 31 + Misc LT Assets 32 Total Noncurrent Assets +LI Investments + Other LT Assets + Total Intangible Assets + Goodwill Draw Page Layout Formulas • Α' Α' + Other Intangible Assets + Derivative & Hedging Assets + Investments in Affiliates 33 Total Assets 34 Liabilities & Shareholders' Equity 35 + Payables & Accruals 36 + Accounts Payable 37 + Other Payables & Accruals 38 + ST Debt + ST Borrowings + ST Capital Leases + Other ST Liabilities + Deferred Revenue + Derivatives & Hedging + Misc ST Liabilities 4>> 42 43 44 45 Total Current Liabilities 46 +LT Debt 47 48 49 50 +LT Borrowings +LT Capital Leases + Other LT Liabilities + Accrued Liabilities + Pension Liabilities + Deferred Revenue 51 52 53 + Deferred Tax Liabilities 54 + Derivatives & Hedging 55 +Misc LT Liabilities 56 Total Noncurrent Liabilities 57 Total Liabilities 58 59 60 61 62 63 Equity Before Minority Interest 64 + Minority/Non Controlling Interest 65 Total Equity 66 Total Liabilities & Equity 67 + Preferred Equity and Hybrid Capital + Share Capital & APIC - Treasury Stock + Retained Eamings + Other Equity Cover page Instructions = V 11 B 374.1 366.3 1-A5 275.9 90.4 0.0 0.0 7.8 1,495.7 2,942.9 428.4 154.9 273.5 314.0 314.0 0.0 0.0 0.0 0.0 0.0 742.5 278.9 278.9 0.0 75.0 0.0 75.0 0.0 0.0 0.0 0.0 353.9 1,096.4 0.0 600.0 0.0 C U.U 373.6 361.9 275.9 85.9 7.6 0.0 4.2 1,479.5 2,963.5 417.5 134.3 283.2 340.1 340.1 0.0 0.0 0.0 0.0 0.0 757.7 179.9 179.9 0.0 74.2 0.0 74.2 0.0 0.0 0.0 254.1 1,011.8 0.0 600.0 0.0 1,261.3 1,381.8 48.48 -59.76 1,812.9 1,922.1 33.6 29.6 1,846.5 1,951.7 2,942.9 2,963.5 Income stat. Data D Review E E Balance Sheet F Group Project - ACC 482 pc View Tell me 29 V ME + G > H V 1 General % J
Expert Answer:
Answer rating: 100% (QA)
12 a Horizontal Analysis 2017 2018 H Verti Revenue 20480 20013 2280 100 Gross Profit 6785 6861 1120 3428 Operating Income 1946 2083 7040 1040 Pretax I... View the full answer

Related Book For 
Posted Date:
Students also viewed these accounting questions
-
The professors at Wilfrid Laurier University are required to submit their final exams to the registrars office 10 days before the end of the semester. The exam coordinator sampled 20 professors and...
-
The following data are taken from the income statement and balance sheet of Keaner Machinery, Inc.: Using this information, prepare a partial statement of cash flows for the year ended December 31,...
-
A company's profit appears directly on the income statement and the statement of owner's equity. It is also included indirectly in the company's balance sheet. Do you agree or disagree? Explain.
-
A 15.00 g metal sphere was found to have a diameter of 1.85 cm. The volume of a sphere is V = (4/3)r. Calculate the density of the sphere and assuming that the sphere is made out of one of the...
-
Two hours ago, the temperature was 8F. The temperature is now -4F. a. What is the change in temperature for the past two hours? b. Estimate the change in temperature for the past hour. c. Explain why...
-
Verify that the given function y is a solution of the differential equation that follows it. Assume that C, C 1 , and C 2 are arbitrary constants. y = C 1 e -x + C 2 e x ; y"(x) - y = 0
-
Toner Corporation computed the following taxable income and loss: 2020 taxable income, \(\$ 10,000\) and 2021 taxable loss, \(\$ 40,000\). At the end of 2021 , Toner made the following estimates:...
-
The following two items appeared on the Internet concerning the GAAP requirement to expense stock options. WASHINGTON, D.C.February 17, 2005 Congressman David Dreier (RCA), Chairman of the House...
-
ABC, Inc., is considering purchase of a new equipment. The expected sales are expected to be $5,753,216. The annual cash operating expenses are expected to be $2,538,059. The annual depreciation is...
-
Following are unadjusted balances along with year-end adjustments for Quinlan Company. Complete the adjusted trial balance by entering the adjusted balance for each of the following accounts....
-
In 250 words or more please complete the following discussion question by paraphrasing your textbook Imagine that you are training others to work with people who are terminally ill or in grief....
-
An employee of Kindler Orthopedics stole thousands of dollars from the company: Suppose Kindler has installed a new system of internal controls. As a consultant for Kindler Orthopedics, write a memo...
-
Navarro Company's Cash account shows an ending balance of \(\$ 770\). The bank statement shows a \(\$ 20\) service charge and an NSF check for \(\$ 100\). A \(\$ 250\) deposit is in transit, and...
-
Supplies has a $6,000 unadjusted balance on your trial balance. At year-end you count supplies of $2,000. What adjustment will appear on your work sheet? a. Supplies. 4,000 Supplies Expense.. 4,000...
-
Which columns of the work sheet show net income? a. Trial Balance b. Adjustments c. Income Statement d. Both b and c
-
Diedre Chevis sells furniture for DuBois Furniture Company. Chevis is having financial problems and takes \(\$ 500\) that she received from a customer. She rang up the sale through the cash register....
-
Lehman Dairy leases its milkingequipment from Chavez Finance Company under the following leaseterms.The lease term is 8 years,noncancelable, and requires equal rental payments due at thebe 2 answers
-
ABC company leased new advanced computer equipment to STU Ltd on 1 January 2019.STULtd has to pay annual rental of $290,000 starting at 1 January 2019. It is a four years lease with ultimate rental...
-
Judging from rising enrollments there are more people attending colleges and niversities. However, does this include students going on their masters and doctoral degrees? Is there enough statistical...
-
Are there differences between men and women in terms of the completion of their highest degree? Use a graphical method to answer the question.
-
The amount of money television networks charge the advertisers is very much dependent on how many people see the commercials. Thus, any decrease in viewers is a problem. Is there a downward trend in...
-
In 1998, the Board of Directors of Lively Plays Inc. fired George Drewerson, the co- founder and another senior management representative of the company, claiming that they had engaged in fraudulent...
-
Garth Cooks Company has a book net worth of \($7,500\). Long-term debt is \($1,500.\) Net working capital, other than cash, is \($2,250\). Fixed assets are \($2,000.\) How much cash does the company...
-
Pags Products has projected the following sales for the coming year: Sales in the year following this one are projected to be 15 percent greater in each quarter. a. Calculate payments to suppliers...

Study smarter with the SolutionInn App