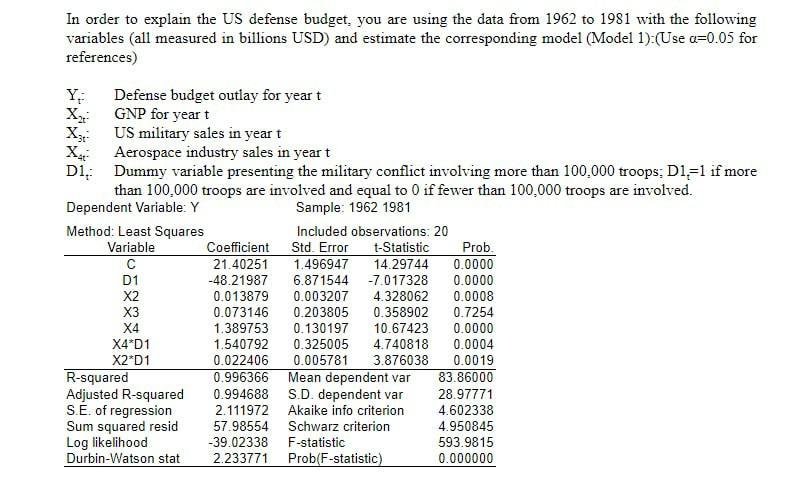
In order to explain the US defense budget, you are using the data from 1962 to...
Fantastic news! We've Found the answer you've been seeking!
Question:
Transcribed Image Text:
In order to explain the US defense budget, you are using the data from 1962 to 1981 with the following variables (all measured in billions USD) and estimate the corresponding model (Model 1):(Use a=0.05 for references) Defense budget outlay for year t US military sales in year t Y: Xx GNP for year t X X D Aerospace industry sales in year t Dummy variable presenting the military conflict involving more than 100,000 troops; D1-1 if more than 100,000 troops are involved and equal to 0 if fewer than 100,000 troops are involved. Dependent Variable: Y Method: Least Squares Sample: 1962 1981 Included observations: 20 Variable Coefficient Std. Error t-Statistic Prob. 21.40251 1.496947 14.29744 0.0000 D1 -48.21987 6.871544 -7.017328 0.0000 X2 0.013879 0.003207 4.328062 0.0008 X3 0.073146 0.203805 0.358902 0.7254 X4 1.389753 0.130197 10.67423 0.0000 X4*D1 1.540792 0.325005 4.740818 0.0004 X2*D1 0.022406 0.005781 3.876038 0.0019 R-squared 0.996366 Mean dependent var 83.86000 Adjusted R-squared 0.994688 S.D. dependent var 28.97771 S.E. of regression 2.111972 Akaike info criterion 4.602338 Sum squared resid 57.98554 Schwarz criterion 4.950845 Log likelihood -39.02338 Durbin-Watson stat 2.233771 F-statistic Prob(F-statistic) 593.9815 0.000000 1. [10]Explain the meaning of each estimated coefficient and R in the above model. 2. [10] Test for significance of each independent variable and test for overall significance of the model. 3. [15]Conduct the test of autocorrelation in the model using the information above. State clearly the conditions to apply this test? If those conditions are not met, name other tests you can use instead. 4. [10] When GNP increases by 1 bil USD (other variables unchanged), what is the confidence interval of the difference in the changing levels of defense budget between the cases of there are more than 100,000 or fewer than 100,000 troops involved in the military conflict? 5. [20]For the case when there are fewer than 100,000 troops involving in the conflict (this condition indicates that we are concerning on the coefficients of X2 and X4 only), if we simultaneously increase X2 and X4 by 1 billions USD, test the proposition that the defense budget will increase 1.4 billions USD. What is the confidence interval for the increase in the level of defense budget in this case? (The covariance between two estimated coefficients of 2 variables X2 and X4 is -0.00036). Result (1) Result (2) 6 5 3 2 1 | 1 - 2 N Series: Residuals Sample 1962 1961 Observations 20 Mean -1.13E-14 Median 0.140813 Maximum 2.855637 Minimum -3.215228 Std. Dev. 1.746960 Skewness -0.218699 Kurtosis 2.211793 Jarque-Bera 0.677155 Probability 0.712783 White Heteroskedasticity Test (No cross term) F-statistic Obs*R-squared 2.379399 Probability 0.114212 15.31799 Probability 0.168397 Result (3) Breusch-Godfrey Serial Correlation LM Test: AR(2) F-statistic Obs*R-squared 1.950537 Probability 0.188349 5.235963 Probability 0.072950 Result (4) Ramsey RESET Test: F-statistic 2.110154 Probability 0.119102 Log likelihood ratio 7.432899 Probability 0.059308 In order to explain the US defense budget, you are using the data from 1962 to 1981 with the following variables (all measured in billions USD) and estimate the corresponding model (Model 1):(Use a=0.05 for references) Defense budget outlay for year t US military sales in year t Y: Xx GNP for year t X X D Aerospace industry sales in year t Dummy variable presenting the military conflict involving more than 100,000 troops; D1-1 if more than 100,000 troops are involved and equal to 0 if fewer than 100,000 troops are involved. Dependent Variable: Y Method: Least Squares Sample: 1962 1981 Included observations: 20 Variable Coefficient Std. Error t-Statistic Prob. 21.40251 1.496947 14.29744 0.0000 D1 -48.21987 6.871544 -7.017328 0.0000 X2 0.013879 0.003207 4.328062 0.0008 X3 0.073146 0.203805 0.358902 0.7254 X4 1.389753 0.130197 10.67423 0.0000 X4*D1 1.540792 0.325005 4.740818 0.0004 X2*D1 0.022406 0.005781 3.876038 0.0019 R-squared 0.996366 Mean dependent var 83.86000 Adjusted R-squared 0.994688 S.D. dependent var 28.97771 S.E. of regression 2.111972 Akaike info criterion 4.602338 Sum squared resid 57.98554 Schwarz criterion 4.950845 Log likelihood -39.02338 Durbin-Watson stat 2.233771 F-statistic Prob(F-statistic) 593.9815 0.000000 1. [10]Explain the meaning of each estimated coefficient and R in the above model. 2. [10] Test for significance of each independent variable and test for overall significance of the model. 3. [15]Conduct the test of autocorrelation in the model using the information above. State clearly the conditions to apply this test? If those conditions are not met, name other tests you can use instead. 4. [10] When GNP increases by 1 bil USD (other variables unchanged), what is the confidence interval of the difference in the changing levels of defense budget between the cases of there are more than 100,000 or fewer than 100,000 troops involved in the military conflict? 5. [20]For the case when there are fewer than 100,000 troops involving in the conflict (this condition indicates that we are concerning on the coefficients of X2 and X4 only), if we simultaneously increase X2 and X4 by 1 billions USD, test the proposition that the defense budget will increase 1.4 billions USD. What is the confidence interval for the increase in the level of defense budget in this case? (The covariance between two estimated coefficients of 2 variables X2 and X4 is -0.00036). Result (1) Result (2) 6 5 3 2 1 | 1 - 2 N Series: Residuals Sample 1962 1961 Observations 20 Mean -1.13E-14 Median 0.140813 Maximum 2.855637 Minimum -3.215228 Std. Dev. 1.746960 Skewness -0.218699 Kurtosis 2.211793 Jarque-Bera 0.677155 Probability 0.712783 White Heteroskedasticity Test (No cross term) F-statistic Obs*R-squared 2.379399 Probability 0.114212 15.31799 Probability 0.168397 Result (3) Breusch-Godfrey Serial Correlation LM Test: AR(2) F-statistic Obs*R-squared 1.950537 Probability 0.188349 5.235963 Probability 0.072950 Result (4) Ramsey RESET Test: F-statistic 2.110154 Probability 0.119102 Log likelihood ratio 7.432899 Probability 0.059308
Expert Answer:
Answer rating: 100% (QA)
The estimated model Model 1 for the US defense budget based on the provided data is as follows Y 214... View the full answer
Related Book For
Posted Date:
Students also viewed these mathematics questions
-
Planning is one of the most important management functions in any business. A front office managers first step in planning should involve determine the departments goals. Planning also includes...
-
U.S. defense budget outlays, 19621981. In order to explain the U.S. defense budget, you are asked to consider the following model: Y t = β 1 + β 2 X 2t + β 3 X 3t...
-
This is similar to Section 2.2 Problem 28: Use algebraic simplifications to find the limit. Use a fraction. 2x-6 lim x+3x-9 =
-
Refer to the DaisyMate data set. Prepare a standard cost income statement for the company's management. Assume that sales were $480,000 and actual marketing and administrative expenses were $76,500....
-
This problem asks you to prepare one-and five-year financial forecasts and conduct some sensitivity analysis and scenario analysis for Aquatic Supplies Company. A spreadsheet containing the company's...
-
Raoult's law is found to be quite satisfactory for a (a) Dilute solution (b) Ideal solution (c) Non-ideal solution (d) Perfect gas.
-
The charges to Work in Process?Assembly Department for a period, together with information concerning production, are as follows. All direct materials are placed in process at the beginning of...
-
A thin film of glycerin ( n = 1.473) of thickness 497 nm with air on both sides is illuminated with white light at near normal incidence. What wavelengths will be strongly reflected in the range 300...
-
The links of the chain are made steel that has a working stress of 300 MPa in tension. If the chain is to support the force P = 45 kN, determine the smallest safe diameter d of the links. P
-
1. void setup () {}, it means * A. Setup is required B. Setup is not required C. None D. More ____________ 2. int ledPin=8, it means * A. Move the cursor to the first of the string printed above B....
-
Wits Ventilation Company Ltd (WVC) is a company that specializes in the manufacture of ventilation systems for shopping centres and other commercial buildings. WVC manufactures all of the ducting as...
-
Three-lens systems. In the figure, stick figure O (the object) stands on the common central axis of three thin, symmetric lenses, which are mounted in the boxed regions. Lens 1 is mounted within the...
-
The mass shown in figure 1 is resting on a frictionless horizontal table (meaning that it can move in the plane of the sheet, not just along the axis shown on the figure). Each of the two identical...
-
Assume all resistors (A-F) are lightbulbs with the same resistance. Construct models to compare the power (brightness) in each resistor Construct a Voltage vs Length model to show the voltage at all...
-
(10 pts) An overzealous physics student claims she can climbs an 9.5 - m vertical rope in 6s at a constant speed. What is her power output?
-
Three pairs of diagrams are shown below: in each case, a single point charge is located at the origin of eight lines, A-H, and two other point charges, 1 and 2, are given. All of these show the...
-
Subtract the polynomials. (-x+x-5) - (x-x + 5)
-
From annual data for the years 19681987, the following regression results were obtained: Y t = 859.92 + 0.6470X 2t 23.195X 3t R 2 = 0.9776 (1) Y t = 261.09 + 0.2452X 2t R 2 = 0.9388...
-
Consider the following model: Y i = 1 + 2 D i + u i Where D i = 0 for the first 20 observations and D i = 1 for the remaining 30 observations. You are also told that var (u 2 i ) = 300. a. How...
-
Let YX and XY represent the slopes in the regression of Y on X and X on Y, respectively. Show that YX XY = r 2 Where r is the coefficient of correlation between X and Y.
-
The steel rod has a radius of 1.25 in. If it is subjected to a shear of \(V=5\) kip, determine the maximum shear stress. 1.25 in. V-5 kip
-
A member has a cross section in the form of an equilateral triangle. If it is subjected to a shear force \(\mathbf{V}\), determine the maximum average shear stress in the member using the shear...
-
The beam is constructed from two boards fastened together at the top and bottom with three rows of nails spaced every 8 in. If each nail can support a \(300-\) lb shear force, determine the maximum...
Study smarter with the SolutionInn App