

In this assignment, we will leverage JavaScript arrays and objects to help us explore a dataset containing
Question:
In this assignment, we will leverage JavaScript arrays and objects to help us explore a dataset containing real-world data. Since each person has their own interests, each student will be able to choose their own dataset and to both view the records in the dataset as well as calculate interesting values based on the data.
Objectives
Here is what we'd like you take out of this assignment.
Course
- Apply JavaScript to a web page to make it more interactive.
Assignment
- To group together JavaScript objects in an array for each access and then to access elements in the array by position.
- To parse through non-trivial JavaScript objects accessing properties on the object.
- To analyze the structure of JavaScript objects and then to perform rudimentary operations upon groups of those objects.
Getting Started with the Corgis Datasets
As mentioned above, each person will be able to pick the dataset they wish to work with in this assignment. The Corgis Website (Collection of Really Great, Interesting, Situated Datasets) has several datasets to choose from, in the format that we need for this assignment. You can pick a dataset at the following location: https://corgis-edu.github.io/corgis/json/. You should notice the following on this page:
- Each dataset is using the JSON format and can be downloaded as a file with a ".json" extension.
- Each dataset is organized by topic and when clicking on a dataset you are given a description of the types of properties that are available in records within the dataset.
To start out you should make a decision on which dataset is of interest to you. You should then:
- Download the associated JSON file.
- Open the JSON file in a text editor and look through the contents of the file.
JSON-formatted Files
As you can see the JSON format is very similar to JavaScript-object notation. The difference is that each property on an object must be within quotes. JSON files can contain a single object or an array of objects, as you can see in your Corgis dataset. This file format is very popular as a data-interchange format, being used to pass data from program to program. In a similar way we have downloaded the data in a JSON file and will be using the objects defined in that file in our program.
To convert your file into something that can be used within your program you should do the following:
- Create a new project for this assignment.
- Create a new JavaScript file called data.js.
- Copy all text from the Corgis JSON file to your data.js file.
- Then assign the array defined in the data.js file to a new variable at the top of the file. For example:
Note: These files can be quite large and might cause your computer or IDE to slow down when editing the file. Feel free to delete excess elements within the array, but make sure you should leave at least a minimum of 100 elements within the array.
Showing the Dataset on Your Web Page
The top of your web page should include the following details:
- The name of your dataset.
- A description of your dataset (the Corgis website provides this information).
- The number of elements in the dataset. This number should be programmatically entered into the page. That way if the data changes, the web page is still accurate.
Your web page should then provide a group of elements on the page that display a single record in the dataset. The fields should adhere to the following rules:
- The fields should be grouped together.
- Each field should have a name before the value in the record.
- While there are many object properties in the Corgis datasets, you should pick from the object 6-7 fields of interest to display for a single object.
Here is an example of what this part of your page may look like:
The left and right buttons on the page should move between the records of the array by keeping track of the position of the current record. The program should then update the page by altering the elements in the bottom part of the page so that they have the current record's properties.
For example, if the user pressed the next button three times the program would show the fourth element in the array:
Similarly, if the user then pressed the previous button twice the program would show the second element in the array:
To help get you started with this, you have been provided with a starter script which can be found here. This script has several parts:
- The script first selects the buttons on the page (with id next and previous).
- The script adds event handlers that respond when you click both buttons.
- The script stores a global index variable that holds the index in the array with your data in the data.js file.
- The display method is then called to show the record at the position within the index variable on the page.
Here is the starter script for reference:
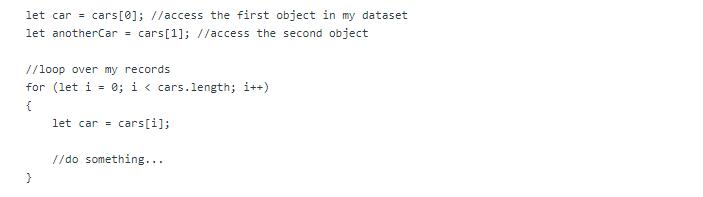
Accessing the Array of Dataset Values
As mentioned above, your data.js file creates a global array that holds your dataset elements. You will need to load this script within your HTML file before you try to access the array in the starter script above. Order matters here. Your HTML page should look like the following:
With the scripts declared as above, you can access your array variable within the starter script. For example:
Hint: Working with Objects
You should recall that there are two ways to access a property on a JavaScript object. You can use:
- dot notation: for example car.driver
- square-bracket notation: for example car["driver"]
Due to the spaces within the names of parameters in the Corgis datasets, you will need to use square bracket notation to access a property on an object. For example, given the following object properties:
You would use the notation below to access the height property:

Showing Interesting Facts!
After the user is able to browse through the records of your dataset, you should add a sidebar to your web page. This side area should display interesting facts about the dataset records. For example:
The requirements for this area are the following:
- You should have at least three facts that you show about your data.
- The values these facts are based on should be programmatically entered into the page.This will require you to write loops and to inspect the elements of your array to determine the values.
- Note: These calculated values are underlined in the screenshot above.
- Your calculations should include different types of operations on the dataset. For example, showing three averages in this section just shows you know how to copy-paste code. Instead, each fact should be derived using different properties and different operations.
- Note: If you're not sure if your facts are following this last rule, then please ask your instructor and they will provide guidance.
Cleaning Up Your Work
Lastly, clean up your web page and make sure that it has the usual TLC with respect to your styles (spacing, images, fonts, colors, etc...). Here is an example website to give you inspiration:
Requirements
Any submissions ignoring the following requirements will be forced to resubmit their work.
- You should not make any changes to the dataset you received from Corgis. Any attempts to simplify the objects in the dataset will not receive credit.
Expert Answer:


Management Science The Art of Modeling with Spreadsheets
ISBN: 978-1118582695
4th edition
Authors: Stephen G. Powell, Kenneth R. Baker
