

Walmart's Ratio Analysis Required: Comment on the Walmart's 3-year trends in the following liquidity, solvency, and...
Fantastic news! We've Found the answer you've been seeking!
Question:
Transcribed Image Text:
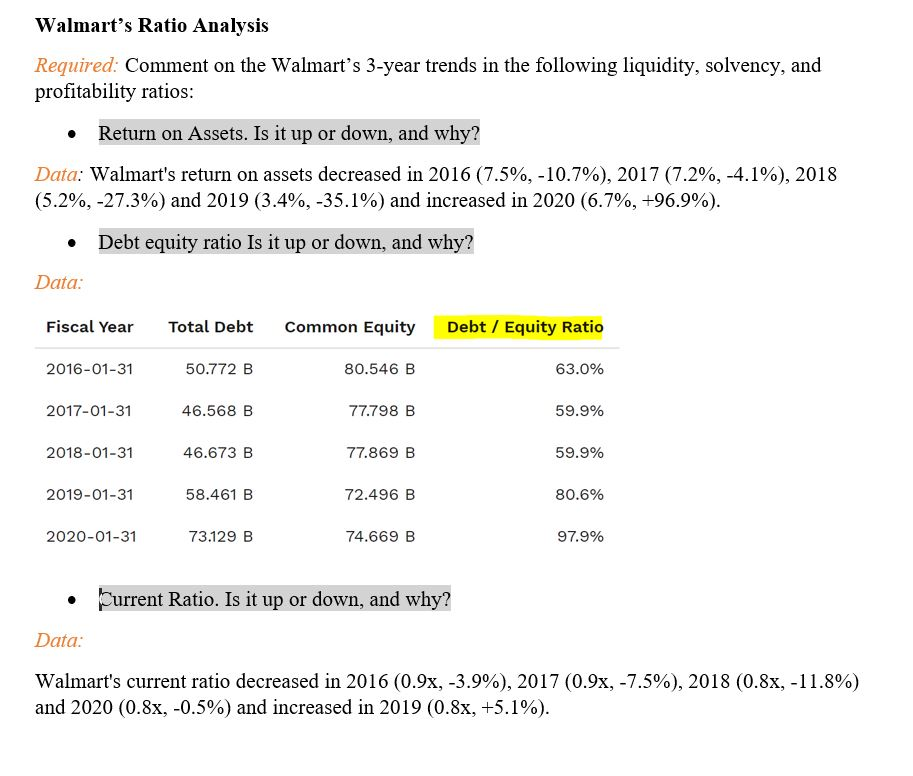
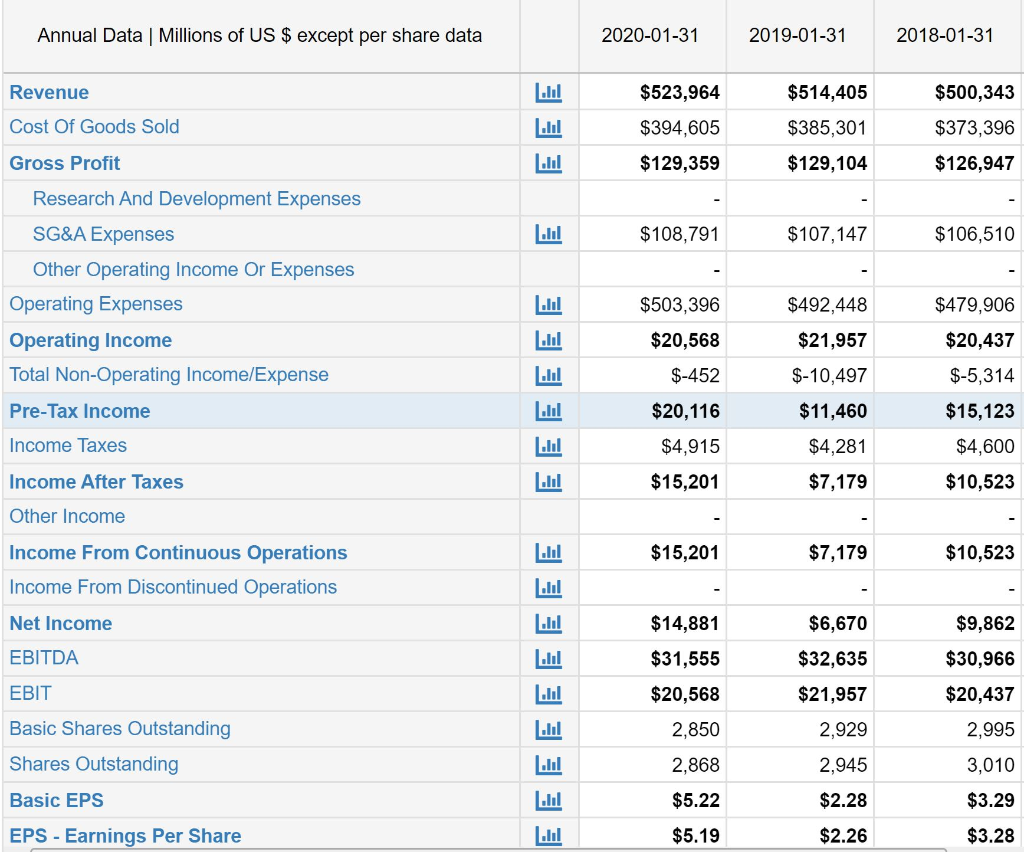
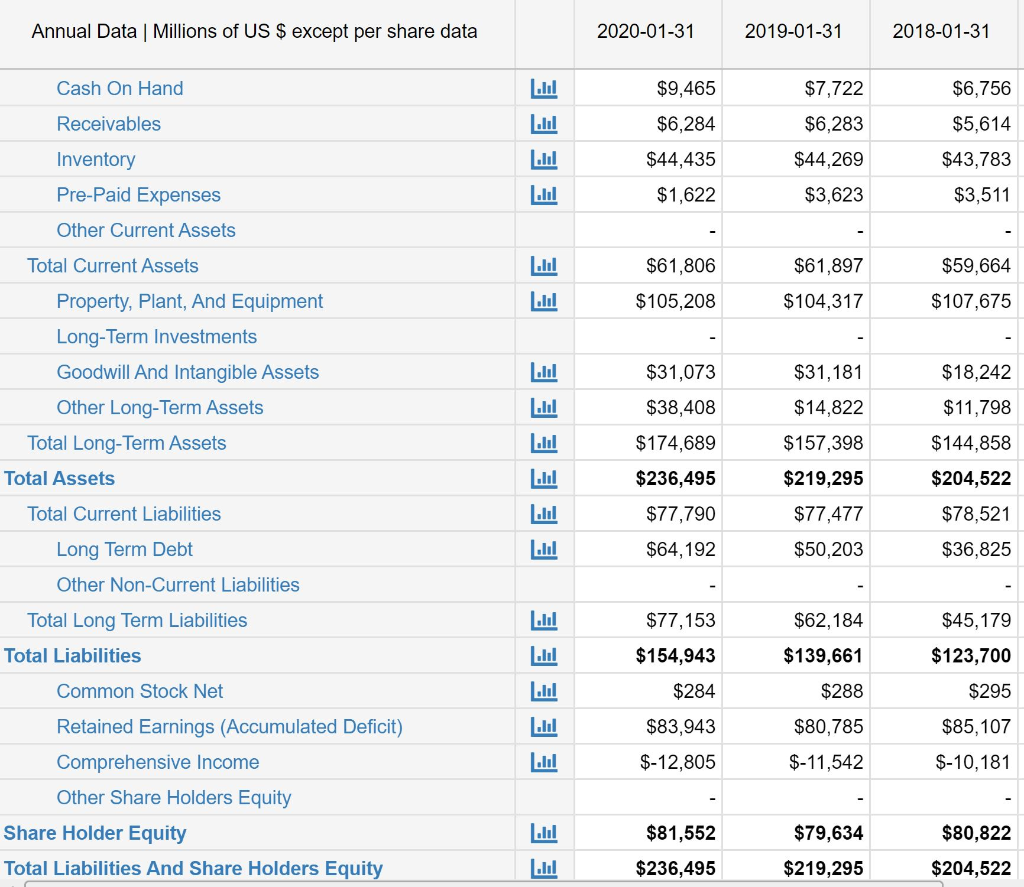
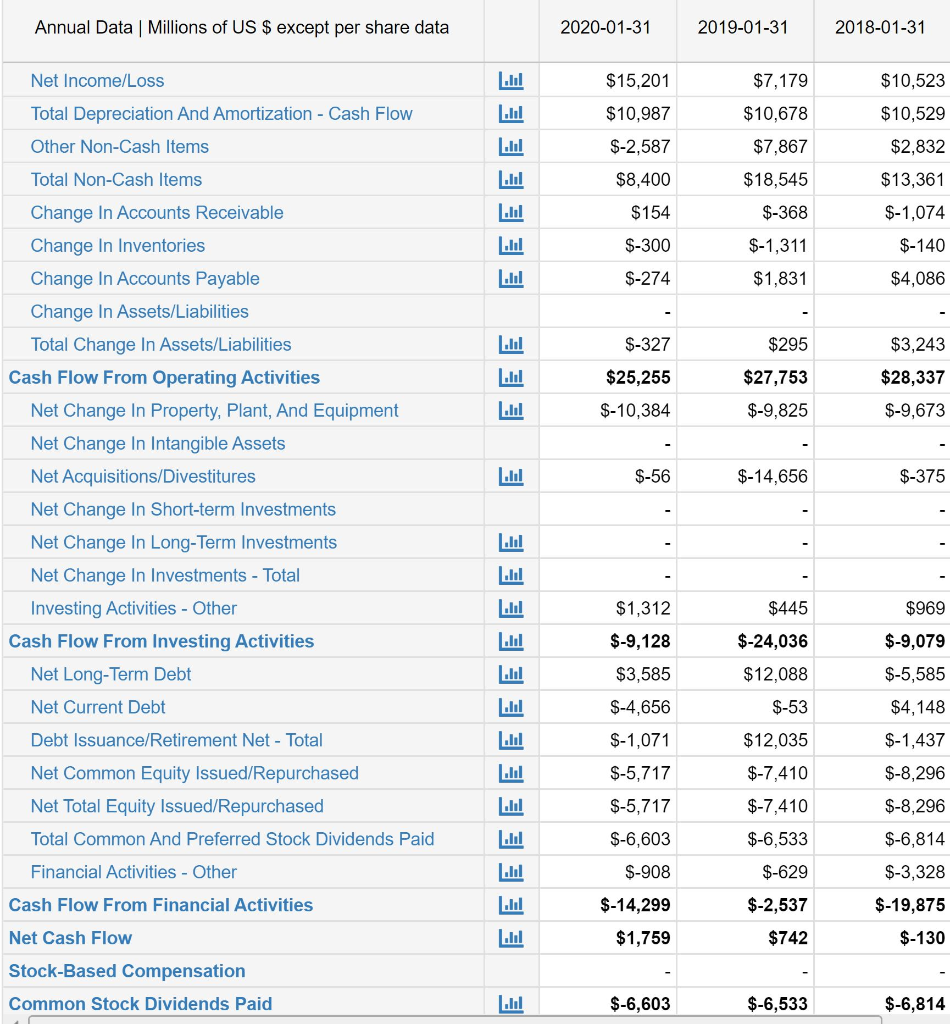
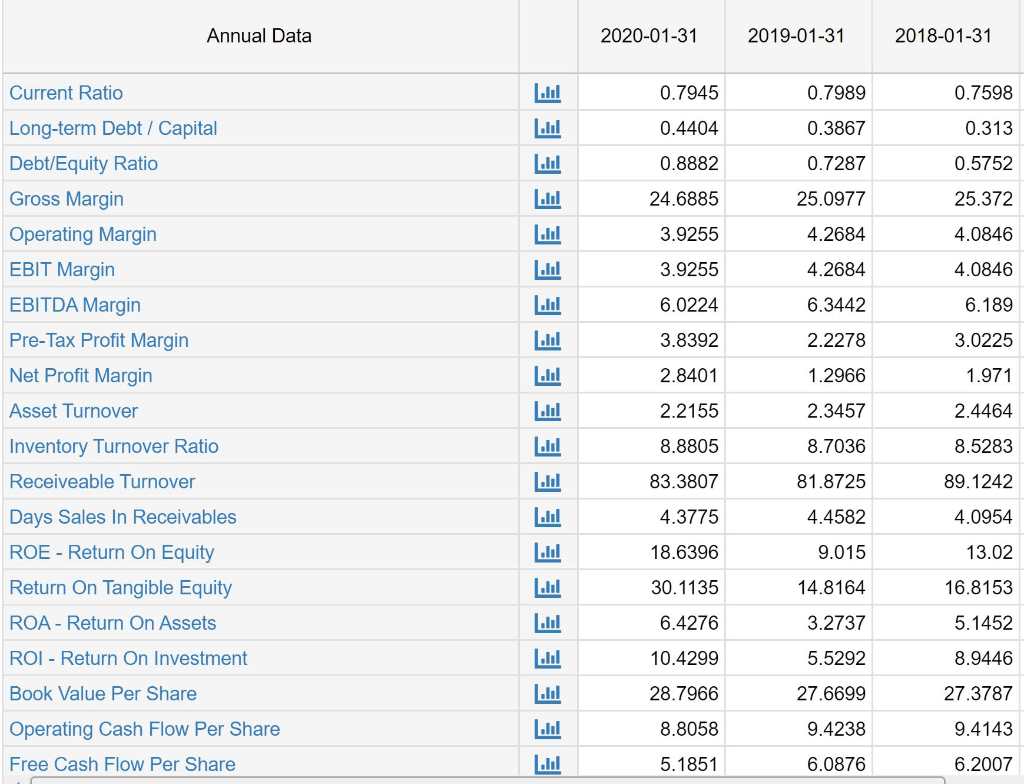
Walmart's Ratio Analysis Required: Comment on the Walmart's 3-year trends in the following liquidity, solvency, and profitability ratios: • Return on Assets. Is it up or down, and why? Data: Walmart's return on assets decreased in 2016 (7.5%, -10.7%), 2017 (7.2%, -4.1%), 2018 (5.2%, -27.3%) and 2019 (3.4%, -35.1%) and increased in 2020 (6.7%, +96.9%). Debt equity ratio Is it up or down, and why? Data: Fiscal Year 2016-01-31 2017-01-31 2018-01-31 2019-01-31 2020-01-31 Total Debt 50.772 B 46.568 B 46.673 B 58.461 B 73.129 B Common Equity 80.546 B 77.798 B 77.869 B 72.496 B 74.669 B Debt / Equity Ratio • Current Ratio. Is it up or down, and why? Data: 63.0% 59.9% 59.9% 80.6% 97.9% Walmart's current ratio decreased in 2016 (0.9x, -3.9%), 2017 (0.9x, -7.5%), 2018 (0.8x, -11.8%) and 2020 (0.8x, -0.5%) and increased in 2019 (0.8x, +5.1%). Annual Data | Millions of US $ except per share data Revenue Cost Of Goods Sold Gross Profit Research And Development Expenses SG&A Expenses Other Operating Income Or Expenses Operating Expenses Operating Income Total Non-Operating Income/Expense Pre-Tax Income Income Taxes Income After Taxes Other Income Income From Continuous Operations Income From Discontinued Operations Net Income EBITDA EBIT Basic Shares Outstanding Shares Outstanding Basic EPS EPS - Earnings Per Share EEE 3 Lul EEEEEE EEE ..... EEEEE 2020-01-31 $523,964 $394,605 $129,359 $108,791 $503,396 $20,568 $-452 $20,116 $4,915 $15,201 $15,201 $14,881 $31,555 $20,568 2,850 2,868 $5.22 $5.19 2019-01-31 $514,405 $385,301 $129,104 $107,147 $492,448 $21,957 $-10,497 $11,460 $4,281 $7,179 $7,179 $6,670 $32,635 $21,957 2,929 2,945 $2.28 $2.26 2018-01-31 $500,343 $373,396 $126,947 $106,510 $479,906 $20,437 $-5,314 $15,123 $4,600 $10,523 - $10,523 $9,862 $30,966 $20,437 2,995 3,010 $3.29 $3.28 Annual Data | Millions of US $ except per share data Cash On Hand Receivables Inventory Pre-Paid Expenses Other Current Assets Total Current Assets Property, Plant, And Equipment Long-Term Investments Goodwill And Intangible Assets Other Long-Term Assets Total Long-Term Assets Total Assets Total Current Liabilities Long Term Debt Other Non-Current Liabilities Total Long Term Liabilities Total Liabilities Common Stock Net Retained Earnings (Accumulated Deficit) Comprehensive Income Other Share Holders Equity Share Holder Equity Total Liabilities And Share Holders Equity EEEE EE EEEEEE 3 3 3 3 3 EE 2020-01-31 $9,465 $6,284 $44,435 $1,622 $61,806 $105,208 $31,073 $38,408 $174,689 $236,495 $77,790 $64,192 $77,153 $154,943 $284 $83,943 $-12,805 $81,552 $236,495 2019-01-31 $7,722 $6,283 $44,269 $3,623 $61,897 $104,317 $31,181 $14,822 $157,398 $219,295 $77,477 $50,203 $62,184 $139,661 $288 $80,785 $-11,542 $79,634 $219,295 2018-01-31 $6,756 $5,614 $43,783 $3,511 $59,664 $107,675 $18,242 $11,798 $144,858 $204,522 $78,521 $36,825 $45,179 $123,700 $295 $85,107 $-10,181 $80,822 $204,522 Annual Data | Millions of US $ except per share data Net Income/Loss Total Depreciation And Amortization - Cash Flow Other Non-Cash Items Total Non-Cash Items Change In Accounts Receivable Change In Inventories Change In Accounts Payable Change In Assets/Liabilities Total Change In Assets/Liabilities Cash Flow From Operating Activities Net Change In Property, Plant, And Equipment Net Change In Intangible Assets Net Acquisitions/Divestitures Net Change In Short-term Investments Net Change In Long-Term Investments Net Change In Investments - Total Investing Activities - Other Cash Flow From Investing Activities Net Long-Term Debt Net Current Debt Debt Issuance/Retirement Net - Total Net Common Equity Issued/Repurchased Net Total Equity Issued/Repurchased Total Common And Preferred Stock Dividends Paid Financial Activities - Other Cash Flow From Financial Activities Net Cash Flow Stock-Based Compensation Common Stock Dividends Paid EEEEEEE EEE E الا EEEEE الا اسا L.M اسا الا ... اسا اسا E 2020-01-31 $15,201 $10,987 $-2,587 $8,400 $154 $-300 $-274 $-327 $25,255 $-10,384 $-56 $1,312 $-9,128 $3,585 $-4,656 $-1,071 $-5,717 $-5,717 $-6,603 $-908 $-14,299 $1,759 $-6,603 2019-01-31 $7,179 $10,678 $7,867 $18,545 $-368 $-1,311 $1,831 $295 $27,753 $-9,825 $-14,656 $445 $-24,036 $12,088 $-53 $12,035 $-7,410 $-7,410 $-6,533 $-629 $-2,537 $742 $-6,533 2018-01-31 $10,523 $10,529 $2,832 $13,361 $-1,074 $-140 $4,086 $3,243 $28,337 $-9,673 $-375 $969 $-9,079 $-5,585 $4,148 $-1,437 $-8,296 $-8,296 $-6,814 $-3,328 $-19,875 $-130 $-6,814 Annual Data Current Ratio Long-term Debt / Capital Debt/Equity Ratio Gross Margin Operating Margin EBIT Margin EBITDA Margin Pre-Tax Profit Margin Net Profit Margin Asset Turnover Inventory Turnover Ratio Receiveable Turnover Days Sales In Receivables ROE - Return On Equity Return On Tangible Equity ROA - Return On Assets ROI - Return On Investment Book Value Per Share Operating Cash Flow Per Share Free Cash Flow Per Share EEEEEE سا 1.bl ..... لسا لا Lul .... لا L.h .... ..... EEE 2020-01-31 0.7945 0.4404 0.8882 24.6885 3.9255 3.9255 6.0224 3.8392 2.8401 2.2155 8.8805 83.3807 4.3775 18.6396 30.1135 6.4276 10.4299 28.7966 8.8058 5.1851 2019-01-31 0.7989 0.3867 0.7287 25.0977 4.2684 4.2684 6.3442 2.2278 1.2966 2.3457 8.7036 81.8725 4.4582 9.015 14.8164 3.2737 5.5292 27.6699 9.4238 6.0876 2018-01-31 0.7598 0.313 0.5752 25.372 4.0846 4.0846 6.189 3.0225 1.971 2.4464 8.5283 89.1242 4.0954 13.02 16.8153 5.1452 8.9446 27.3787 9.4143 6.2007 Walmart's Ratio Analysis Required: Comment on the Walmart's 3-year trends in the following liquidity, solvency, and profitability ratios: • Return on Assets. Is it up or down, and why? Data: Walmart's return on assets decreased in 2016 (7.5%, -10.7%), 2017 (7.2%, -4.1%), 2018 (5.2%, -27.3%) and 2019 (3.4%, -35.1%) and increased in 2020 (6.7%, +96.9%). Debt equity ratio Is it up or down, and why? Data: Fiscal Year 2016-01-31 2017-01-31 2018-01-31 2019-01-31 2020-01-31 Total Debt 50.772 B 46.568 B 46.673 B 58.461 B 73.129 B Common Equity 80.546 B 77.798 B 77.869 B 72.496 B 74.669 B Debt / Equity Ratio • Current Ratio. Is it up or down, and why? Data: 63.0% 59.9% 59.9% 80.6% 97.9% Walmart's current ratio decreased in 2016 (0.9x, -3.9%), 2017 (0.9x, -7.5%), 2018 (0.8x, -11.8%) and 2020 (0.8x, -0.5%) and increased in 2019 (0.8x, +5.1%). Annual Data | Millions of US $ except per share data Revenue Cost Of Goods Sold Gross Profit Research And Development Expenses SG&A Expenses Other Operating Income Or Expenses Operating Expenses Operating Income Total Non-Operating Income/Expense Pre-Tax Income Income Taxes Income After Taxes Other Income Income From Continuous Operations Income From Discontinued Operations Net Income EBITDA EBIT Basic Shares Outstanding Shares Outstanding Basic EPS EPS - Earnings Per Share EEE 3 Lul EEEEEE EEE ..... EEEEE 2020-01-31 $523,964 $394,605 $129,359 $108,791 $503,396 $20,568 $-452 $20,116 $4,915 $15,201 $15,201 $14,881 $31,555 $20,568 2,850 2,868 $5.22 $5.19 2019-01-31 $514,405 $385,301 $129,104 $107,147 $492,448 $21,957 $-10,497 $11,460 $4,281 $7,179 $7,179 $6,670 $32,635 $21,957 2,929 2,945 $2.28 $2.26 2018-01-31 $500,343 $373,396 $126,947 $106,510 $479,906 $20,437 $-5,314 $15,123 $4,600 $10,523 - $10,523 $9,862 $30,966 $20,437 2,995 3,010 $3.29 $3.28 Annual Data | Millions of US $ except per share data Cash On Hand Receivables Inventory Pre-Paid Expenses Other Current Assets Total Current Assets Property, Plant, And Equipment Long-Term Investments Goodwill And Intangible Assets Other Long-Term Assets Total Long-Term Assets Total Assets Total Current Liabilities Long Term Debt Other Non-Current Liabilities Total Long Term Liabilities Total Liabilities Common Stock Net Retained Earnings (Accumulated Deficit) Comprehensive Income Other Share Holders Equity Share Holder Equity Total Liabilities And Share Holders Equity EEEE EE EEEEEE 3 3 3 3 3 EE 2020-01-31 $9,465 $6,284 $44,435 $1,622 $61,806 $105,208 $31,073 $38,408 $174,689 $236,495 $77,790 $64,192 $77,153 $154,943 $284 $83,943 $-12,805 $81,552 $236,495 2019-01-31 $7,722 $6,283 $44,269 $3,623 $61,897 $104,317 $31,181 $14,822 $157,398 $219,295 $77,477 $50,203 $62,184 $139,661 $288 $80,785 $-11,542 $79,634 $219,295 2018-01-31 $6,756 $5,614 $43,783 $3,511 $59,664 $107,675 $18,242 $11,798 $144,858 $204,522 $78,521 $36,825 $45,179 $123,700 $295 $85,107 $-10,181 $80,822 $204,522 Annual Data | Millions of US $ except per share data Net Income/Loss Total Depreciation And Amortization - Cash Flow Other Non-Cash Items Total Non-Cash Items Change In Accounts Receivable Change In Inventories Change In Accounts Payable Change In Assets/Liabilities Total Change In Assets/Liabilities Cash Flow From Operating Activities Net Change In Property, Plant, And Equipment Net Change In Intangible Assets Net Acquisitions/Divestitures Net Change In Short-term Investments Net Change In Long-Term Investments Net Change In Investments - Total Investing Activities - Other Cash Flow From Investing Activities Net Long-Term Debt Net Current Debt Debt Issuance/Retirement Net - Total Net Common Equity Issued/Repurchased Net Total Equity Issued/Repurchased Total Common And Preferred Stock Dividends Paid Financial Activities - Other Cash Flow From Financial Activities Net Cash Flow Stock-Based Compensation Common Stock Dividends Paid EEEEEEE EEE E الا EEEEE الا اسا L.M اسا الا ... اسا اسا E 2020-01-31 $15,201 $10,987 $-2,587 $8,400 $154 $-300 $-274 $-327 $25,255 $-10,384 $-56 $1,312 $-9,128 $3,585 $-4,656 $-1,071 $-5,717 $-5,717 $-6,603 $-908 $-14,299 $1,759 $-6,603 2019-01-31 $7,179 $10,678 $7,867 $18,545 $-368 $-1,311 $1,831 $295 $27,753 $-9,825 $-14,656 $445 $-24,036 $12,088 $-53 $12,035 $-7,410 $-7,410 $-6,533 $-629 $-2,537 $742 $-6,533 2018-01-31 $10,523 $10,529 $2,832 $13,361 $-1,074 $-140 $4,086 $3,243 $28,337 $-9,673 $-375 $969 $-9,079 $-5,585 $4,148 $-1,437 $-8,296 $-8,296 $-6,814 $-3,328 $-19,875 $-130 $-6,814 Annual Data Current Ratio Long-term Debt / Capital Debt/Equity Ratio Gross Margin Operating Margin EBIT Margin EBITDA Margin Pre-Tax Profit Margin Net Profit Margin Asset Turnover Inventory Turnover Ratio Receiveable Turnover Days Sales In Receivables ROE - Return On Equity Return On Tangible Equity ROA - Return On Assets ROI - Return On Investment Book Value Per Share Operating Cash Flow Per Share Free Cash Flow Per Share EEEEEE سا 1.bl ..... لسا لا Lul .... لا L.h .... ..... EEE 2020-01-31 0.7945 0.4404 0.8882 24.6885 3.9255 3.9255 6.0224 3.8392 2.8401 2.2155 8.8805 83.3807 4.3775 18.6396 30.1135 6.4276 10.4299 28.7966 8.8058 5.1851 2019-01-31 0.7989 0.3867 0.7287 25.0977 4.2684 4.2684 6.3442 2.2278 1.2966 2.3457 8.7036 81.8725 4.4582 9.015 14.8164 3.2737 5.5292 27.6699 9.4238 6.0876 2018-01-31 0.7598 0.313 0.5752 25.372 4.0846 4.0846 6.189 3.0225 1.971 2.4464 8.5283 89.1242 4.0954 13.02 16.8153 5.1452 8.9446 27.3787 9.4143 6.2007
Expert Answer:
Answer rating: 100% (QA)
ANSWER Walmarts return on assets ROA decreased from 75 in 2016 to 34 in 2019 before increasing to 67 ... View the full answer

Related Book For 

Corporate Financial Accounting
ISBN: 978-1337272124
15th edition
Authors: Carl S. Warren, James M. Reeve, Jonathan Duchac
Posted Date:
Students also viewed these accounting questions
-
P Company has provided the following data: Sales Price per unit: RM50 Variable Cost per unit: RM30 Fixed Cost: RM135,000 Expected Sales: 20,000 units a) What is the breakeven point in sales dollars?...
-
The Culleye Corporation reported the following solvency ratios: 2017 2016 Debt to total assets.....56.0%....................52.8% Interest coverage........5.1 times............3.3 times (a) Identify...
-
CHAPTER EXERCISES: [110] 1. Let A 0 1 1 and B= 2 5 1 0 1 [1 2 3] 3. Find A and B- by [108] (a) Solving the matrix equation AX = I for X (b) Adjoining the matrices with I or using Gauss-Jordan...
-
In September 2020 Kevin sells a drawing for 2,000. He bought the drawing in February 2014 for 50,000 when it was thought (incorrectly) to be by a famous artist. Compute the allowable loss.
-
Using the data for Cabinet Inc. in Exercise 11-17, (a) Determine the maximum possible operating loss, (b) Compute the maximum possible income from operations, (c) Construct a profit-volume chart, and...
-
Construct and graph the cubic Bézier polynomials given the following points and guide points. a. Point (1, 1) with guide point (1.5, 1.25) to point (6, 2) with guide point (7, 3) b. Point (1,...
-
Presented below is cash flow information for two competitors for 2015_____fizer, Inc., and Johnson & Johnson (amounts in millions): Describe the cash management strategy of each company by...
-
Cherokee Manufacturing Company established the following standard price and cost data: Sales price .............................................. $12.00 per unit Variable manufacturing cost...
-
Use the starting balance sheet and statement of cash flows to answer the question. Dansko Integrated Balance Sheet As of December 31, 2022 (amounts in thousands) Cash Accounts Receivable Inventory...
-
On December 31, 2021, the end of its first year of operations, Botani Associates owned the following securities that are held as long-term investments. On this date, the total fair value of the...
-
Who are the main competitors of Adidas? Where are the competitor's retailers located? How close to each other are the other branches of Adidas and Nike retailer? Is Adidas and Nike retailer in a...
-
How many NQOs would Harmer have to grant to keep its employees indifferent between NQOs and 2 0 ?ISOs? 32. Harmer Inc. is now a successful company. In the early days (before it became profitable), it...
-
Pizza Port, a craft brewing and pizza chain in southern California, manufactures thin-crust pizzas and offers one free pint of beer with the purchase of four large pizzas. What would you advise Pizza...
-
What are the main elements of an effective enterprise risk management (ERM) framework in the banking sector, and how do they help to mitigate operational and systemic risks ?
-
Becton Labs, Incorporated, produces various chemical compounds for industrial use. One compound, called Fludex, has the following standard cost per unit: Standard Quantity or Standard Price or Hours...
-
The equity sections for Atticus Group at the beginning of the year (January 1) and end of the year (December 31) follow. Stockholders' Equity (January 1) Common stock-$4 par value, 100,000 shares...
-
PwC's Workforce Hopes and Fears Survey 2022 (Malaysia report) has investigated what Malaysians think about work today. The survey investigates areas like job satisfaction, their views on skills and...
-
A genetically engineered strain of Escherichia coli (E. coli) is used to synthesize human insulin for people suffering from type I diabetes mellitus. In the following simplified reaction scheme,...
-
The following accounts and their balances were selected from the unadjusted trial balance of Point Loma Group Inc., a freight forwarder, at October 31, the end of the current fiscal year: Common...
-
Ralph Lauren Corporation (RL) sells apparel through company-owned retail stores. Financial information for Ralph Lauren follows (in thousands): Assume the apparel industry average return on total...
-
Sears Editing Company is a small editorial services company owned and operated by Deloris Sears. On January 31, 20Y1, the end of the current year, Sears Editing Companys accounting clerk prepared the...
-
Discuss why people respond predictably to changes in incentives.
-
Explain how markets can improve economic efficiency.
-
Describe why specialization and trade are so important to economic growth.

Study smarter with the SolutionInn App