

Introduction: Extra Sensory Perception (ESP) is a controversial ability where some people claim to be able...
Fantastic news! We've Found the answer you've been seeking!
Question:

Transcribed Image Text:
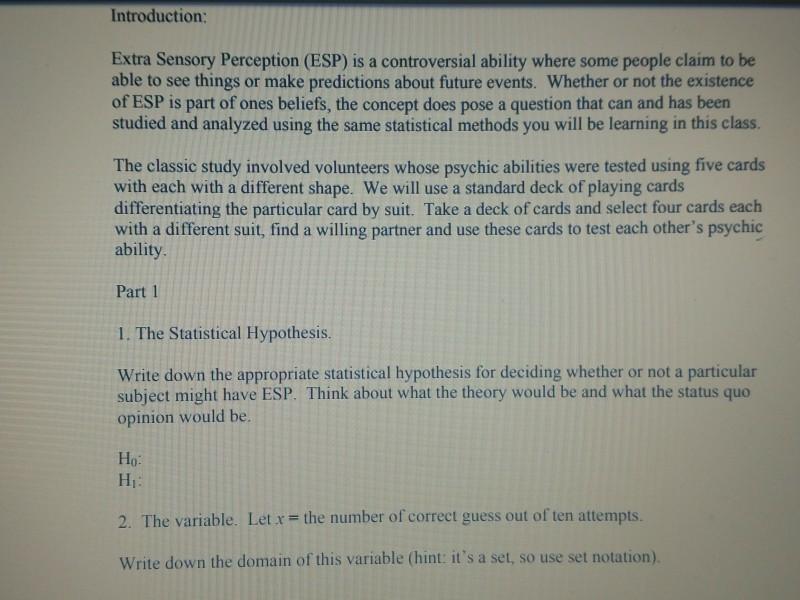
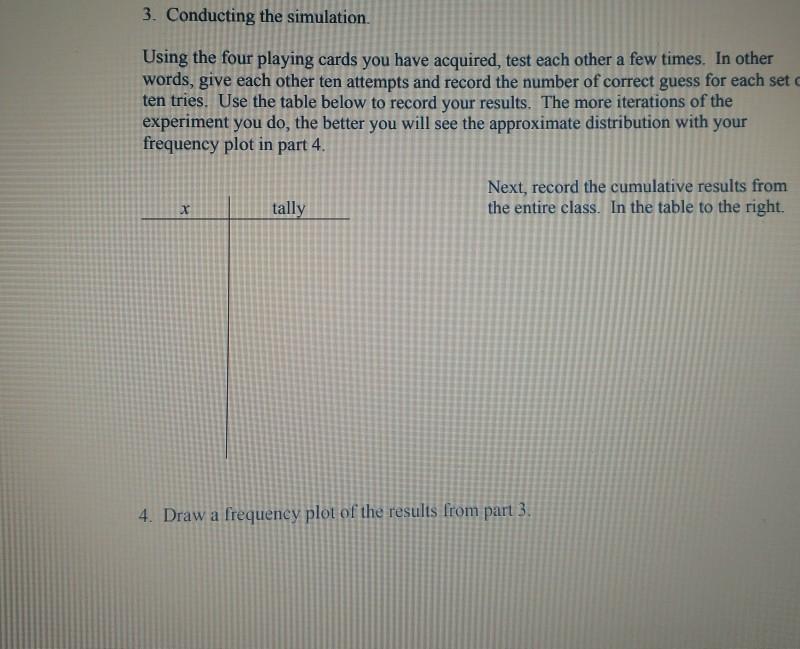
Introduction: Extra Sensory Perception (ESP) is a controversial ability where some people claim to be able to see things or make predictions about future events. Whether or not the existence of ESP is part of ones beliefs, the concept does pose a question that can and has been studied and analyzed using the same statistical methods you will be learning in this class. The classic study involved volunteers whose psychic abilities were tested using five cards with each with a different shape. We will use a standard deck of playing cards differentiating the particular card by suit. Take a deck of cards and select four cards each with a different suit, find a willing partner and use these cards to test each other's psychic ability. Part 1 1. The Statistical Hypothesis. Write down the appropriate statistical hypothesis for deciding whether or not a particular subject might have ESP. Think about what the theory would be and what the status quo opinion would be. Ho: H₁: 2. The variable. Let x = the number of correct guess out of ten attempts. Write down the domain of this variable (hint: it's a set, so use set notation). 3. Conducting the simulation. Using the four playing cards you have acquired, test each other a few times. In other words, give each other ten attempts and record the number of correct guess for each set ten tries. Use the table below to record your results. The more iterations of the experiment you do, the better you will see the approximate distribution with your frequency plot in part 4. X tally Next, record the cumulative results from the entire class. In the table to the right. 4. Draw a frequency plot of the results from part 3. 5. Describe the distribution indicated by the frequency plot in part 4. 6. Given the Statistical hypothesis in part 1 and the approximate distribution in part 4, give a decision rule and estimate the type I error rate using the approximate distribution in part 4. 7. Think about how you might use the randInt( random number generator to conduct this simulation. Write down a few sentences describing your ideas. Introduction: Extra Sensory Perception (ESP) is a controversial ability where some people claim to be able to see things or make predictions about future events. Whether or not the existence of ESP is part of ones beliefs, the concept does pose a question that can and has been studied and analyzed using the same statistical methods you will be learning in this class. The classic study involved volunteers whose psychic abilities were tested using five cards with each with a different shape. We will use a standard deck of playing cards differentiating the particular card by suit. Take a deck of cards and select four cards each with a different suit, find a willing partner and use these cards to test each other's psychic ability. Part 1 1. The Statistical Hypothesis. Write down the appropriate statistical hypothesis for deciding whether or not a particular subject might have ESP. Think about what the theory would be and what the status quo opinion would be. Ho: H₁: 2. The variable. Let x = the number of correct guess out of ten attempts. Write down the domain of this variable (hint: it's a set, so use set notation). 3. Conducting the simulation. Using the four playing cards you have acquired, test each other a few times. In other words, give each other ten attempts and record the number of correct guess for each set ten tries. Use the table below to record your results. The more iterations of the experiment you do, the better you will see the approximate distribution with your frequency plot in part 4. X tally Next, record the cumulative results from the entire class. In the table to the right. 4. Draw a frequency plot of the results from part 3. 5. Describe the distribution indicated by the frequency plot in part 4. 6. Given the Statistical hypothesis in part 1 and the approximate distribution in part 4, give a decision rule and estimate the type I error rate using the approximate distribution in part 4. 7. Think about how you might use the randInt( random number generator to conduct this simulation. Write down a few sentences describing your ideas. Introduction: Extra Sensory Perception (ESP) is a controversial ability where some people claim to be able to see things or make predictions about future events. Whether or not the existence of ESP is part of ones beliefs, the concept does pose a question that can and has been studied and analyzed using the same statistical methods you will be learning in this class. The classic study involved volunteers whose psychic abilities were tested using five cards with each with a different shape. We will use a standard deck of playing cards differentiating the particular card by suit. Take a deck of cards and select four cards each with a different suit, find a willing partner and use these cards to test each other's psychic ability. Part 1 1. The Statistical Hypothesis. Write down the appropriate statistical hypothesis for deciding whether or not a particular subject might have ESP. Think about what the theory would be and what the status quo opinion would be. Ho: H₁: 2. The variable. Let x = the number of correct guess out of ten attempts. Write down the domain of this variable (hint: it's a set, so use set notation). 3. Conducting the simulation. Using the four playing cards you have acquired, test each other a few times. In other words, give each other ten attempts and record the number of correct guess for each set ten tries. Use the table below to record your results. The more iterations of the experiment you do, the better you will see the approximate distribution with your frequency plot in part 4. X tally Next, record the cumulative results from the entire class. In the table to the right. 4. Draw a frequency plot of the results from part 3. 5. Describe the distribution indicated by the frequency plot in part 4. 6. Given the Statistical hypothesis in part 1 and the approximate distribution in part 4, give a decision rule and estimate the type I error rate using the approximate distribution in part 4. 7. Think about how you might use the randInt( random number generator to conduct this simulation. Write down a few sentences describing your ideas. Introduction: Extra Sensory Perception (ESP) is a controversial ability where some people claim to be able to see things or make predictions about future events. Whether or not the existence of ESP is part of ones beliefs, the concept does pose a question that can and has been studied and analyzed using the same statistical methods you will be learning in this class. The classic study involved volunteers whose psychic abilities were tested using five cards with each with a different shape. We will use a standard deck of playing cards differentiating the particular card by suit. Take a deck of cards and select four cards each with a different suit, find a willing partner and use these cards to test each other's psychic ability. Part 1 1. The Statistical Hypothesis. Write down the appropriate statistical hypothesis for deciding whether or not a particular subject might have ESP. Think about what the theory would be and what the status quo opinion would be. Ho: H₁: 2. The variable. Let x = the number of correct guess out of ten attempts. Write down the domain of this variable (hint: it's a set, so use set notation). 3. Conducting the simulation. Using the four playing cards you have acquired, test each other a few times. In other words, give each other ten attempts and record the number of correct guess for each set ten tries. Use the table below to record your results. The more iterations of the experiment you do, the better you will see the approximate distribution with your frequency plot in part 4. X tally Next, record the cumulative results from the entire class. In the table to the right. 4. Draw a frequency plot of the results from part 3. 5. Describe the distribution indicated by the frequency plot in part 4. 6. Given the Statistical hypothesis in part 1 and the approximate distribution in part 4, give a decision rule and estimate the type I error rate using the approximate distribution in part 4. 7. Think about how you might use the randInt( random number generator to conduct this simulation. Write down a few sentences describing your ideas. Introduction: Extra Sensory Perception (ESP) is a controversial ability where some people claim to be able to see things or make predictions about future events. Whether or not the existence of ESP is part of ones beliefs, the concept does pose a question that can and has been studied and analyzed using the same statistical methods you will be learning in this class. The classic study involved volunteers whose psychic abilities were tested using five cards with each with a different shape. We will use a standard deck of playing cards differentiating the particular card by suit. Take a deck of cards and select four cards each with a different suit, find a willing partner and use these cards to test each other's psychic ability. Part 1 1. The Statistical Hypothesis. Write down the appropriate statistical hypothesis for deciding whether or not a particular subject might have ESP. Think about what the theory would be and what the status quo opinion would be. Ho: H₁: 2. The variable. Let x = the number of correct guess out of ten attempts. Write down the domain of this variable (hint: it's a set, so use set notation). 3. Conducting the simulation. Using the four playing cards you have acquired, test each other a few times. In other words, give each other ten attempts and record the number of correct guess for each set ten tries. Use the table below to record your results. The more iterations of the experiment you do, the better you will see the approximate distribution with your frequency plot in part 4. X tally Next, record the cumulative results from the entire class. In the table to the right. 4. Draw a frequency plot of the results from part 3. 5. Describe the distribution indicated by the frequency plot in part 4. 6. Given the Statistical hypothesis in part 1 and the approximate distribution in part 4, give a decision rule and estimate the type I error rate using the approximate distribution in part 4. 7. Think about how you might use the randInt( random number generator to conduct this simulation. Write down a few sentences describing your ideas. Introduction: Extra Sensory Perception (ESP) is a controversial ability where some people claim to be able to see things or make predictions about future events. Whether or not the existence of ESP is part of ones beliefs, the concept does pose a question that can and has been studied and analyzed using the same statistical methods you will be learning in this class. The classic study involved volunteers whose psychic abilities were tested using five cards with each with a different shape. We will use a standard deck of playing cards differentiating the particular card by suit. Take a deck of cards and select four cards each with a different suit, find a willing partner and use these cards to test each other's psychic ability. Part 1 1. The Statistical Hypothesis. Write down the appropriate statistical hypothesis for deciding whether or not a particular subject might have ESP. Think about what the theory would be and what the status quo opinion would be. Ho: H₁: 2. The variable. Let x = the number of correct guess out of ten attempts. Write down the domain of this variable (hint: it's a set, so use set notation). 3. Conducting the simulation. Using the four playing cards you have acquired, test each other a few times. In other words, give each other ten attempts and record the number of correct guess for each set ten tries. Use the table below to record your results. The more iterations of the experiment you do, the better you will see the approximate distribution with your frequency plot in part 4. X tally Next, record the cumulative results from the entire class. In the table to the right. 4. Draw a frequency plot of the results from part 3. 5. Describe the distribution indicated by the frequency plot in part 4. 6. Given the Statistical hypothesis in part 1 and the approximate distribution in part 4, give a decision rule and estimate the type I error rate using the approximate distribution in part 4. 7. Think about how you might use the randInt( random number generator to conduct this simulation. Write down a few sentences describing your ideas. Introduction: Extra Sensory Perception (ESP) is a controversial ability where some people claim to be able to see things or make predictions about future events. Whether or not the existence of ESP is part of ones beliefs, the concept does pose a question that can and has been studied and analyzed using the same statistical methods you will be learning in this class. The classic study involved volunteers whose psychic abilities were tested using five cards with each with a different shape. We will use a standard deck of playing cards differentiating the particular card by suit. Take a deck of cards and select four cards each with a different suit, find a willing partner and use these cards to test each other's psychic ability. Part 1 1. The Statistical Hypothesis. Write down the appropriate statistical hypothesis for deciding whether or not a particular subject might have ESP. Think about what the theory would be and what the status quo opinion would be. Ho: H₁: 2. The variable. Let x = the number of correct guess out of ten attempts. Write down the domain of this variable (hint: it's a set, so use set notation). 3. Conducting the simulation. Using the four playing cards you have acquired, test each other a few times. In other words, give each other ten attempts and record the number of correct guess for each set ten tries. Use the table below to record your results. The more iterations of the experiment you do, the better you will see the approximate distribution with your frequency plot in part 4. X tally Next, record the cumulative results from the entire class. In the table to the right. 4. Draw a frequency plot of the results from part 3. 5. Describe the distribution indicated by the frequency plot in part 4. 6. Given the Statistical hypothesis in part 1 and the approximate distribution in part 4, give a decision rule and estimate the type I error rate using the approximate distribution in part 4. 7. Think about how you might use the randInt( random number generator to conduct this simulation. Write down a few sentences describing your ideas. Introduction: Extra Sensory Perception (ESP) is a controversial ability where some people claim to be able to see things or make predictions about future events. Whether or not the existence of ESP is part of ones beliefs, the concept does pose a question that can and has been studied and analyzed using the same statistical methods you will be learning in this class. The classic study involved volunteers whose psychic abilities were tested using five cards with each with a different shape. We will use a standard deck of playing cards differentiating the particular card by suit. Take a deck of cards and select four cards each with a different suit, find a willing partner and use these cards to test each other's psychic ability. Part 1 1. The Statistical Hypothesis. Write down the appropriate statistical hypothesis for deciding whether or not a particular subject might have ESP. Think about what the theory would be and what the status quo opinion would be. Ho: H₁: 2. The variable. Let x = the number of correct guess out of ten attempts. Write down the domain of this variable (hint: it's a set, so use set notation). 3. Conducting the simulation. Using the four playing cards you have acquired, test each other a few times. In other words, give each other ten attempts and record the number of correct guess for each set ten tries. Use the table below to record your results. The more iterations of the experiment you do, the better you will see the approximate distribution with your frequency plot in part 4. X tally Next, record the cumulative results from the entire class. In the table to the right. 4. Draw a frequency plot of the results from part 3. 5. Describe the distribution indicated by the frequency plot in part 4. 6. Given the Statistical hypothesis in part 1 and the approximate distribution in part 4, give a decision rule and estimate the type I error rate using the approximate distribution in part 4. 7. Think about how you might use the randInt( random number generator to conduct this simulation. Write down a few sentences describing your ideas. Introduction: Extra Sensory Perception (ESP) is a controversial ability where some people claim to be able to see things or make predictions about future events. Whether or not the existence of ESP is part of ones beliefs, the concept does pose a question that can and has been studied and analyzed using the same statistical methods you will be learning in this class. The classic study involved volunteers whose psychic abilities were tested using five cards with each with a different shape. We will use a standard deck of playing cards differentiating the particular card by suit. Take a deck of cards and select four cards each with a different suit, find a willing partner and use these cards to test each other's psychic ability. Part 1 1. The Statistical Hypothesis. Write down the appropriate statistical hypothesis for deciding whether or not a particular subject might have ESP. Think about what the theory would be and what the status quo opinion would be. Ho: H₁: 2. The variable. Let x = the number of correct guess out of ten attempts. Write down the domain of this variable (hint: it's a set, so use set notation). 3. Conducting the simulation. Using the four playing cards you have acquired, test each other a few times. In other words, give each other ten attempts and record the number of correct guess for each set ten tries. Use the table below to record your results. The more iterations of the experiment you do, the better you will see the approximate distribution with your frequency plot in part 4. X tally Next, record the cumulative results from the entire class. In the table to the right. 4. Draw a frequency plot of the results from part 3. 5. Describe the distribution indicated by the frequency plot in part 4. 6. Given the Statistical hypothesis in part 1 and the approximate distribution in part 4, give a decision rule and estimate the type I error rate using the approximate distribution in part 4. 7. Think about how you might use the randInt( random number generator to conduct this simulation. Write down a few sentences describing your ideas. Introduction: Extra Sensory Perception (ESP) is a controversial ability where some people claim to be able to see things or make predictions about future events. Whether or not the existence of ESP is part of ones beliefs, the concept does pose a question that can and has been studied and analyzed using the same statistical methods you will be learning in this class. The classic study involved volunteers whose psychic abilities were tested using five cards with each with a different shape. We will use a standard deck of playing cards differentiating the particular card by suit. Take a deck of cards and select four cards each with a different suit, find a willing partner and use these cards to test each other's psychic ability. Part 1 1. The Statistical Hypothesis. Write down the appropriate statistical hypothesis for deciding whether or not a particular subject might have ESP. Think about what the theory would be and what the status quo opinion would be. Ho: H₁: 2. The variable. Let x = the number of correct guess out of ten attempts. Write down the domain of this variable (hint: it's a set, so use set notation). 3. Conducting the simulation. Using the four playing cards you have acquired, test each other a few times. In other words, give each other ten attempts and record the number of correct guess for each set ten tries. Use the table below to record your results. The more iterations of the experiment you do, the better you will see the approximate distribution with your frequency plot in part 4. X tally Next, record the cumulative results from the entire class. In the table to the right. 4. Draw a frequency plot of the results from part 3. 5. Describe the distribution indicated by the frequency plot in part 4. 6. Given the Statistical hypothesis in part 1 and the approximate distribution in part 4, give a decision rule and estimate the type I error rate using the approximate distribution in part 4. 7. Think about how you might use the randInt( random number generator to conduct this simulation. Write down a few sentences describing your ideas.
Expert Answer:
Answer rating: 100% (QA)
1 Many experiments can be formulated using 4 cards each of a different house to test the ESP of a su... View the full answer

Related Book For 

Posted Date:
Students also viewed these accounting questions
-
Some African tribes people claim to be able to see the moons of Jupiter with the unaided eye. If two moons of Jupiter are at a minimum distance of 3.1 X 10⁸ km away from Earth and at a maximum...
-
What must be done to be able to see the output generated by the Oracle Database DBMS_OUTPUT package? What limits exist on such output?
-
Astrologers claim to be able to recognize trends in personality and fortune that depend on an individual's birthday by somehow incorporating where the stars were 2000 years ago. Suppose that instead...
-
Problem 5-47 Amortizing Loans and Inflation (LO3) Suppose you take out a $108,000, 20-year mortgage loan to buy a condo. The interest rate on the loan is 5%. To keep things simple, we will assume you...
-
Assume that both portfolios A and B are well diversified, that E(rA) = 12%, and E(rB) = 9%. If the economy has only one factor, and A = 1.2, whereas B = .8, what must be the risk-free rate?
-
Explain why adjusting entries are necessary in accrual accounting but not required when the cash basis of accounting is used.
-
Statistical process control: use of the c-chart The Y. B. Phatt Inc. produces a diet pow- der which is distributed worldwide. The powder is mixed with milk or water and comes in many flavors. The Y....
-
Mosby Memorial Hospital, a private, not-for-prot hospital, engaged in the following transactions. 1. At the beginning of the year, the hospital received a bequest in the form of equity securities....
-
The following data are the daily round-trip distances to school (in miles) for 30 randomly chosen students attending a community college in California. Construct a stem-and-leaf display for the given...
-
1. Suppose you wanted to predict Winnings ($) using only the number of poles won (Poles), the number of wins (Wins), the number of top five finishes (Top 5), or the number of top ten finishes (Top...
-
Problem 2-27 In an article about investment alternatives, Money magazine reported that drug stocks provide a potential for long-term growth, with over 50% of the adult population of the United States...
-
Can you think of an example of a company that empowers employees to think innovatively and creatively? What does this empowerment do for employees (and the organization) and how does it fit into the...
-
How can I determine the following on the income statement of the Microsoft Corporation SEC 10k report 2019? https://microsoft.gcs-web.com/static-files/7c96b326-33bc-4b84-8abb-7afd7a517ea3 - Income...
-
Suggest that management accountants must now take a more active role in sustainable development. The CIMA report on "Sustainability and the role of the management accountant" focuses on the...
-
Q1: Alfred operates a factory that manufactures bread and cakes. One of the major raw materials used is organic maize, which he buys for $5 per kilogram. The factory operates for 350 days each year....
-
6. Pressure ratio Mass flow rate Ambient conditions Inlet swirl Select Ti alloys as material. Check the following criteria: O Oy = 965Mpa, Pm = 4650, set cent <0.4 Oy All velocity magnitudes and...
-
11. \( (* *) \) Consider the level production plan for Pennington Cabinets shown in Table \( 10.5 \square \) ?. Perform a cash flow analysis for this production plan, using the cash flow analysis in
-
Heineken N.V., a global brewer based in the Netherlands, reports the following balance sheet accounts for the year ended December 31, 2016 (euros in millions). Prepare the balance sheet for this...
-
For total internal reflection to occur inside an optic fiber as shown in Fig. 22.29, the angle u must be greater than the critical angle for the fiberair interface. At the end of the fiber, the...
-
(a) An inductor has a reactance of 90- in a 60-Hz ac circuit. What is its inductance? (b) What frequency would be required to double its reactance?
-
Express the length 50 500 m (micrometers) in centimeters, decimeters, and meters, to three significant figures.
-
Distinguish between exceptional items and extraordinary items. Describe the required accounting treatment of each type of item.
-
An extract from the profit and loss account of J Harrison Ltd for the year to 30 April 2000 (before considering the requirements of FRS3) is shown below. Further information: 1. During the year, the...
-
The valuation and depreciation of fixed assets are covered by both mandatory accounting standards and the Companies Acts as sources of authority. Requirement Identify the main accounting issues...

Study smarter with the SolutionInn App