

Kilmer Company has demand for its only product that exceeds its manufacturing capacity. The company provided...
Fantastic news! We've Found the answer you've been seeking!
Question:
Transcribed Image Text:
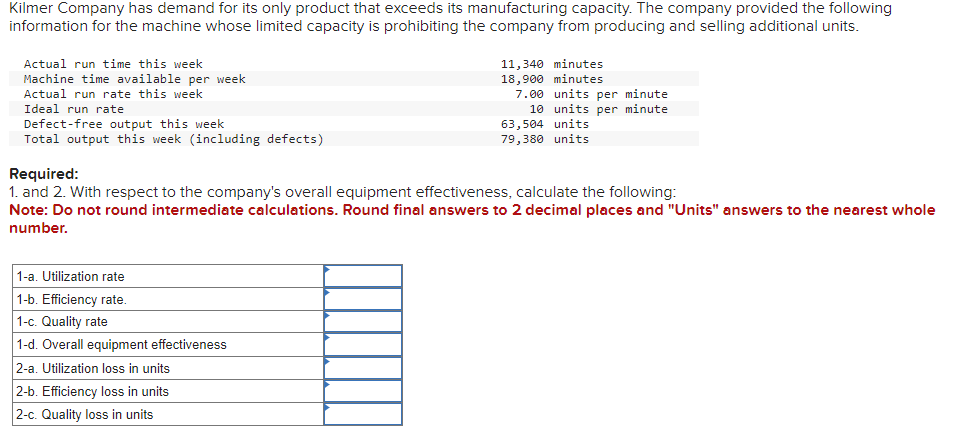
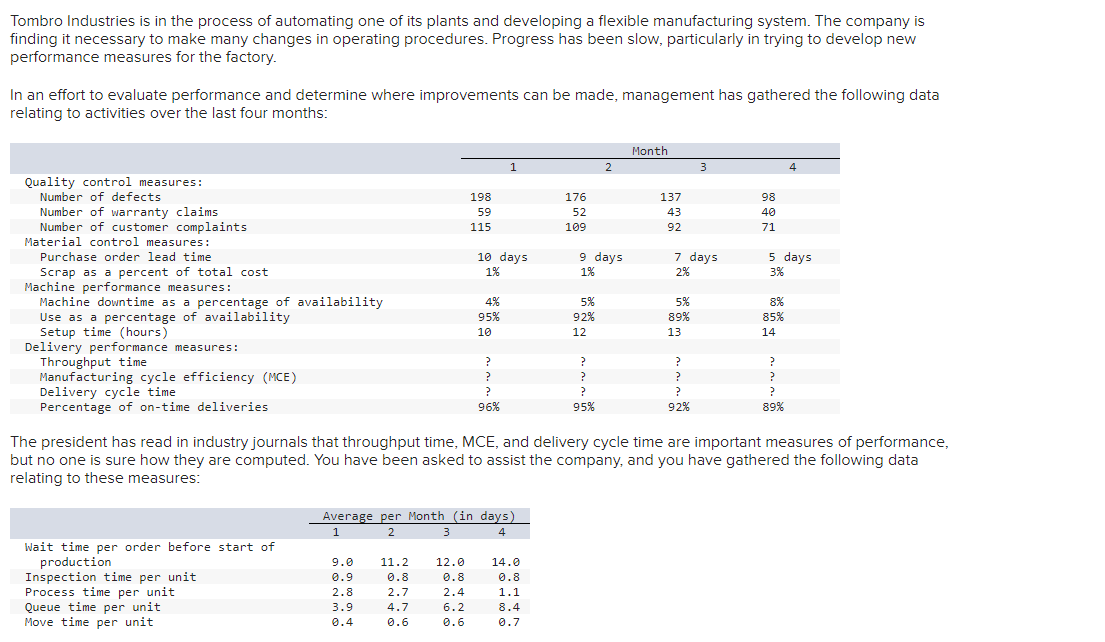
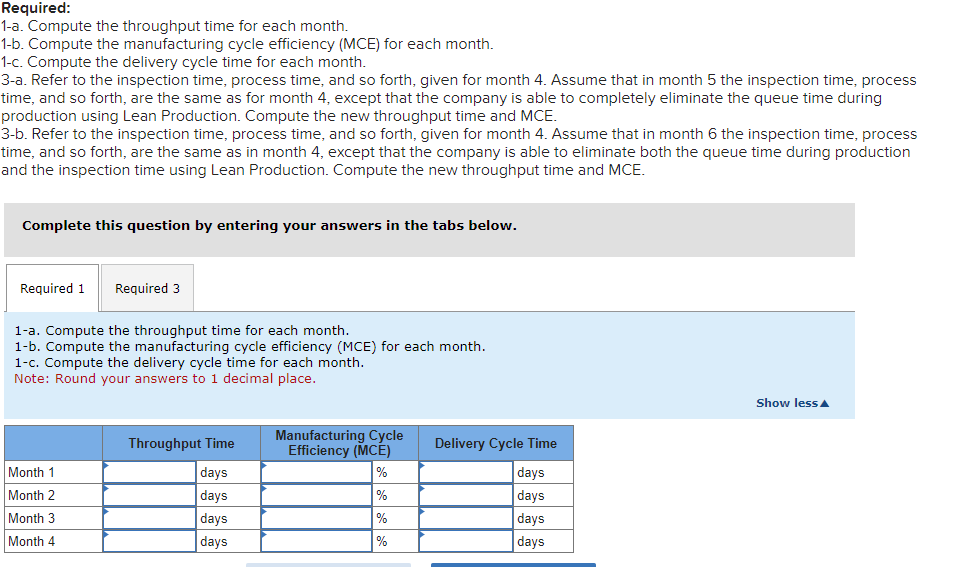
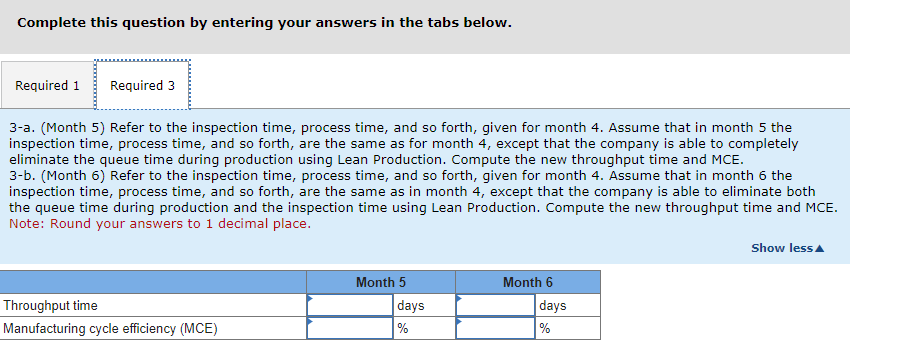
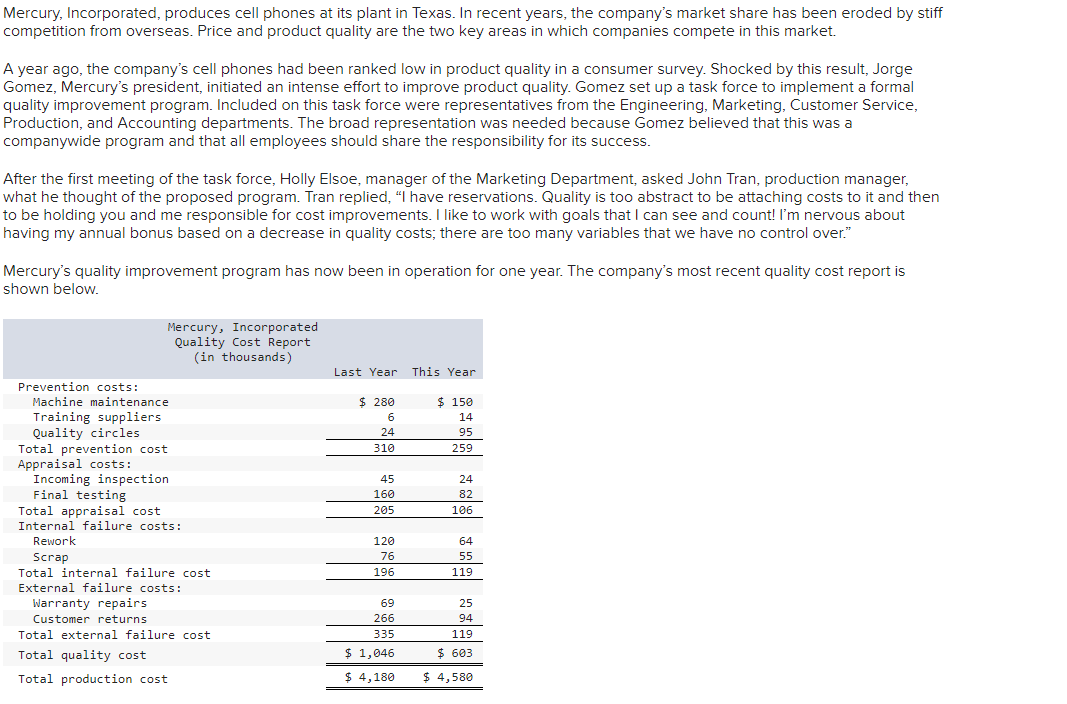
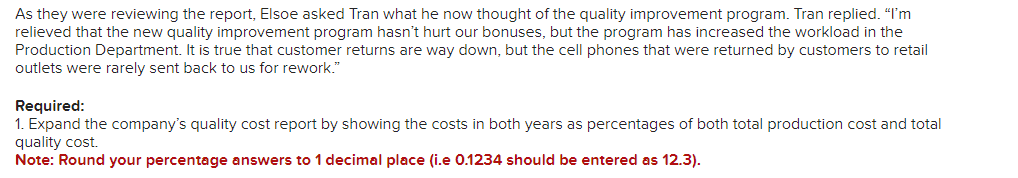
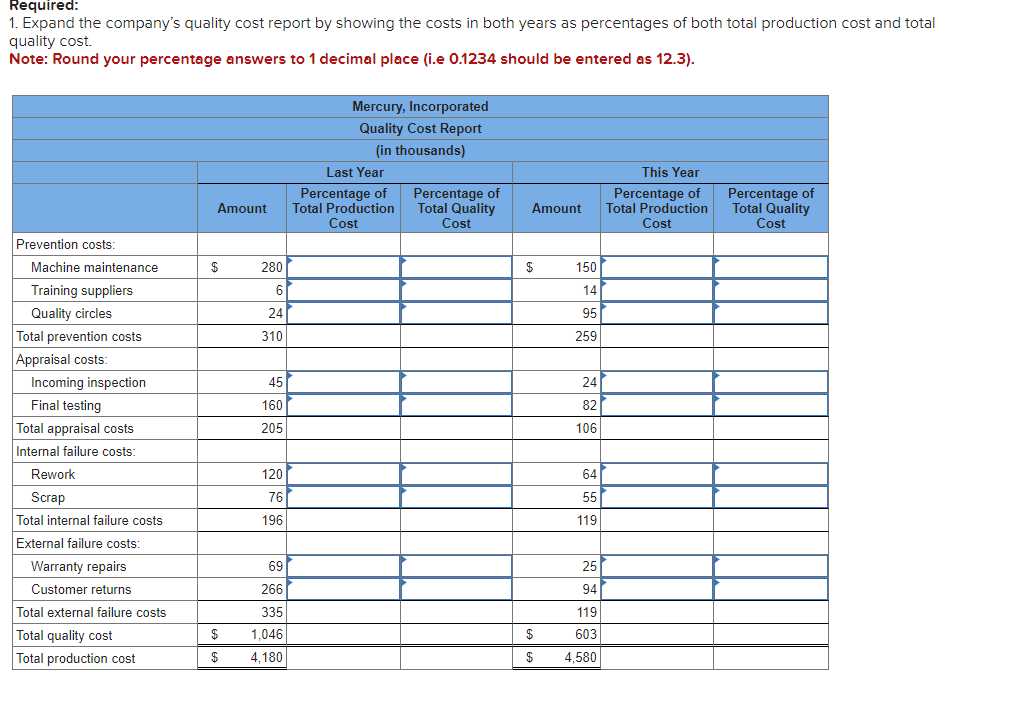
Kilmer Company has demand for its only product that exceeds its manufacturing capacity. The company provided the following information for the machine whose limited capacity is prohibiting the company from producing and selling additional units. Actual run time this week Machine time available per week 11,340 minutes 18,900 minutes Actual run rate this week 7.00 units per minute Ideal run rate Defect-free output this week Total output this week (including defects) Required: 10 units per minute 63,504 units 79,380 units 1. and 2. With respect to the company's overall equipment effectiveness, calculate the following: Note: Do not round intermediate calculations. Round final answers to 2 decimal places and "Units" answers to the nearest whole number. 1-a. Utilization rate 1-b. Efficiency rate. 1-c. Quality rate 1-d. Overall equipment effectiveness 2-a. Utilization loss in units 2-b. Efficiency loss in units 2-c. Quality loss in units Tombro Industries is in the process of automating one of its plants and developing a flexible manufacturing system. The company is finding it necessary to make many changes in operating procedures. Progress has been slow, particularly in trying to develop new performance measures for the factory. In an effort to evaluate performance and determine where improvements can be made, management has gathered the following data relating to activities over the last four months: Quality control measures: Number of defects Number of warranty claims Number of customer complaints Material control measures: Purchase order lead time Scrap as a percent of total cost Machine performance measures: Machine downtime as a percentage of availability Use as a percentage of availability Setup time (hours) Delivery performance measures: Throughput time Manufacturing cycle efficiency (MCE) Delivery cycle time Percentage of on-time deliveries 1 Month 2 3 4 198 176 59 52 115 109 137 98 43 40 92 71 10 days 9 days 7 days 1% 1% 2% 4% 5% 5% 95% 92% 89% 10 12 13 ? ? ? ? ? ? ? ? 96% 95% ? 92% The president has read in industry journals that throughput time, MCE, and delivery cycle time are important measures of performance, but no one is sure how they are computed. You have been asked to assist the company, and you have gathered the following data relating to these measures: Average per Month (in days) 1 2 3 4 Wait time per order before start of production 9.0 11.2 12.0 14.0 Inspection time per unit 0.9 0.8 0.8 0.8 Process time per unit 2.8 2.7 2.4 1.1 Queue time per unit 3.9 4.7 6.2 8.4 Move time per unit 0.4 0.6 0.6 0.7 Required: 1-a. Compute the throughput time for each month. 1-b. Compute the manufacturing cycle efficiency (MCE) for each month. 1-c. Compute the delivery cycle time for each month. 3-a. Refer to the inspection time, process time, and so forth, given for month 4. Assume that in month 5 the inspection time, process time, and so forth, are the same as for month 4, except that the company is able to completely eliminate the queue time during production using Lean Production. Compute the new throughput time and MCE. 3-b. Refer to the inspection time, process time, and so forth, given for month 4. Assume that in month 6 the inspection time, process time, and so forth, are the same as in month 4, except that the company is able to eliminate both the queue time during production and the inspection time using Lean Production. Compute the new throughput time and MCE. Complete this question by entering your answers in the tabs below. Required 1 Required 3 1-a. Compute the throughput time for each month. 1-b. Compute the manufacturing cycle efficiency (MCE) for each month. 1-c. Compute the delivery cycle time for each month. Note: Round your answers to 1 decimal place. Throughput Time Manufacturing Cycle Efficiency (MCE) Delivery Cycle Time Month 1 days % days Month 2 days % days Month 3 days % days Month 4 days % days Show less Complete this question by entering your answers in the tabs below. Required 1 Required 3 3-a. (Month 5) Refer to the inspection time, process time, and so forth, given for month 4. Assume that in month 5 the inspection time, process time, and so forth, are the same as for month 4, except that the company is able to completely eliminate the queue time during production using Lean Production. Compute the new throughput time and MCE. 3-b. (Month 6) Refer to the inspection time, process time, and so forth, given for month 4. Assume that in month 6 the inspection time, process time, and so forth, are the same as in month 4, except that the company is able to eliminate both the queue time during production and the inspection time using Lean Production. Compute the new throughput time and MCE. Note: Round your answers to 1 decimal place. Throughput time Manufacturing cycle efficiency (MCE) Month 5 days Month 6 days % % Show less Mercury, Incorporated, produces cell phones at its plant in Texas. In recent years, the company's market share has been eroded by stiff competition from overseas. Price and product quality are the two key areas in which companies compete in this market. A year ago, the company's cell phones had been ranked low in product quality in a consumer survey. Shocked by this result, Jorge Gomez, Mercury's president, initiated an intense effort to improve product quality. Gomez set up a task force to implement a formal quality improvement program. Included on this task force were representatives from the Engineering, Marketing, Customer Service, Production, and Accounting departments. The broad representation was needed because Gomez believed that this was a companywide program and that all employees should share the responsibility for its success. After the first meeting of the task force, Holly Elsoe, manager of the Marketing Department, asked John Tran, production manager, what he thought of the proposed program. Tran replied, "I have reservations. Quality is too abstract to be attaching costs to it and then to be holding you and me responsible for cost improvements. I like to work with goals that I can see and count! I'm nervous about having my annual bonus based on a decrease in quality costs; there are too many variables that we have no control over." Mercury's quality improvement program has now been in operation for one year. The company's most recent quality cost report is shown below. Mercury, Incorporated Quality Cost Report (in thousands) Last Year This Year Prevention costs: Machine maintenance Training suppliers Quality circles Total prevention cost Appraisal costs: Incoming inspection Final testing Total appraisal cost $ 280 $ 150 6 14 24 95 310 259 45 24 160 82 205 106 Internal failure costs: Rework 120 64 Scrap 76 55 Total internal failure cost 196 119 External failure costs: Warranty repairs Customer returns Total external failure cost Total quality cost Total production cost 69 25 266 94 335 119 $ 603 $ 1,046 $ 4,180 $ 4,580 As they were reviewing the report, Elsoe asked Tran what he now thought of the quality improvement program. Tran replied. "I'm relieved that the new quality improvement program hasn't hurt our bonuses, but the program has increased the workload in the Production Department. It is true that customer returns are way down, but the cell phones that were returned by customers to retail outlets were rarely sent back to us for rework." Required: 1. Expand the company's quality cost report by showing the costs in both years as percentages of both total production cost and total quality cost. Note: Round your percentage answers to 1 decimal place (i.e 0.1234 should be entered as 12.3). Required: 1. Expand the company's quality cost report by showing the costs in both years as percentages of both total production cost and total quality cost. Note: Round your percentage answers to 1 decimal place (i.e 0.1234 should be entered as 12.3). Mercury, Incorporated Quality Cost Report (in thousands) Last Year Percentage of Amount Total Production Cost Percentage of Total Quality Cost This Year Percentage of Amount Total Production Cost Percentage of Total Quality Cost Prevention costs: Machine maintenance $ 280 Training suppliers 6 Quality circles 24 Total prevention costs Appraisal costs: 310 $ 150 14 95 259 Incoming inspection 45 24 Final testing 160 82 Total appraisal costs 205 106 Internal failure costs: Rework 120 64 Scrap 76 55 Total internal failure costs 196 119 External failure costs: Warranty repairs 69 25 Customer returns 266 94 Total external failure costs 335 119 Total quality cost $ 1,046 $ 603 Total production cost $ 4,180 $ 4,580 Kilmer Company has demand for its only product that exceeds its manufacturing capacity. The company provided the following information for the machine whose limited capacity is prohibiting the company from producing and selling additional units. Actual run time this week Machine time available per week 11,340 minutes 18,900 minutes Actual run rate this week 7.00 units per minute Ideal run rate Defect-free output this week Total output this week (including defects) Required: 10 units per minute 63,504 units 79,380 units 1. and 2. With respect to the company's overall equipment effectiveness, calculate the following: Note: Do not round intermediate calculations. Round final answers to 2 decimal places and "Units" answers to the nearest whole number. 1-a. Utilization rate 1-b. Efficiency rate. 1-c. Quality rate 1-d. Overall equipment effectiveness 2-a. Utilization loss in units 2-b. Efficiency loss in units 2-c. Quality loss in units Tombro Industries is in the process of automating one of its plants and developing a flexible manufacturing system. The company is finding it necessary to make many changes in operating procedures. Progress has been slow, particularly in trying to develop new performance measures for the factory. In an effort to evaluate performance and determine where improvements can be made, management has gathered the following data relating to activities over the last four months: Quality control measures: Number of defects Number of warranty claims Number of customer complaints Material control measures: Purchase order lead time Scrap as a percent of total cost Machine performance measures: Machine downtime as a percentage of availability Use as a percentage of availability Setup time (hours) Delivery performance measures: Throughput time Manufacturing cycle efficiency (MCE) Delivery cycle time Percentage of on-time deliveries 1 Month 2 3 4 198 176 59 52 115 109 137 98 43 40 92 71 10 days 9 days 7 days 1% 1% 2% 4% 5% 5% 95% 92% 89% 10 12 13 ? ? ? ? ? ? ? ? 96% 95% ? 92% The president has read in industry journals that throughput time, MCE, and delivery cycle time are important measures of performance, but no one is sure how they are computed. You have been asked to assist the company, and you have gathered the following data relating to these measures: Average per Month (in days) 1 2 3 4 Wait time per order before start of production 9.0 11.2 12.0 14.0 Inspection time per unit 0.9 0.8 0.8 0.8 Process time per unit 2.8 2.7 2.4 1.1 Queue time per unit 3.9 4.7 6.2 8.4 Move time per unit 0.4 0.6 0.6 0.7 Required: 1-a. Compute the throughput time for each month. 1-b. Compute the manufacturing cycle efficiency (MCE) for each month. 1-c. Compute the delivery cycle time for each month. 3-a. Refer to the inspection time, process time, and so forth, given for month 4. Assume that in month 5 the inspection time, process time, and so forth, are the same as for month 4, except that the company is able to completely eliminate the queue time during production using Lean Production. Compute the new throughput time and MCE. 3-b. Refer to the inspection time, process time, and so forth, given for month 4. Assume that in month 6 the inspection time, process time, and so forth, are the same as in month 4, except that the company is able to eliminate both the queue time during production and the inspection time using Lean Production. Compute the new throughput time and MCE. Complete this question by entering your answers in the tabs below. Required 1 Required 3 1-a. Compute the throughput time for each month. 1-b. Compute the manufacturing cycle efficiency (MCE) for each month. 1-c. Compute the delivery cycle time for each month. Note: Round your answers to 1 decimal place. Throughput Time Manufacturing Cycle Efficiency (MCE) Delivery Cycle Time Month 1 days % days Month 2 days % days Month 3 days % days Month 4 days % days Show less Complete this question by entering your answers in the tabs below. Required 1 Required 3 3-a. (Month 5) Refer to the inspection time, process time, and so forth, given for month 4. Assume that in month 5 the inspection time, process time, and so forth, are the same as for month 4, except that the company is able to completely eliminate the queue time during production using Lean Production. Compute the new throughput time and MCE. 3-b. (Month 6) Refer to the inspection time, process time, and so forth, given for month 4. Assume that in month 6 the inspection time, process time, and so forth, are the same as in month 4, except that the company is able to eliminate both the queue time during production and the inspection time using Lean Production. Compute the new throughput time and MCE. Note: Round your answers to 1 decimal place. Throughput time Manufacturing cycle efficiency (MCE) Month 5 days Month 6 days % % Show less Mercury, Incorporated, produces cell phones at its plant in Texas. In recent years, the company's market share has been eroded by stiff competition from overseas. Price and product quality are the two key areas in which companies compete in this market. A year ago, the company's cell phones had been ranked low in product quality in a consumer survey. Shocked by this result, Jorge Gomez, Mercury's president, initiated an intense effort to improve product quality. Gomez set up a task force to implement a formal quality improvement program. Included on this task force were representatives from the Engineering, Marketing, Customer Service, Production, and Accounting departments. The broad representation was needed because Gomez believed that this was a companywide program and that all employees should share the responsibility for its success. After the first meeting of the task force, Holly Elsoe, manager of the Marketing Department, asked John Tran, production manager, what he thought of the proposed program. Tran replied, "I have reservations. Quality is too abstract to be attaching costs to it and then to be holding you and me responsible for cost improvements. I like to work with goals that I can see and count! I'm nervous about having my annual bonus based on a decrease in quality costs; there are too many variables that we have no control over." Mercury's quality improvement program has now been in operation for one year. The company's most recent quality cost report is shown below. Mercury, Incorporated Quality Cost Report (in thousands) Last Year This Year Prevention costs: Machine maintenance Training suppliers Quality circles Total prevention cost Appraisal costs: Incoming inspection Final testing Total appraisal cost $ 280 $ 150 6 14 24 95 310 259 45 24 160 82 205 106 Internal failure costs: Rework 120 64 Scrap 76 55 Total internal failure cost 196 119 External failure costs: Warranty repairs Customer returns Total external failure cost Total quality cost Total production cost 69 25 266 94 335 119 $ 603 $ 1,046 $ 4,180 $ 4,580 As they were reviewing the report, Elsoe asked Tran what he now thought of the quality improvement program. Tran replied. "I'm relieved that the new quality improvement program hasn't hurt our bonuses, but the program has increased the workload in the Production Department. It is true that customer returns are way down, but the cell phones that were returned by customers to retail outlets were rarely sent back to us for rework." Required: 1. Expand the company's quality cost report by showing the costs in both years as percentages of both total production cost and total quality cost. Note: Round your percentage answers to 1 decimal place (i.e 0.1234 should be entered as 12.3). Required: 1. Expand the company's quality cost report by showing the costs in both years as percentages of both total production cost and total quality cost. Note: Round your percentage answers to 1 decimal place (i.e 0.1234 should be entered as 12.3). Mercury, Incorporated Quality Cost Report (in thousands) Last Year Percentage of Amount Total Production Cost Percentage of Total Quality Cost This Year Percentage of Amount Total Production Cost Percentage of Total Quality Cost Prevention costs: Machine maintenance $ 280 Training suppliers 6 Quality circles 24 Total prevention costs Appraisal costs: 310 $ 150 14 95 259 Incoming inspection 45 24 Final testing 160 82 Total appraisal costs 205 106 Internal failure costs: Rework 120 64 Scrap 76 55 Total internal failure costs 196 119 External failure costs: Warranty repairs 69 25 Customer returns 266 94 Total external failure costs 335 119 Total quality cost $ 1,046 $ 603 Total production cost $ 4,180 $ 4,580
Expert Answer:

Related Book For 

Managerial Accounting
ISBN: 9781260247787
17th Edition
Authors: Ray Garrison, Eric Noreen, Peter Brewer
Posted Date:
Students also viewed these accounting questions
-
Kilmer Company has demand for its only product that exceeds its manufacturing capacity. The company provided the following information for the machine whose limited capacity is prohibiting the...
-
The figure below shows a section of a very thin, very long, straight rod with a uniform charge per unit length of A. Point O is a perpendicular distance d from the rod. A spherical gaussian surface...
-
The accounting records of Shinault Inc. show the following data for 2017 (its first year of operations). 1. Life insurance expense on officers was $9,000. 2. Equipment was acquired in early January...
-
Biotechtron, Inc., has two research laboratories in the Southwest, one in Yuma, Arizona, and the other in Bernalillo, New Mexico. The owner of Biotechtron centralized the legal and accounting...
-
Develop a set of classes for a college to use in various student service and personnel applications. Classes you need to design include the following: PersonA Person contains a first name, last name,...
-
Explain how the control variate technique is implemented.
-
The Vang Hotel opened for business on May 1, 2012. Here is its trial balance before adjustment on May 31. Other data:1. Insurance expires at the rate of $450 per month.2. A count of supplies shows...
-
Calculate the total billing amount for Jonas and his associate for their ( 1 ) first client assessment session and ( 2 ) second client assessment session. State whether they are the same or different...
-
Sidney Crosby has the following capital gains and losses: Long - term capital gain: 1 2 0 , 0 0 0 Long - term capital loss: ( 7 5 , 0 0 0 ) Short - term capital gain: 7 5 , 0 0 0 Short - term capital...
-
Start-ups typically have a variety of design needs including logo design, brochures, stationery, and business cards. Traditionally the most important design work, like a businesss logo, is either...
-
It all started because two aspiring designers needed money to pay their rent. It was October 2007, and Brian Chesky and Joe Gebbia were sharing an apartment in San Francisco. There was an...
-
Give the history of the U.S. Court of Federal Claims.
-
The tax evader is a criminal. Support or refute this statement.
-
What events might cause an IRS examination?
-
(a) A particle has an initial velocity of u ms. It moves in a straight line with constant acceleration f for 4 seconds. It travels 52 m while accelerating. The particle then moves with uniform...
-
Gordon and Lisa estimate that they will need $1,875,000 in 40 years for their retirement years. If they can earn 8 percent annually on their funds, how much do they need to save annually?
-
Distinguish between (a) A variable cost (b) A fixed cost (c) A mixed cost.
-
What is net present value? Can it ever be negative? Explain.
-
Hobart Company manufactures attach cases and suitcases. It has five manufacturing departments. The Molding, Component, and Assembly departments convert raw materials into finished goods; hence, they...
-
Discuss the main differences between the traditional and the modern finance paradigm in understanding the behavior of individual investors.
-
Discuss the disposition effect and the proposed explanations for this effect.
-
Define and describe the process of worrying within the finance domain.

Study smarter with the SolutionInn App