

Looking at the chart showing the number of institutions and their assets, deposits, equity, and income and
Fantastic news! We've Found the answer you've been seeking!
Question:
Looking at the chart showing the number of institutions and their assets, deposits, equity, and income and profitability data from 2007-2018 comment on the significant changes in each category for each institution.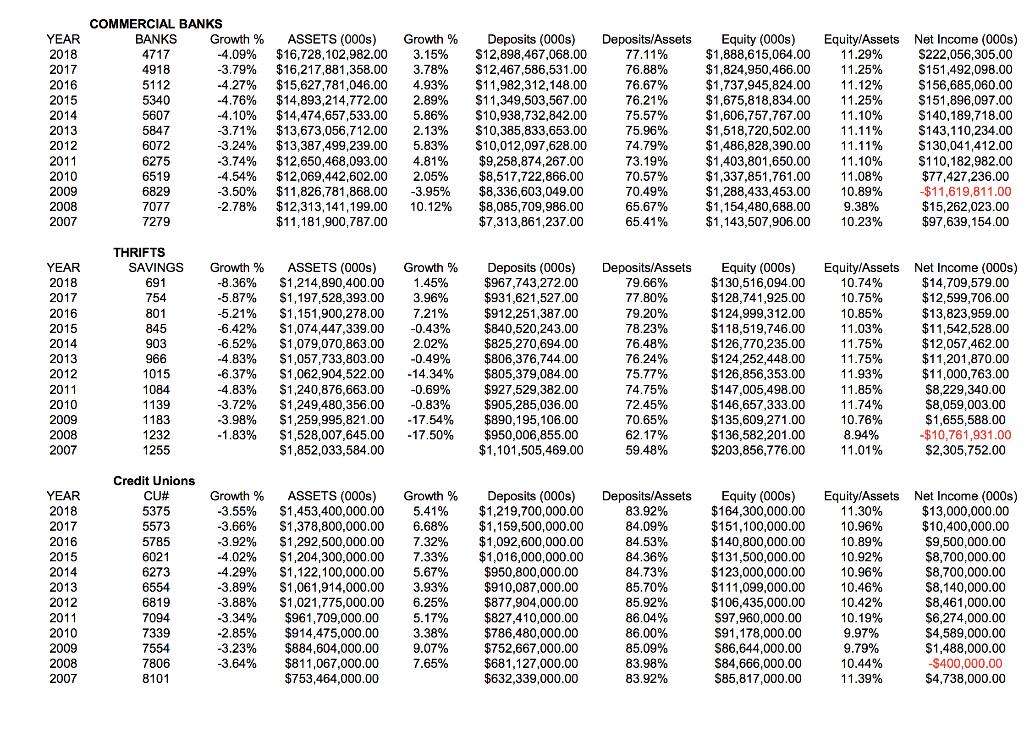
Transcribed Image Text:
YEAR 2018 2017 2016 2015 2014 2013 2012 2011 2010 2009 2008 2007 YEAR 2018 2017 2016 2015 2014 2013 2012 2011 2010 2009 2008 2007 YEAR 2018 2017 2016 2015 2014 2013 2012 2011 2010 2009 2008 2007 COMMERCIAL BANKS BANKS 4717 4918 5112 5340 5607 5847 6072 6275 6519 6829 7077 7279 THRIFTS SAVINGS 691 754 801 845 903 966 1015 1084 1139 1183 1232 1255 Credit Unions CU# 5375 5573 5785 6021 6273 6554 6819 7094 7339 7554 7806 8101 Growth % ASSETS (000s) Growth % -4.09% $16,728,102,982.00 3.15% -3.79% $16,217,881,358.00 3.78% $12,467,586,531.00 -4.27% $15,627,781,046.00 4.93% $11,982,312,148.00 -4.76% $14,893,214,772.00 2.89% $11,349,503,567.00 -4.10% $14,474,657,533.00 5.86% $10,938,732,842.00 -3.71% $13,673,056,712.00 2.13% $10,385,833,653.00 -3.24% $13,387,499,239.00 5.83% $10,012,097,628.00 -3.74% $12,650,468,093.00 4.81% $9,258,874,267.00 -4.54% $12,069,442,602.00 2.05% $8,517,722,866.00 $8,336,603,049.00 $8,085,709,986.00 $7,313,861,237.00 -3.50% -2.78% $11,826,781,868.00 -3.95% $12,313,141,199.00 10.12% $11,181,900,787.00 Growth % ASSETS (000s) Growth % -8.36% $1,214,890,400.00 1.45% -5.87% $1,197,528,393.00 3.96% -5.21% $1,151,900,278.00 7.21% -6.42% $1,074,447,339.00 -0.43% -6.52% $1,079,070,863.00 2.02% -4.83% $1,057,733,803.00 -0.49% -6.37% $1,062,904,522.00 -14.34% -4.83% $1,240,876,663.00 -0.69% -3.72% $1,249,480,356.00 -0.83% -3.98% $1,259,995,821.00 -17.54% -1.83% $1,528,007,645.00 -17.50% $1,852,033,584.00 Growth % -3.55% -3.66% ASSETS (000s) Growth % $1,453,400,000.00 5.41% $1,378,800,000.00 6.68% -3.92% $1,292,500,000.00 7.32% -4.02% $1,204,300,000.00 7.33% -4.29% $1,122,100,000.00 5.67% -3.89% $1,061,914,000.00 3.93% -3.88% $1,021,775,000.00 6.25% -3.34% $961,709,000.00 5.17% $914,475,000.00 3.38% $884,604,000.00 9.07% $811,067,000.00 7.65% $753,464,000.00 Deposits (000s) Deposits/Assets $12,898,467,068.00 77.11% 76.88% 76.67% 76.21% 75.57% 75.96% 74.79% 73.19% 70.57% 70.49% 65.67% 65.41% -2.85% -3.23% -3.64% Deposits (000s) $967,743,272.00 $931,621,527.00 $912,251,387.00 $840,520,243.00 $825,270,694.00 $806,376,744.00 $805,379,084.00 $927,529,382.00 $905,285,036.00 $890,195,106.00 $950,006,855.00 $1,101,505,469.00 Deposits/Assets 79.66% 77.80% 79.20% 78.23% 76.48% 76.24% 75.77% 74.75% 72.45% 70.65% 62.17% 59.48% Deposits (000s) Deposits/Assets $1,219,700,000.00 $1,159,500,000.00 $1,092,600,000.00 $1,016,000,000.00 $950,800,000.00 $910,087,000.00 $877,904,000.00 $827,410,000.00 $786,480,000.00 $752,667,000.00 $681,127,000.00 $632,339,000.00 83.92% 84.09% 84.53% 84.36% 84.73% 85.70% 85.92% 86.04% 86.00% 85.09% 83.98% 83.92% Equity (000s) Equity/Assets $1,888,615,064.00 11.29% $1,824,950,466.00 11.25% $1,737,945,824.00 11.12% $1,675,818,834.00 11.25% $1,606,757,767.00 11.10% $1,518,720,502.00 11.11% $1,486,828,390.00 11.11% $1,403,801,650.00 11.10% $1,337,851,761.00 11.08% $1,288,433,453.00 10.89% $1,154,480,688.00 9.38% $1,143,507,906.00 10.23% Net Income (000s) $222,056,305.00 $151,492,098.00 10.75% 10.85% 11.03% 11.75% 11.75% 11.93% 11.85% 11.74% 10.76% 8.94% 11.01% $156,685,060.00 $151,896,097.00 $140,189,718.00 $143,110,234.00 $130,041,412.00 $110,182,982.00 $77,427,236.00 -$11,619,811.00 $15,262,023.00 $97,639,154.00 10.74% $14.709,579.00 Equity (000s) Equity/Assets Net Income (000s) $130,516,094.00 $128,741,925.00 $124,999,312.00 $118,519,746.00 $126,770,235.00 $124,252,448.00 $126,856,353.00 $147,005,498.00 $146,657,333.00 $135,609,271.00 $136,582,201.00 $12,599,706.00 $13,823,959.00 $11,542,528.00 $12,057,462.00 $11,201,870.00 $11,000,763.00 $8,229,340.00 $8,059,003.00 $1,655,588.00 -$10,761,931.00 $203,856,776.00 $2,305,752.00 Equity (000s) Equity/Assets Net Income (000s) $164,300,000.00 11.30% $13,000,000.00 $10,400,000.00 $151,100,000.00 10.96% $140,800,000.00 10.89% $131,500,000.00 10.92% $123,000,000.00 10.96% $111,099,000.00 10.46% $106,435,000.00 10.42% $97,960,000.00 10.19% $91,178,000.00 9.97% $86,644,000.00 9.79% $84,666,000.00 10.44% $85,817,000.00 11.39% $9,500,000.00 $8,700,000.00 $8,700,000.00 $8,140,000.00 $8,461,000.00 $6,274,000.00 $4,589,000.00 $1,488,000.00 -$400,000.00 $4,738,000.00 YEAR 2018 2017 2016 2015 2014 2013 2012 2011 2010 2009 2008 2007 YEAR 2018 2017 2016 2015 2014 2013 2012 2011 2010 2009 2008 2007 YEAR 2018 2017 2016 2015 2014 2013 2012 2011 2010 2009 2008 2007 COMMERCIAL BANKS BANKS 4717 4918 5112 5340 5607 5847 6072 6275 6519 6829 7077 7279 THRIFTS SAVINGS 691 754 801 845 903 966 1015 1084 1139 1183 1232 1255 Credit Unions CU# 5375 5573 5785 6021 6273 6554 6819 7094 7339 7554 7806 8101 Growth % ASSETS (000s) Growth % -4.09% $16,728,102,982.00 3.15% -3.79% $16,217,881,358.00 3.78% $12,467,586,531.00 -4.27% $15,627,781,046.00 4.93% $11,982,312,148.00 -4.76% $14,893,214,772.00 2.89% $11,349,503,567.00 -4.10% $14,474,657,533.00 5.86% $10,938,732,842.00 -3.71% $13,673,056,712.00 2.13% $10,385,833,653.00 -3.24% $13,387,499,239.00 5.83% $10,012,097,628.00 -3.74% $12,650,468,093.00 4.81% $9,258,874,267.00 -4.54% $12,069,442,602.00 2.05% $8,517,722,866.00 $8,336,603,049.00 $8,085,709,986.00 $7,313,861,237.00 -3.50% -2.78% $11,826,781,868.00 -3.95% $12,313,141,199.00 10.12% $11,181,900,787.00 Growth % ASSETS (000s) Growth % -8.36% $1,214,890,400.00 1.45% -5.87% $1,197,528,393.00 3.96% -5.21% $1,151,900,278.00 7.21% -6.42% $1,074,447,339.00 -0.43% -6.52% $1,079,070,863.00 2.02% -4.83% $1,057,733,803.00 -0.49% -6.37% $1,062,904,522.00 -14.34% -4.83% $1,240,876,663.00 -0.69% -3.72% $1,249,480,356.00 -0.83% -3.98% $1,259,995,821.00 -17.54% -1.83% $1,528,007,645.00 -17.50% $1,852,033,584.00 Growth % -3.55% -3.66% ASSETS (000s) Growth % $1,453,400,000.00 5.41% $1,378,800,000.00 6.68% -3.92% $1,292,500,000.00 7.32% -4.02% $1,204,300,000.00 7.33% -4.29% $1,122,100,000.00 5.67% -3.89% $1,061,914,000.00 3.93% -3.88% $1,021,775,000.00 6.25% -3.34% $961,709,000.00 5.17% $914,475,000.00 3.38% $884,604,000.00 9.07% $811,067,000.00 7.65% $753,464,000.00 Deposits (000s) Deposits/Assets $12,898,467,068.00 77.11% 76.88% 76.67% 76.21% 75.57% 75.96% 74.79% 73.19% 70.57% 70.49% 65.67% 65.41% -2.85% -3.23% -3.64% Deposits (000s) $967,743,272.00 $931,621,527.00 $912,251,387.00 $840,520,243.00 $825,270,694.00 $806,376,744.00 $805,379,084.00 $927,529,382.00 $905,285,036.00 $890,195,106.00 $950,006,855.00 $1,101,505,469.00 Deposits/Assets 79.66% 77.80% 79.20% 78.23% 76.48% 76.24% 75.77% 74.75% 72.45% 70.65% 62.17% 59.48% Deposits (000s) Deposits/Assets $1,219,700,000.00 $1,159,500,000.00 $1,092,600,000.00 $1,016,000,000.00 $950,800,000.00 $910,087,000.00 $877,904,000.00 $827,410,000.00 $786,480,000.00 $752,667,000.00 $681,127,000.00 $632,339,000.00 83.92% 84.09% 84.53% 84.36% 84.73% 85.70% 85.92% 86.04% 86.00% 85.09% 83.98% 83.92% Equity (000s) Equity/Assets $1,888,615,064.00 11.29% $1,824,950,466.00 11.25% $1,737,945,824.00 11.12% $1,675,818,834.00 11.25% $1,606,757,767.00 11.10% $1,518,720,502.00 11.11% $1,486,828,390.00 11.11% $1,403,801,650.00 11.10% $1,337,851,761.00 11.08% $1,288,433,453.00 10.89% $1,154,480,688.00 9.38% $1,143,507,906.00 10.23% Net Income (000s) $222,056,305.00 $151,492,098.00 10.75% 10.85% 11.03% 11.75% 11.75% 11.93% 11.85% 11.74% 10.76% 8.94% 11.01% $156,685,060.00 $151,896,097.00 $140,189,718.00 $143,110,234.00 $130,041,412.00 $110,182,982.00 $77,427,236.00 -$11,619,811.00 $15,262,023.00 $97,639,154.00 10.74% $14.709,579.00 Equity (000s) Equity/Assets Net Income (000s) $130,516,094.00 $128,741,925.00 $124,999,312.00 $118,519,746.00 $126,770,235.00 $124,252,448.00 $126,856,353.00 $147,005,498.00 $146,657,333.00 $135,609,271.00 $136,582,201.00 $12,599,706.00 $13,823,959.00 $11,542,528.00 $12,057,462.00 $11,201,870.00 $11,000,763.00 $8,229,340.00 $8,059,003.00 $1,655,588.00 -$10,761,931.00 $203,856,776.00 $2,305,752.00 Equity (000s) Equity/Assets Net Income (000s) $164,300,000.00 11.30% $13,000,000.00 $10,400,000.00 $151,100,000.00 10.96% $140,800,000.00 10.89% $131,500,000.00 10.92% $123,000,000.00 10.96% $111,099,000.00 10.46% $106,435,000.00 10.42% $97,960,000.00 10.19% $91,178,000.00 9.97% $86,644,000.00 9.79% $84,666,000.00 10.44% $85,817,000.00 11.39% $9,500,000.00 $8,700,000.00 $8,700,000.00 $8,140,000.00 $8,461,000.00 $6,274,000.00 $4,589,000.00 $1,488,000.00 -$400,000.00 $4,738,000.00
Expert Answer:

Related Book For 
Niebels Methods, Standards and Work Design
ISBN: 978-0073376318
13th edition
Authors: Andris Freivalds, Benjamin Niebel
Posted Date:
Students also viewed these finance questions
-
Using the from-to chart showing the number of units handled from one area to another per hour and the desired size of each area (in square feet), develop an optimal layout using Muther's SLP. Note...
-
Produce a chart showing the number of moves required to solve the Towers of Hanoi puzzle using the following numbers of disks: 2, 3, 4, 5, 6, 7, 8, 9, 10, 15, 20, and 25.
-
Which of the following statements are true? Free cash flow is the cash flow Check all that apply: free to be used for capital expenditure and change in net operating working capital. free to be paid...
-
Write a brief paper on the following topic: "Why have gasoline prices risen so high in the recent years?" Write down the reasons and divide into supply and demand effects on the market. Describe the...
-
Should there be more government intervention in the exploration for and pricing of petroleum products? Why or why not?
-
A company is studying three different safety programs, A, B, and C, in an attempt to reduce the number of work-hours lost because of accidents. Each program is to be tried at three of the companys...
-
The difference between merchandise available for sale and the end-of-period merchandise inventory is called (a) gross profit. (c) net sales. (b) net purchases. (d) cost of goods sold.
-
Stefani Company has gathered the following information about its product. Direct materials. Each unit of product contains 4.5 pounds of materials. The average waste and spoilage per unit produced...
-
This information relates to Oriole Co. 1. On April 5, purchased merchandise on account from Grouper Company for $27,900, terms 4/10, net/30, FOB shipping point. 2. On April 6, paid freight costs ...
-
The Golden Oranges Nursery, which provides facilities for pre-school children on a commercial basis, is preparing its cash budget for next year. A profile of the estimated revenues and expenses for...
-
Listing price ($) 1,000 342,365 318,000 125,914 135,300 265,250 381,600 987,600 Cost per square foot ($) 1,000 169 166 41 71 139 191 344 Square feet 1,000 2,111 1,881 921 1,101 1,626 2,215 6,516 This...
-
questions about this progr wer the foll function problem2_79 2 clo 3 n = 3; 4 x zeros (n, 1); 3A[3 10 -5; -4 1 2; 1 1 -4]; 6 b[-2; 1; 0]; 7 Rnorm (A+x-b); sk=0; 9 fprintf('k \t err ') 10 fprintf( 2d...
-
If total income tax expense is $42,400 and deferred tax expense is $59,100, then the current portion of the total income tax expense is referred to as a current tax If a corporation's tax return...
-
Divide: 18y10 80yz
-
In a closed system 0.15 kg of gas at 350 K is expanded isothermally and reversibly from 1MPa pressure to 200 kPa. Given that Cv = 718 j/kg K and R = 287 J/kg K Determine: A. The work done b. The...
-
Find a controversial foreign policy issue and discuss how the president and other decision-making players interacted to address it. Highlight aspects related to interaction, strategy, personality,...
-
Helix Corp's equity beta is 1.5 and its tax rate is 0.3. The 10-year Treasury bond rate is 2.75% and the historical risk premium over the risk free rate is 5.0%. What is the firm's cost of equity?...
-
Write a paper about how diet relates to breast cancer in women study design to use: case control study purpose & rationale the purpose of this final project is to utilize the methods and...
-
Complete the time study by filling in the circles. Then, calculate a standard time for an 8 hr job. Assume a 10% allowance
-
Develop a formula for the relationship between time and area from the following data: Study No. Time Area 28.6 79.4 3 11 182.0 4 15 318.0 21 589.0
-
Which factors enter into large variances in operator performance?
-
The Harvey Corporation is considering a change in its cash-only policy. The new terms would be net one period. Based on the following information, determine if Harvey should proceed or not. The...
-
Ogello, Inc., is considering a change in its cash-only sales policy. The new terms of sale would be net one month. Based on the following information, determine if Ogello should proceed or not....
-
La Bartolomeo Systems currently has an allcash credit policy. It is considering making a change in the credit policy by going to terms of net 30 days. Based on the following information, what do you...
Computer Science Discovering Gods Glory In Ones And Zeros 1st Edition - ISBN: 1596389907 - Free Book

Study smarter with the SolutionInn App