

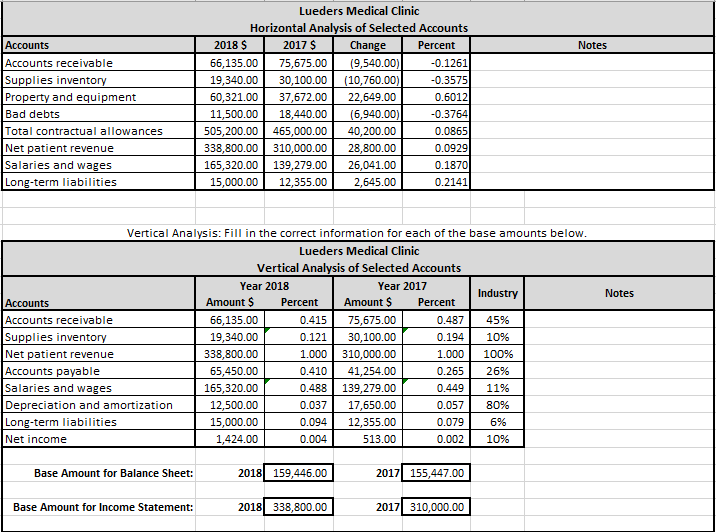
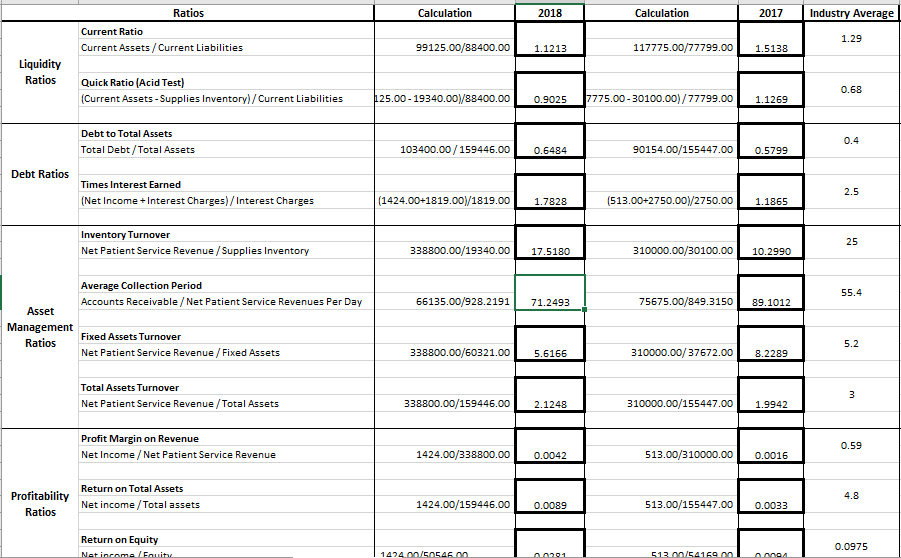
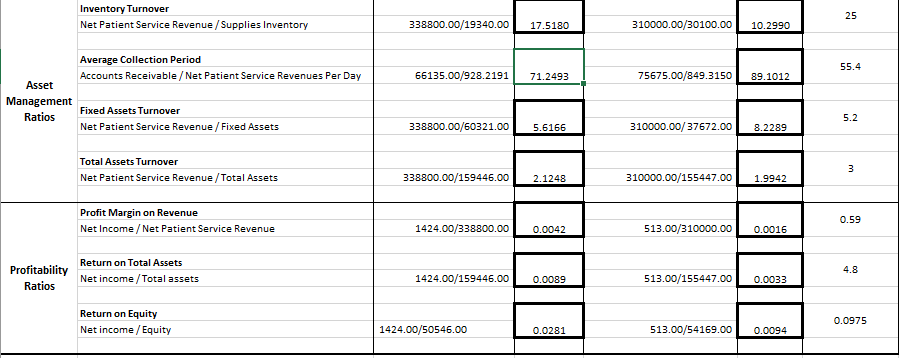
Once you have completed your financial analysis, interpret the ratios and vertical and horizontal analyses to evaluate
Fantastic news! We've Found the answer you've been seeking!
Question:
Once you have completed your financial analysis, interpret the ratios and vertical and horizontal analyses to evaluate the business performance of Lueders Medical Clinic.
In your brief, make sure to refer to your financial analysis workbook. It is important that you explain what each ratio tells you about the clinic?s performance. Then, recommend whether it is a good investment for the hospital to purchase the clinic. Use your financial analysis workbook to explain your decision.
Specifically, address the following in your brief:
- Examine the clinic?s financial performance.
- How does the clinic?s financial performance compare against industry averages and past performance?
- What are the strengths and weaknesses of the clinic?s financial performance?
- Recommend appropriate actions using your financial analysis as support.
- Is purchasing the clinic is a good or bad investment?
- What are some potential areas of improvement?
Expert Answer:
s Medical Clinic 20172018 Financial Statements Lueders Medical Clinic Income Statement Year Ended December 31 Operating Revenue 2017 2018 Gross patien... View the full answer

Related Book For 

Financial Accounting Theory and Analysis Text and Cases
ISBN: 978-1118582794
11th edition
Authors: Richard G. Schroeder, Myrtle W. Clark, Jack Cathey
Posted Date:
