

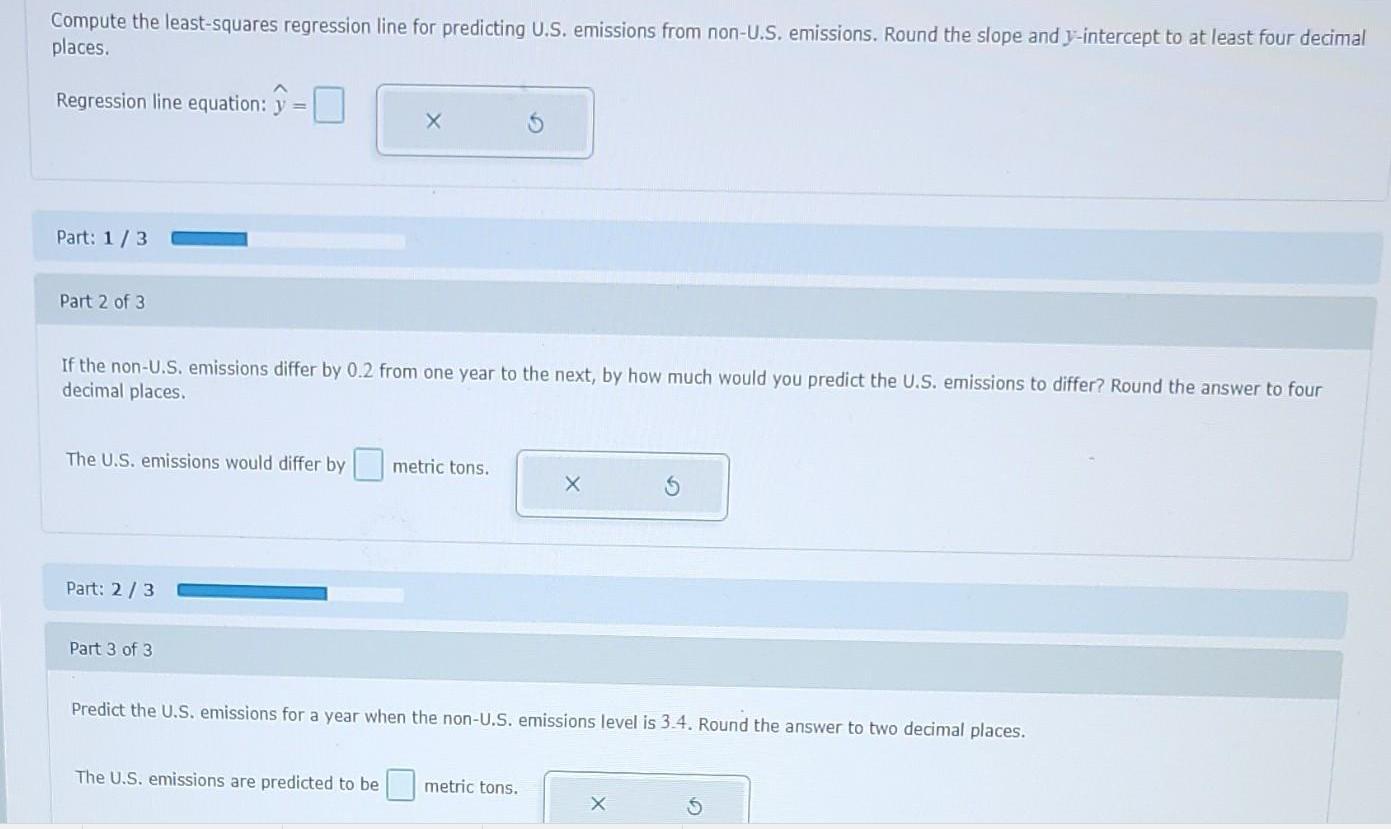
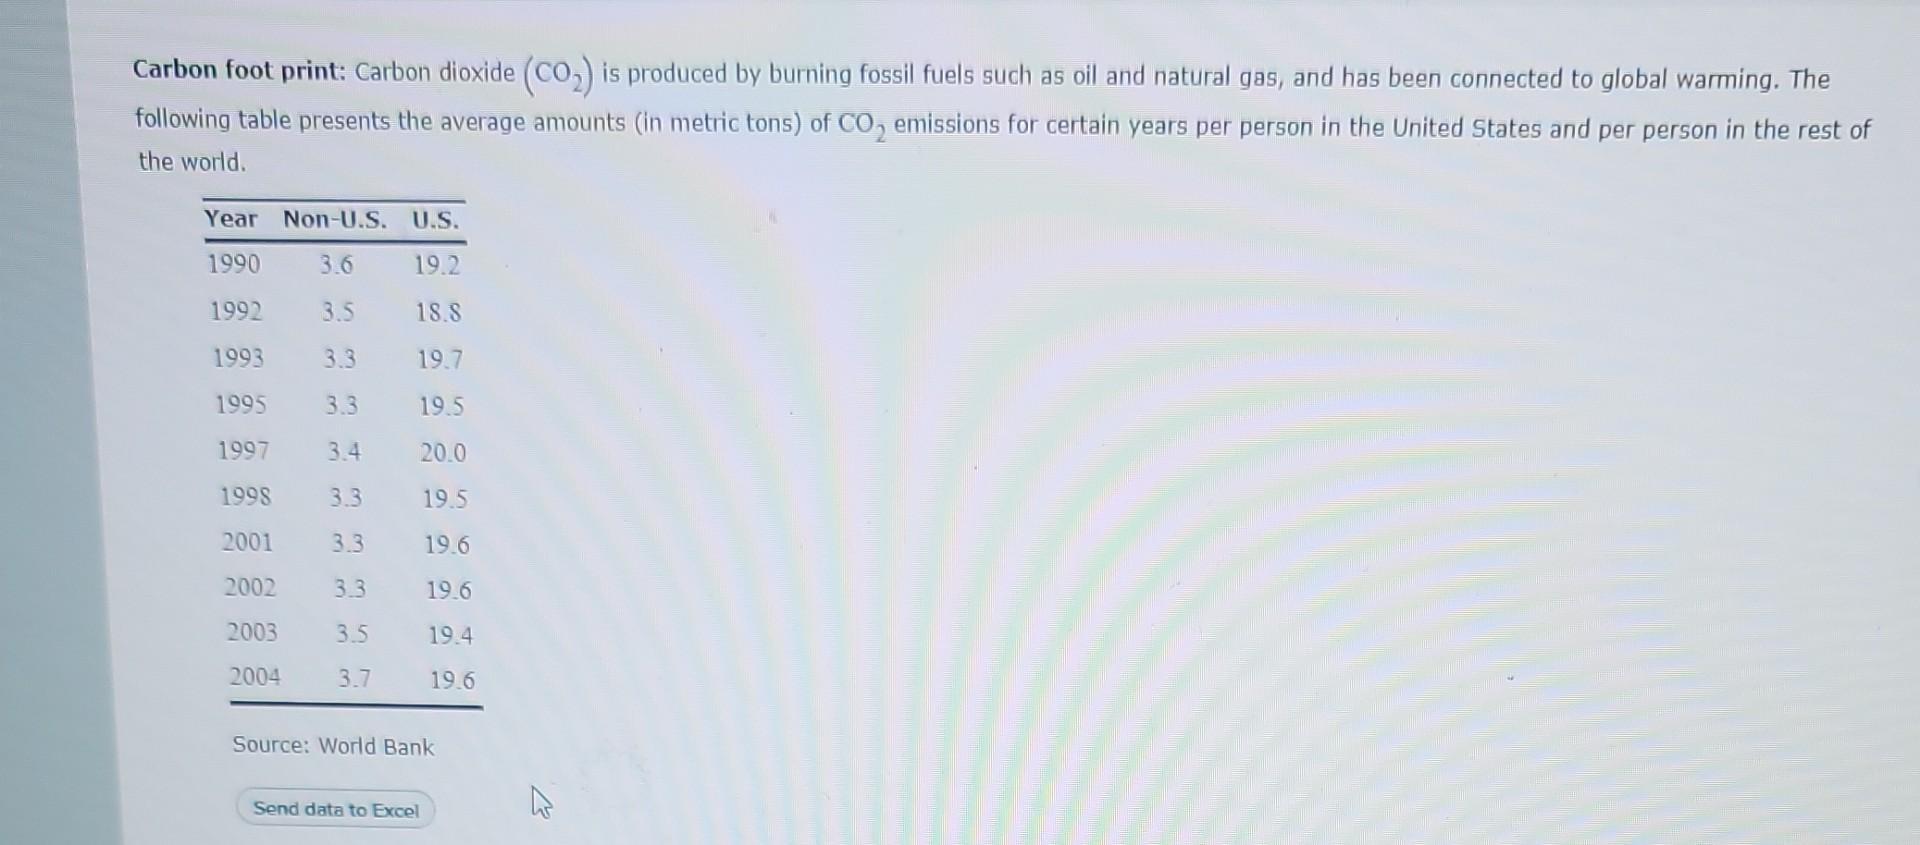
Compute the least-squares regression line for predicting U.S. emissions from non-U.S. emissions. Round the slope and...
Fantastic news! We've Found the answer you've been seeking!
Question:
Expert Answer:

Related Book For 

Posted Date:
