

Part 1: Multiple Choice & Short Answer 1. An analyst has gathered the following information about...
Fantastic news! We've Found the answer you've been seeking!
Question:
Transcribed Image Text:
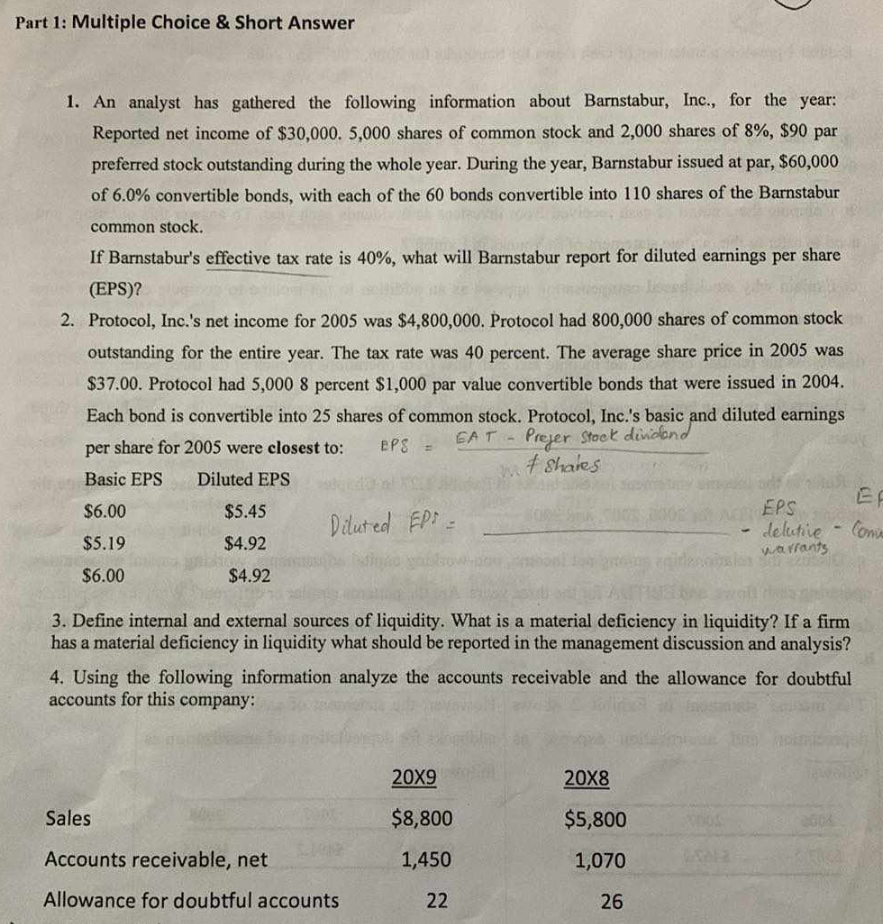
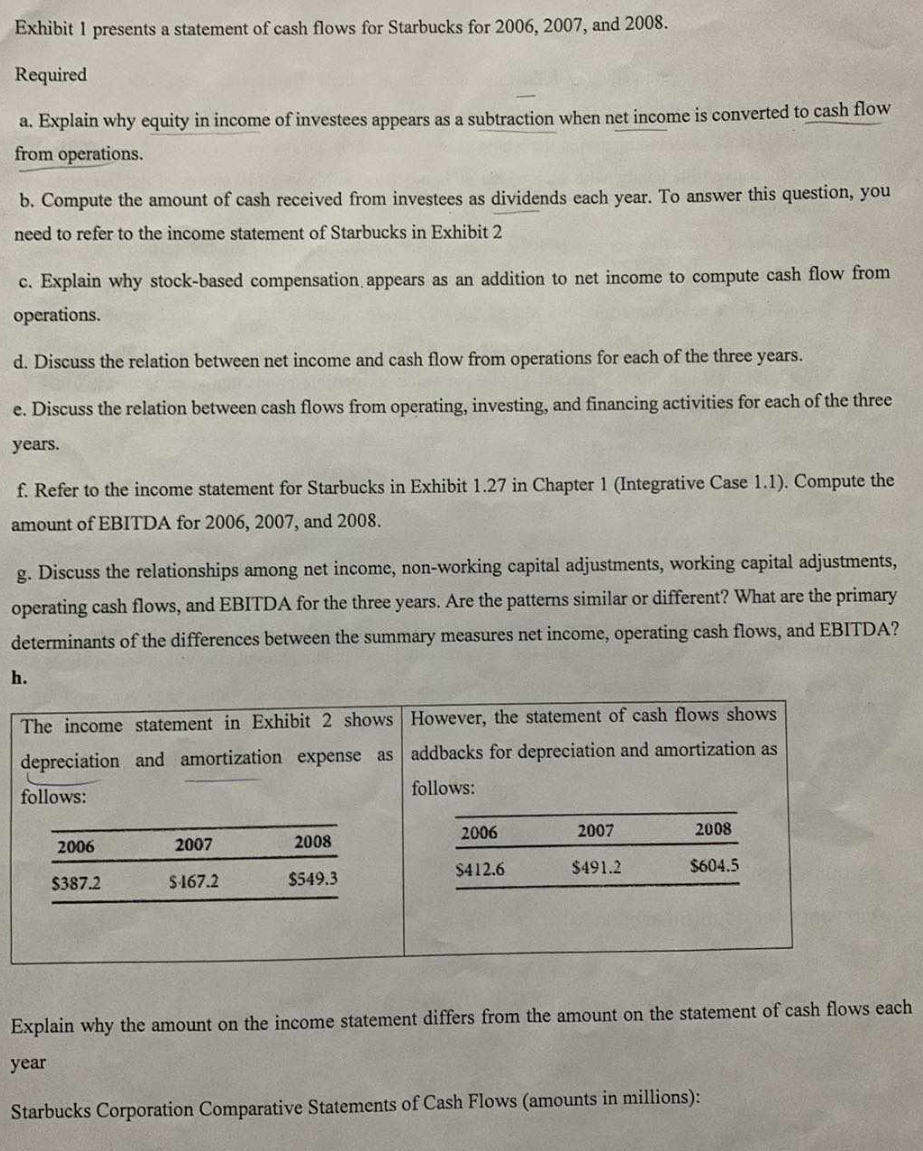
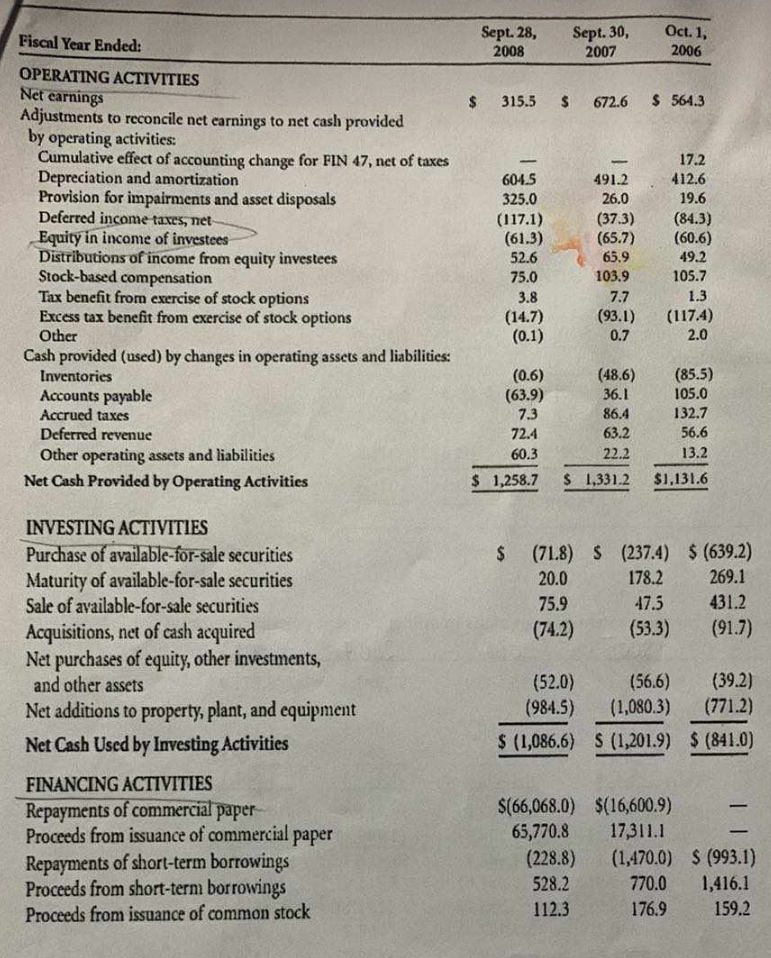
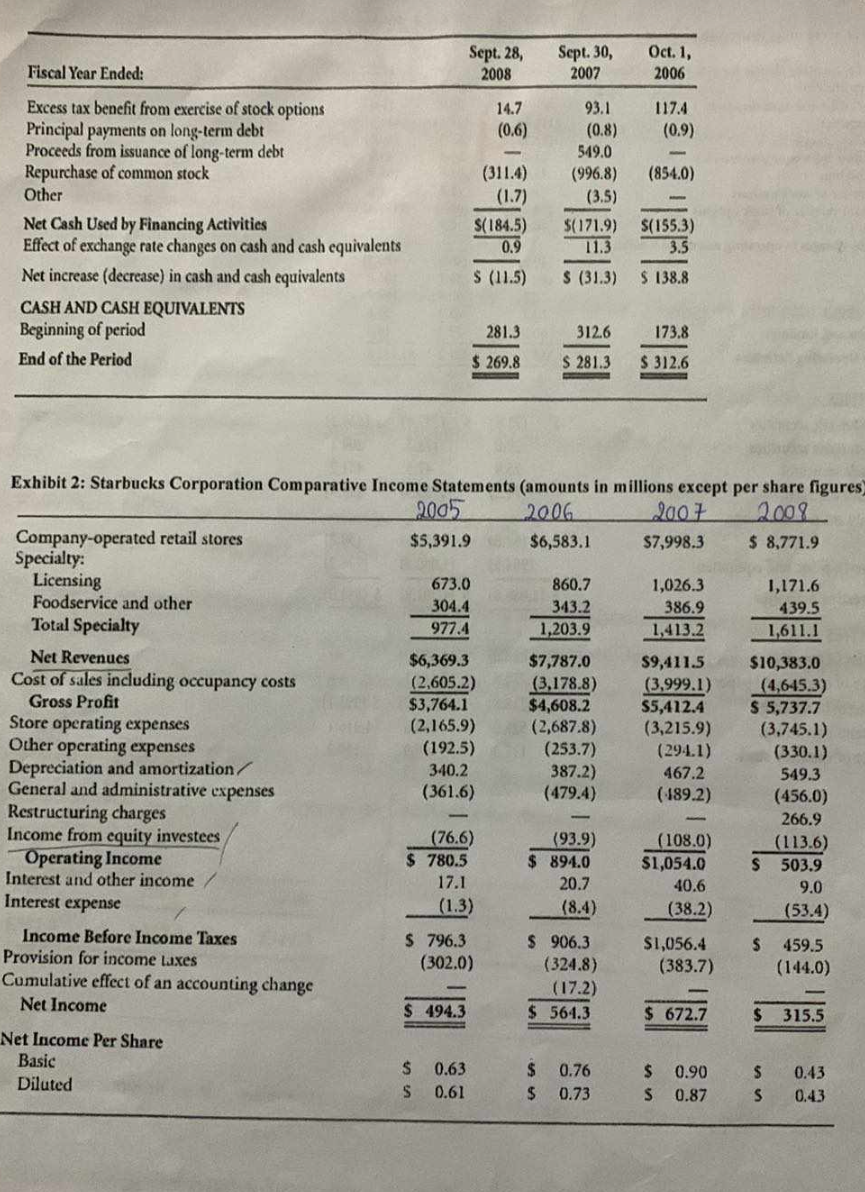
Part 1: Multiple Choice & Short Answer 1. An analyst has gathered the following information about Barnstabur, Inc., for the year: Reported net income of $30,000. 5,000 shares of common stock and 2,000 shares of 8%, $90 par preferred stock outstanding during the whole year. During the year, Barnstabur issued at par, $60,000 of 6.0% convertible bonds, with each of the 60 bonds convertible into 110 shares of the Barnstabur common stock. If Barnstabur's effective tax rate is 40%, what will Barnstabur report for diluted earnings per share (EPS)? Lis 2. Protocol, Inc.'s net income for 2005 was $4,800,000. Protocol had 800,000 shares of common stock outstanding for the entire year. The tax rate was 40 percent. The average share price in 2005 was $37.00. Protocol had 5,000 8 percent $1,000 par value convertible bonds that were issued in 2004. Each bond is convertible into 25 shares of common stock. Protocol, Inc.'s basic and diluted earnings share for 2005 were closest to: per EPS = EAT Prefer Stock dividend # shares Basic EPS $6.00 $5.19 Diluted EPS $5.45 Diluted EPS $4.92 $4.92 EF EPS delutive Com warrants - $6.00 3. Define internal and external sources of liquidity. What is a material deficiency in liquidity? If a firm has a material deficiency in liquidity what should be reported in the management discussion and analysis? 4. Using the following information analyze the accounts receivable and the allowance for doubtful accounts for this company: 20X9 20X8 Sales $8,800 $5,800 Accounts receivable, net 1,450 1,070 Allowance for doubtful accounts 22 26 Exhibit 1 presents a statement of cash flows for Starbucks for 2006, 2007, and 2008. Required a. Explain why equity in income of investees appears as a subtraction when net income is converted to cash flow from operations. b. Compute the amount of cash received from investees as dividends each year. To answer this question, you need to refer to the income statement of Starbucks in Exhibit 2 c. Explain why stock-based compensation appears as an addition to net income to compute cash flow from operations. d. Discuss the relation between net income and cash flow from operations for each of the three years. e. Discuss the relation between cash flows from operating, investing, and financing activities for each of the three years. f. Refer to the income statement for Starbucks in Exhibit 1.27 in Chapter 1 (Integrative Case 1.1). Compute the amount of EBITDA for 2006, 2007, and 2008. g. Discuss the relationships among net income, non-working capital adjustments, working capital adjustments, operating cash flows, and EBITDA for the three years. Are the patterns similar or different? What are the primary determinants of the differences between the summary measures net income, operating cash flows, and EBITDA? h. The income statement in Exhibit 2 shows depreciation and amortization expense as follows: However, the statement of cash flows shows addbacks for depreciation and amortization as follows: 2006 $387.2 2007 $167.2 2008 $549.3 2006 $412.6 2007 2008 $491.2 $604.5 Explain why the amount on the income statement differs from the amount on the statement of cash flows each year Starbucks Corporation Comparative Statements of Cash Flows (amounts in millions): Fiscal Year Ended: Sept. 28, 2008 Sept. 30, 2007 Oct. 1, 2006 OPERATING ACTIVITIES Net earnings $ 315.5 $ 672.6 $ 564.3 Adjustments to reconcile net earnings to net cash provided by operating activities: Cumulative effect of accounting change for FIN 47, net of taxes 17.2 Depreciation and amortization 604.5 491.2 412.6 Provision for impairments and asset disposals 325.0 26.0 19.6 Deferred income taxes, net- (117.1) (37.3) (84.3) Equity in income of investees (61.3) (65.7) (60.6) Distributions of income from equity investees 52.6 65.9 49.2 Stock-based compensation 75.0 103.9 105.7 Tax benefit from exercise of stock options 3.8 7.7 1.3 Excess tax benefit from exercise of stock options (14.7) (93.1) (117.4) Other (0.1) 0.7 2.0 Cash provided (used) by changes in operating assets and liabilities: Inventories (0.6) (48.6) (85.5) Accounts payable (63.9) 36.1 105.0 Accrued taxes 7.3 86.4 132.7 Deferred revenue 72.4 63.2 56.6 Other operating assets and liabilities 60.3 22.2 13.2 Net Cash Provided by Operating Activities INVESTING ACTIVITIES Purchase of available-for-sale securities Maturity of available-for-sale securities Sale of available-for-sale securities Acquisitions, net of cash acquired Net purchases of equity, other investments, and other assets Net additions to property, plant, and equipment Net Cash Used by Investing Activities FINANCING ACTIVITIES $ 1,258.7 $ 1,331.2 $1,131.6 $ (71.8) $ (237.4) $ (639.2) 269.1 20.0 178.2 75.9 47.5 431.2 (74.2) (53.3) (91.7) (52.0) (56.6) (39.2) (984.5) (1,080.3) (771.2) $ (1,086.6) S (1,201.9) $ (841.0) $(66,068.0) $(16,600.9) Repayments of commercial paper Proceeds from issuance of commercial Repayments of short-term borrowings Proceeds from short-term borrowings Proceeds from issuance of common stock paper 65,770.8 17,311.1 - (228.8) (1,470.0) $ (993.1) 528.2 770.0 1,416.1 112.3 176.9 159.2 Sept. 28, Sept. 30, Oct. 1, Fiscal Year Ended: 2008 2007 2006 Excess tax benefit from exercise of stock options 14.7 93.1 117.4 Principal payments on long-term debt (0.6) (0.8) (0.9) Proceeds from issuance of long-term debt 549.0 Repurchase of common stock (311.4) (996.8) (854.0) Other (1.7) (3.5) Net Cash Used by Financing Activities $(184.5) $(171.9) Effect of exchange rate changes on cash and cash equivalents 0.9 11.3 $(155.3) 3.5 Net increase (decrease) in cash and cash equivalents CASH AND CASH EQUIVALENTS $ (11.5) $ (31.3) $ 138.8 Beginning of period End of the Period 281.3 312.6 173.8 $ 269.8 $ 281.3 $312.6 Exhibit 2: Starbucks Corporation Comparative Income Statements (amounts in millions except per share figures) 2008 Company-operated retail stores 2005 $5,391.9 2006 2007 $6,583.1 $7,998.3 $ 8,771.9 Specialty: Licensing 673.0 860.7 1,026.3 1,171.6 Foodservice and other 304.4 343.2 386.9 439.5 Total Specialty 977.4 1,203.9 1,413.2 1,611.1 Net Revenues $6,369.3 $7,787.0 $9,411.5 $10,383.0 Cost of sales including occupancy costs (2.605.2) (3,178.8) (3,999.1) (4,645.3) Gross Profit $3,764.1 $4,608.2 $5,412.4 Store operating expenses (2,165.9) (2,687.8) (3,215.9) Other operating expenses (192.5) (253.7) (294.1) $ 5,737.7 (3,745.1) (330.1) Depreciation and amortization/ 340.2 387.2) 467.2 549.3 General and administrative expenses (361.6) (479.4) (189.2) (456.0) Restructuring charges Income from equity investees Operating Income (76.6) $ 780.5 (93.9) (108.0) $ 894.0 $1,054.0 Interest and other income Interest expense 17.1 (1.3) 20.7 (8.4) 40.6 (38.2) 266.9 (113.6) $ 503.9 9.0 (53.4) Income Before Income Taxes $ 796.3 Provision for income taxes Cumulative effect of an accounting change (302.0) $ 906.3 (324.8) (17.2) $1,056.4 (383.7) $ 459.5 (144.0) $ 494.3 $ 564.3 $ 672.7 $ 315.5 Net Income Net Income Per Share Basic Diluted $ 0.63 $ 0.61 $ 0.76 $ 0.90 $ 0.43 $ 0.73 $ 0.87 S 0.43 Part 1: Multiple Choice & Short Answer 1. An analyst has gathered the following information about Barnstabur, Inc., for the year: Reported net income of $30,000. 5,000 shares of common stock and 2,000 shares of 8%, $90 par preferred stock outstanding during the whole year. During the year, Barnstabur issued at par, $60,000 of 6.0% convertible bonds, with each of the 60 bonds convertible into 110 shares of the Barnstabur common stock. If Barnstabur's effective tax rate is 40%, what will Barnstabur report for diluted earnings per share (EPS)? Lis 2. Protocol, Inc.'s net income for 2005 was $4,800,000. Protocol had 800,000 shares of common stock outstanding for the entire year. The tax rate was 40 percent. The average share price in 2005 was $37.00. Protocol had 5,000 8 percent $1,000 par value convertible bonds that were issued in 2004. Each bond is convertible into 25 shares of common stock. Protocol, Inc.'s basic and diluted earnings share for 2005 were closest to: per EPS = EAT Prefer Stock dividend # shares Basic EPS $6.00 $5.19 Diluted EPS $5.45 Diluted EPS $4.92 $4.92 EF EPS delutive Com warrants - $6.00 3. Define internal and external sources of liquidity. What is a material deficiency in liquidity? If a firm has a material deficiency in liquidity what should be reported in the management discussion and analysis? 4. Using the following information analyze the accounts receivable and the allowance for doubtful accounts for this company: 20X9 20X8 Sales $8,800 $5,800 Accounts receivable, net 1,450 1,070 Allowance for doubtful accounts 22 26 Exhibit 1 presents a statement of cash flows for Starbucks for 2006, 2007, and 2008. Required a. Explain why equity in income of investees appears as a subtraction when net income is converted to cash flow from operations. b. Compute the amount of cash received from investees as dividends each year. To answer this question, you need to refer to the income statement of Starbucks in Exhibit 2 c. Explain why stock-based compensation appears as an addition to net income to compute cash flow from operations. d. Discuss the relation between net income and cash flow from operations for each of the three years. e. Discuss the relation between cash flows from operating, investing, and financing activities for each of the three years. f. Refer to the income statement for Starbucks in Exhibit 1.27 in Chapter 1 (Integrative Case 1.1). Compute the amount of EBITDA for 2006, 2007, and 2008. g. Discuss the relationships among net income, non-working capital adjustments, working capital adjustments, operating cash flows, and EBITDA for the three years. Are the patterns similar or different? What are the primary determinants of the differences between the summary measures net income, operating cash flows, and EBITDA? h. The income statement in Exhibit 2 shows depreciation and amortization expense as follows: However, the statement of cash flows shows addbacks for depreciation and amortization as follows: 2006 $387.2 2007 $167.2 2008 $549.3 2006 $412.6 2007 2008 $491.2 $604.5 Explain why the amount on the income statement differs from the amount on the statement of cash flows each year Starbucks Corporation Comparative Statements of Cash Flows (amounts in millions): Fiscal Year Ended: Sept. 28, 2008 Sept. 30, 2007 Oct. 1, 2006 OPERATING ACTIVITIES Net earnings $ 315.5 $ 672.6 $ 564.3 Adjustments to reconcile net earnings to net cash provided by operating activities: Cumulative effect of accounting change for FIN 47, net of taxes 17.2 Depreciation and amortization 604.5 491.2 412.6 Provision for impairments and asset disposals 325.0 26.0 19.6 Deferred income taxes, net- (117.1) (37.3) (84.3) Equity in income of investees (61.3) (65.7) (60.6) Distributions of income from equity investees 52.6 65.9 49.2 Stock-based compensation 75.0 103.9 105.7 Tax benefit from exercise of stock options 3.8 7.7 1.3 Excess tax benefit from exercise of stock options (14.7) (93.1) (117.4) Other (0.1) 0.7 2.0 Cash provided (used) by changes in operating assets and liabilities: Inventories (0.6) (48.6) (85.5) Accounts payable (63.9) 36.1 105.0 Accrued taxes 7.3 86.4 132.7 Deferred revenue 72.4 63.2 56.6 Other operating assets and liabilities 60.3 22.2 13.2 Net Cash Provided by Operating Activities INVESTING ACTIVITIES Purchase of available-for-sale securities Maturity of available-for-sale securities Sale of available-for-sale securities Acquisitions, net of cash acquired Net purchases of equity, other investments, and other assets Net additions to property, plant, and equipment Net Cash Used by Investing Activities FINANCING ACTIVITIES $ 1,258.7 $ 1,331.2 $1,131.6 $ (71.8) $ (237.4) $ (639.2) 269.1 20.0 178.2 75.9 47.5 431.2 (74.2) (53.3) (91.7) (52.0) (56.6) (39.2) (984.5) (1,080.3) (771.2) $ (1,086.6) S (1,201.9) $ (841.0) $(66,068.0) $(16,600.9) Repayments of commercial paper Proceeds from issuance of commercial Repayments of short-term borrowings Proceeds from short-term borrowings Proceeds from issuance of common stock paper 65,770.8 17,311.1 - (228.8) (1,470.0) $ (993.1) 528.2 770.0 1,416.1 112.3 176.9 159.2 Sept. 28, Sept. 30, Oct. 1, Fiscal Year Ended: 2008 2007 2006 Excess tax benefit from exercise of stock options 14.7 93.1 117.4 Principal payments on long-term debt (0.6) (0.8) (0.9) Proceeds from issuance of long-term debt 549.0 Repurchase of common stock (311.4) (996.8) (854.0) Other (1.7) (3.5) Net Cash Used by Financing Activities $(184.5) $(171.9) Effect of exchange rate changes on cash and cash equivalents 0.9 11.3 $(155.3) 3.5 Net increase (decrease) in cash and cash equivalents CASH AND CASH EQUIVALENTS $ (11.5) $ (31.3) $ 138.8 Beginning of period End of the Period 281.3 312.6 173.8 $ 269.8 $ 281.3 $312.6 Exhibit 2: Starbucks Corporation Comparative Income Statements (amounts in millions except per share figures) 2008 Company-operated retail stores 2005 $5,391.9 2006 2007 $6,583.1 $7,998.3 $ 8,771.9 Specialty: Licensing 673.0 860.7 1,026.3 1,171.6 Foodservice and other 304.4 343.2 386.9 439.5 Total Specialty 977.4 1,203.9 1,413.2 1,611.1 Net Revenues $6,369.3 $7,787.0 $9,411.5 $10,383.0 Cost of sales including occupancy costs (2.605.2) (3,178.8) (3,999.1) (4,645.3) Gross Profit $3,764.1 $4,608.2 $5,412.4 Store operating expenses (2,165.9) (2,687.8) (3,215.9) Other operating expenses (192.5) (253.7) (294.1) $ 5,737.7 (3,745.1) (330.1) Depreciation and amortization/ 340.2 387.2) 467.2 549.3 General and administrative expenses (361.6) (479.4) (189.2) (456.0) Restructuring charges Income from equity investees Operating Income (76.6) $ 780.5 (93.9) (108.0) $ 894.0 $1,054.0 Interest and other income Interest expense 17.1 (1.3) 20.7 (8.4) 40.6 (38.2) 266.9 (113.6) $ 503.9 9.0 (53.4) Income Before Income Taxes $ 796.3 Provision for income taxes Cumulative effect of an accounting change (302.0) $ 906.3 (324.8) (17.2) $1,056.4 (383.7) $ 459.5 (144.0) $ 494.3 $ 564.3 $ 672.7 $ 315.5 Net Income Net Income Per Share Basic Diluted $ 0.63 $ 0.61 $ 0.76 $ 0.90 $ 0.43 $ 0.73 $ 0.87 S 0.43
Expert Answer:
Answer rating: 100% (QA)
Diluted earnings per share EPS for Barnstabur Inc can be calculated as follows Net Income available to common shareholders Reported net income Preferred dividends 30000 90 8 2000 1 40 30000 14400 1560... View the full answer

Related Book For 
Financial Reporting and Analysis
ISBN: 978-0078025679
6th edition
Authors: Flawrence Revsine, Daniel Collins, Bruce, Mittelstaedt, Leon
Posted Date:
Students also viewed these accounting questions
-
The condensed income statement for a Fletcher Inc. for the past year is as follows: Sales Product F $300,000 G $210,000 H $340,000 Total $850,000 Costs: Variable costs $180,000 $180,000 $220,000...
-
Please submit a 3 page, double spaced, MLA format, paper on the Iceland financial crisis of 2008-2011.You are to write as if you are the advisor to the Government. Present your best arguments to...
-
During a quiz, Peter is asked to state the capital city of Germany. Which of the following memory types is being tested? spreading activation semantic memory Episodic memory procedural memory What is...
-
A solid of constant density is bounded below by the plane z = 0, on the sides by the elliptical cylinder x 2 + 4y 2 = 4, and above by the plane z = 2 - x. a. Find x and y. b. Evaluate the integral...
-
How does the FE curve relate to the concept of external balance?
-
A student writes the following: "Increased production leads to a lower price, which in turn increases demand." Do you agree with his reasoning? Briefly explain.
-
Determine whether Graph \(Q_{1}\) is a spanning tree of Graph \(Q\). If not, explain how you know. m n
-
B. Higgins, J. Mayo, and N. Rice have capital balances of $95,000, $75,000, and $60,000, respectively. They share income or loss on a 5:3:2 basis. Rice withdraws from the partnership under each of...
-
Please explain \f
-
Pequity Company purchased 85% of the common stock of Sequity Company on April 1, Year 1 for total consideration of $545,000 cash plus $50,000 of contingent consideration as measured according to GAAP...
-
Consider one stock and a risk free bond that gets rate r = 0. Examine the following payoff graph. 3 2 1 Payoffr 2 3 ST How many/much of the following do you need to buy for your portfolio to have the...
-
It is impossible to motivate, only to demotivate. Discuss.
-
Which of the following is likely to be the most effective audit procedure for verifying dividends earned on investments in publicly traded equity securities? a. Trace deposits of dividend checks to...
-
Indicate whether each account listed below is a(n) asset (A), liability (L), owner's equity (OE), revenue ( \(R\) ), or expense ( \(\mathbf{\text { e }}\) ) account. Salaries Payable Land L. Graham,...
-
List five ways you can customize a QuickBooks Accountant report.
-
The audit firm's valuation specialist would likely be brought in to assist in the audit of fair value measurements at an entity when the following is present: a. The entity is a new audit client. b....
-
ASSIGNMENT: OBTAIN THE RECENT FINANCIAL REPORTS OF A PUBLICLY TRADED COMPANY OF YOUR CHOOSING, INCLUDING THE FOLLOWING STATEMENTS 1. 2. INCOME STATEMENT BALANCE SHEET 3. CASH FLOW STATEMENT YOU MAY...
-
What mass of H2 will be produced when 122 g of Zn are reacted? Zn(s) + 2HCl(aq) ( ZnCl2(aq) + H2(g)
-
At December 31, 2013, Oettinger Corporation, a premium kitchen cabinetmaker for the home remodeling industry, reported the following accounts receivable information on its year-end balance sheet:...
-
KW Steel Corp. uses the LIFO method of inventory valuation. Waretown Steel, KWs major competitor, instead uses the FIFO method. The following are excerpts from each companys 2014 financial...
-
Watsontown Yacht Sales has been selling large power cruisers for 25 years. On January 1, 2014, the company had $5,950,000 in inventory (based on a FIFO valuation). While the number of yachts in...
-
The summarised balance sheets of A plc and its two subsidiaries, B Ltd and C Ltd, at 31 December 1992 are shown below: The summarised profit and loss accounts for A plc and B Ltd for the year ended...
-
An investor is interested in daily Value at Risk of his position on holding long \(\$ 0.5\) million of Dell stock and \(\$ 1\) million of Cisco Systems stock. Use 5\% critical values and the daily...
-
Consider the linear regression model with time-series errors in Section 10.5. Assume that \(z_{t}\) is an \(\operatorname{AR}(p)\) process (i.e., \(z_{t}=\phi_{1} z_{t-1}+\cdots+\phi_{p}...

Study smarter with the SolutionInn App