

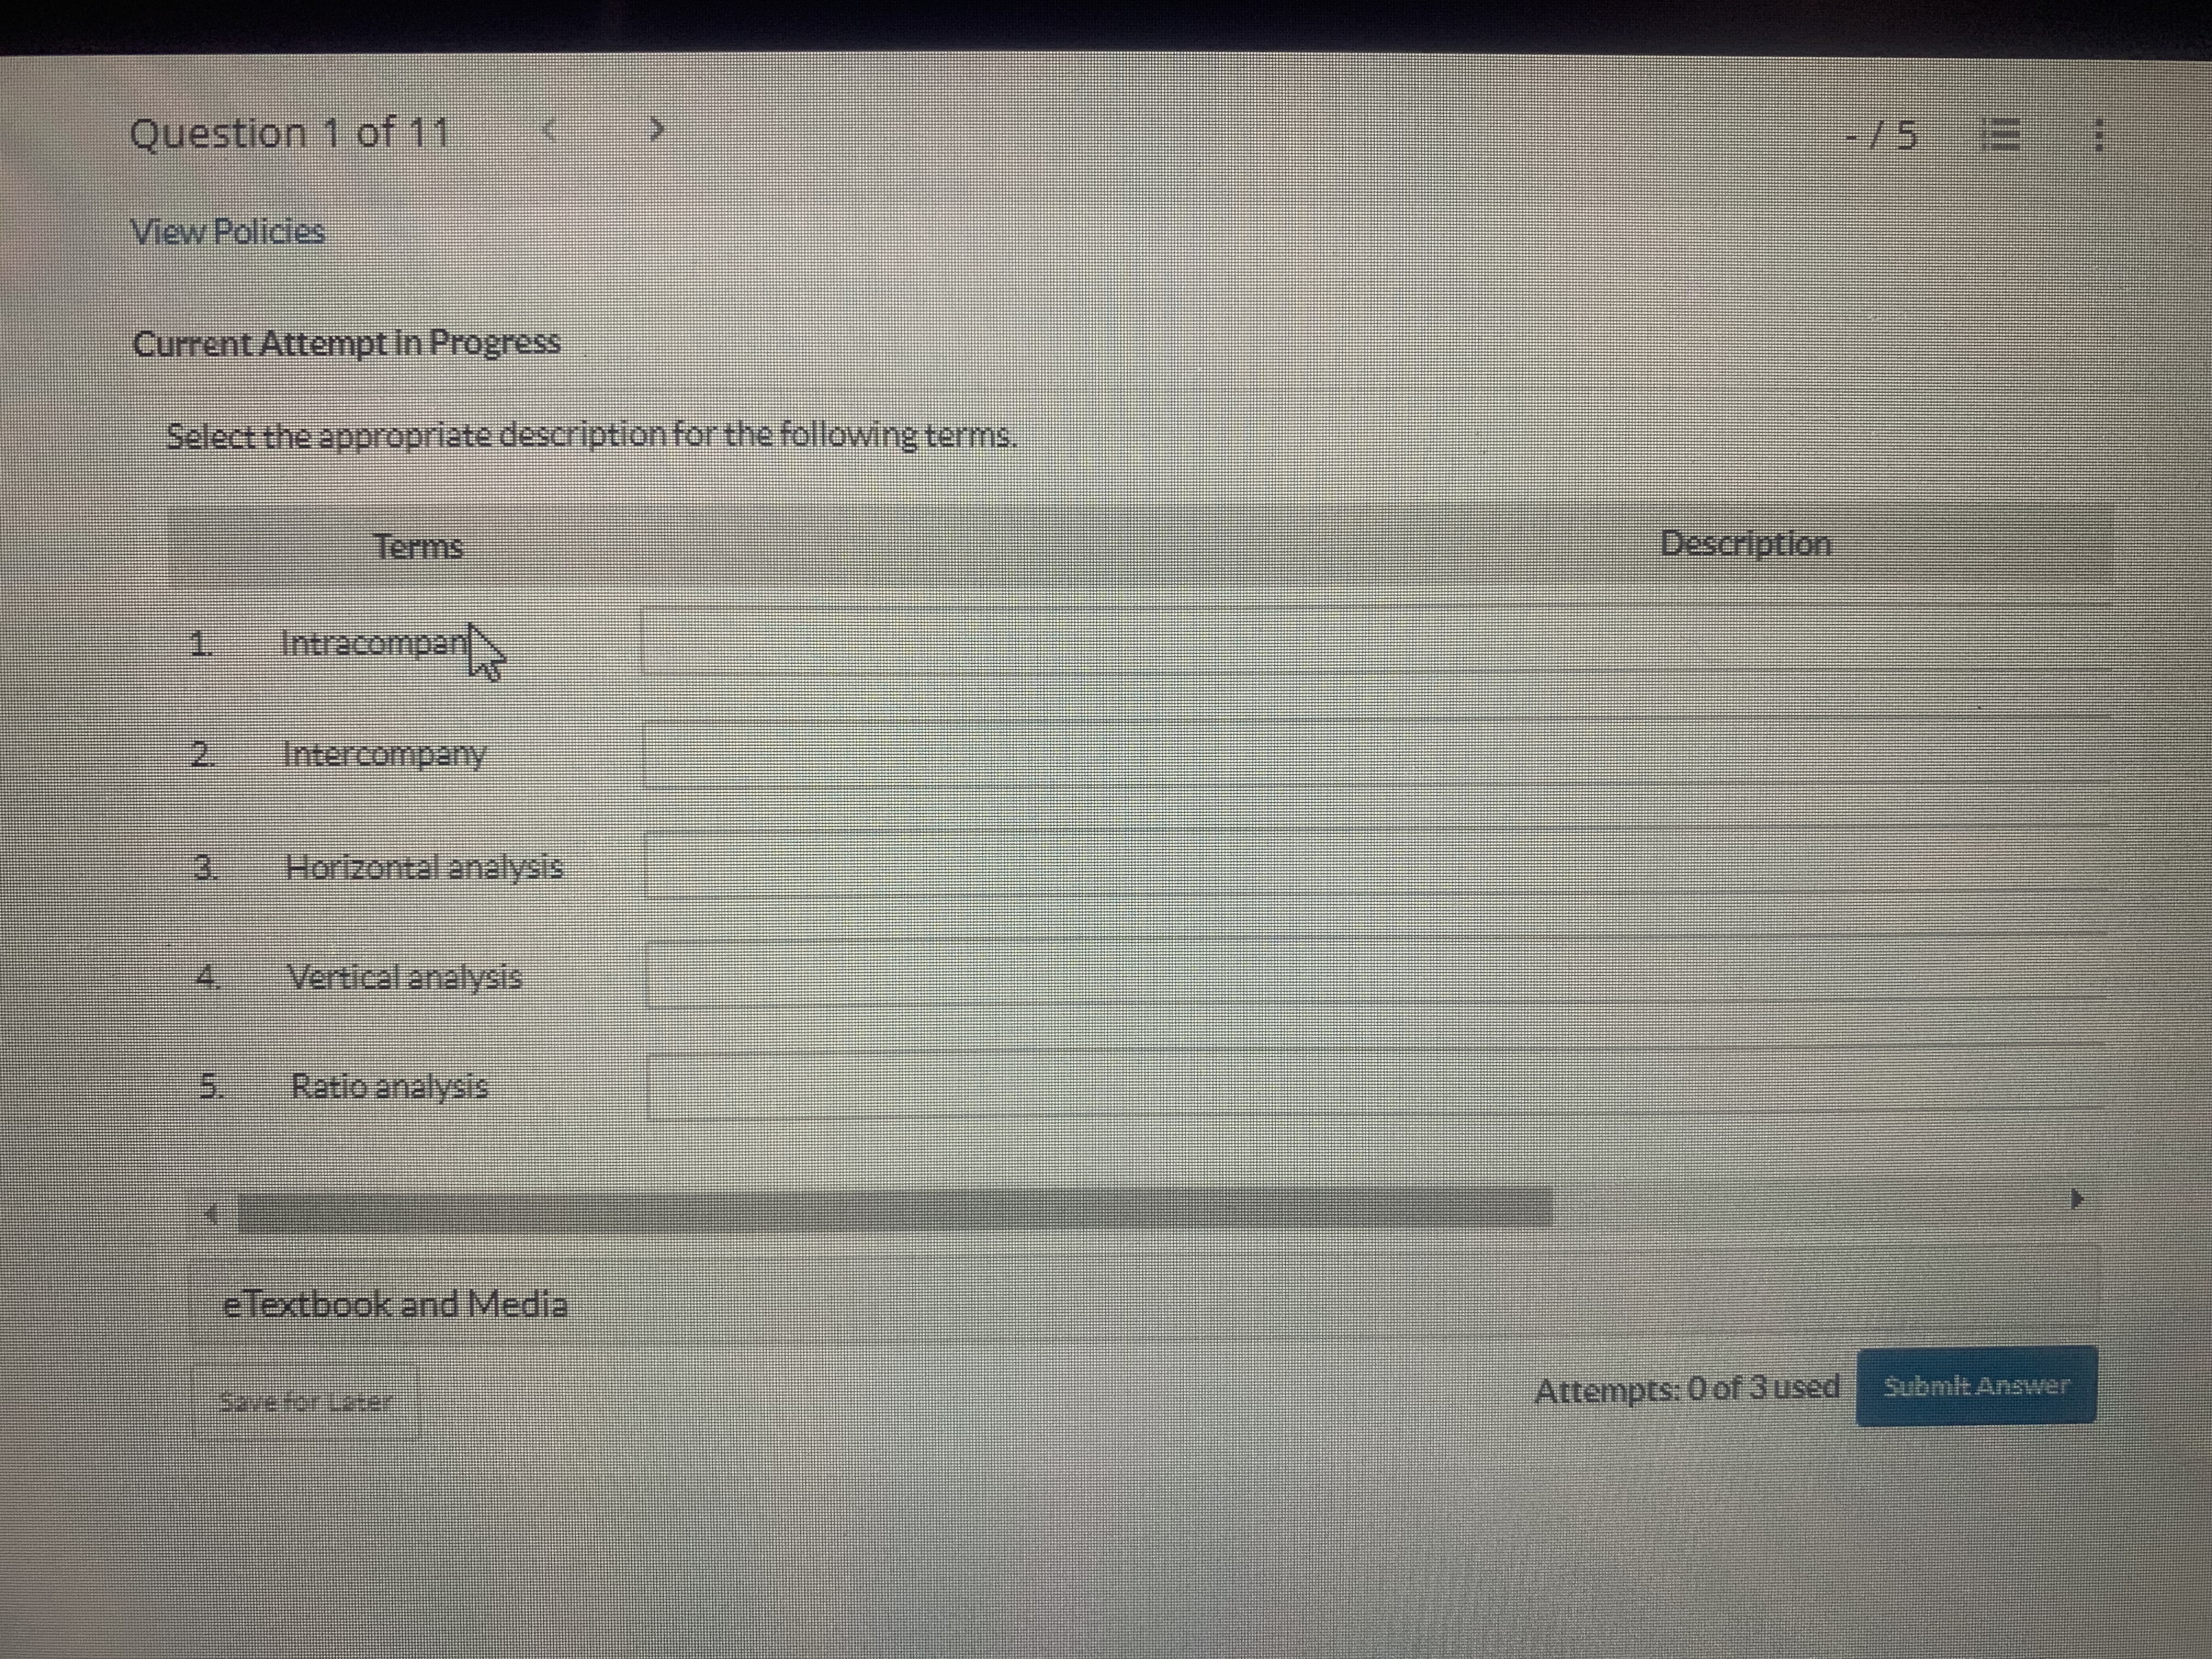
Question 1 of 11 View Policies Current Attempt in Progress Select the appropriate description for the...
Fantastic news! We've Found the answer you've been seeking!
Question:
Transcribed Image Text:
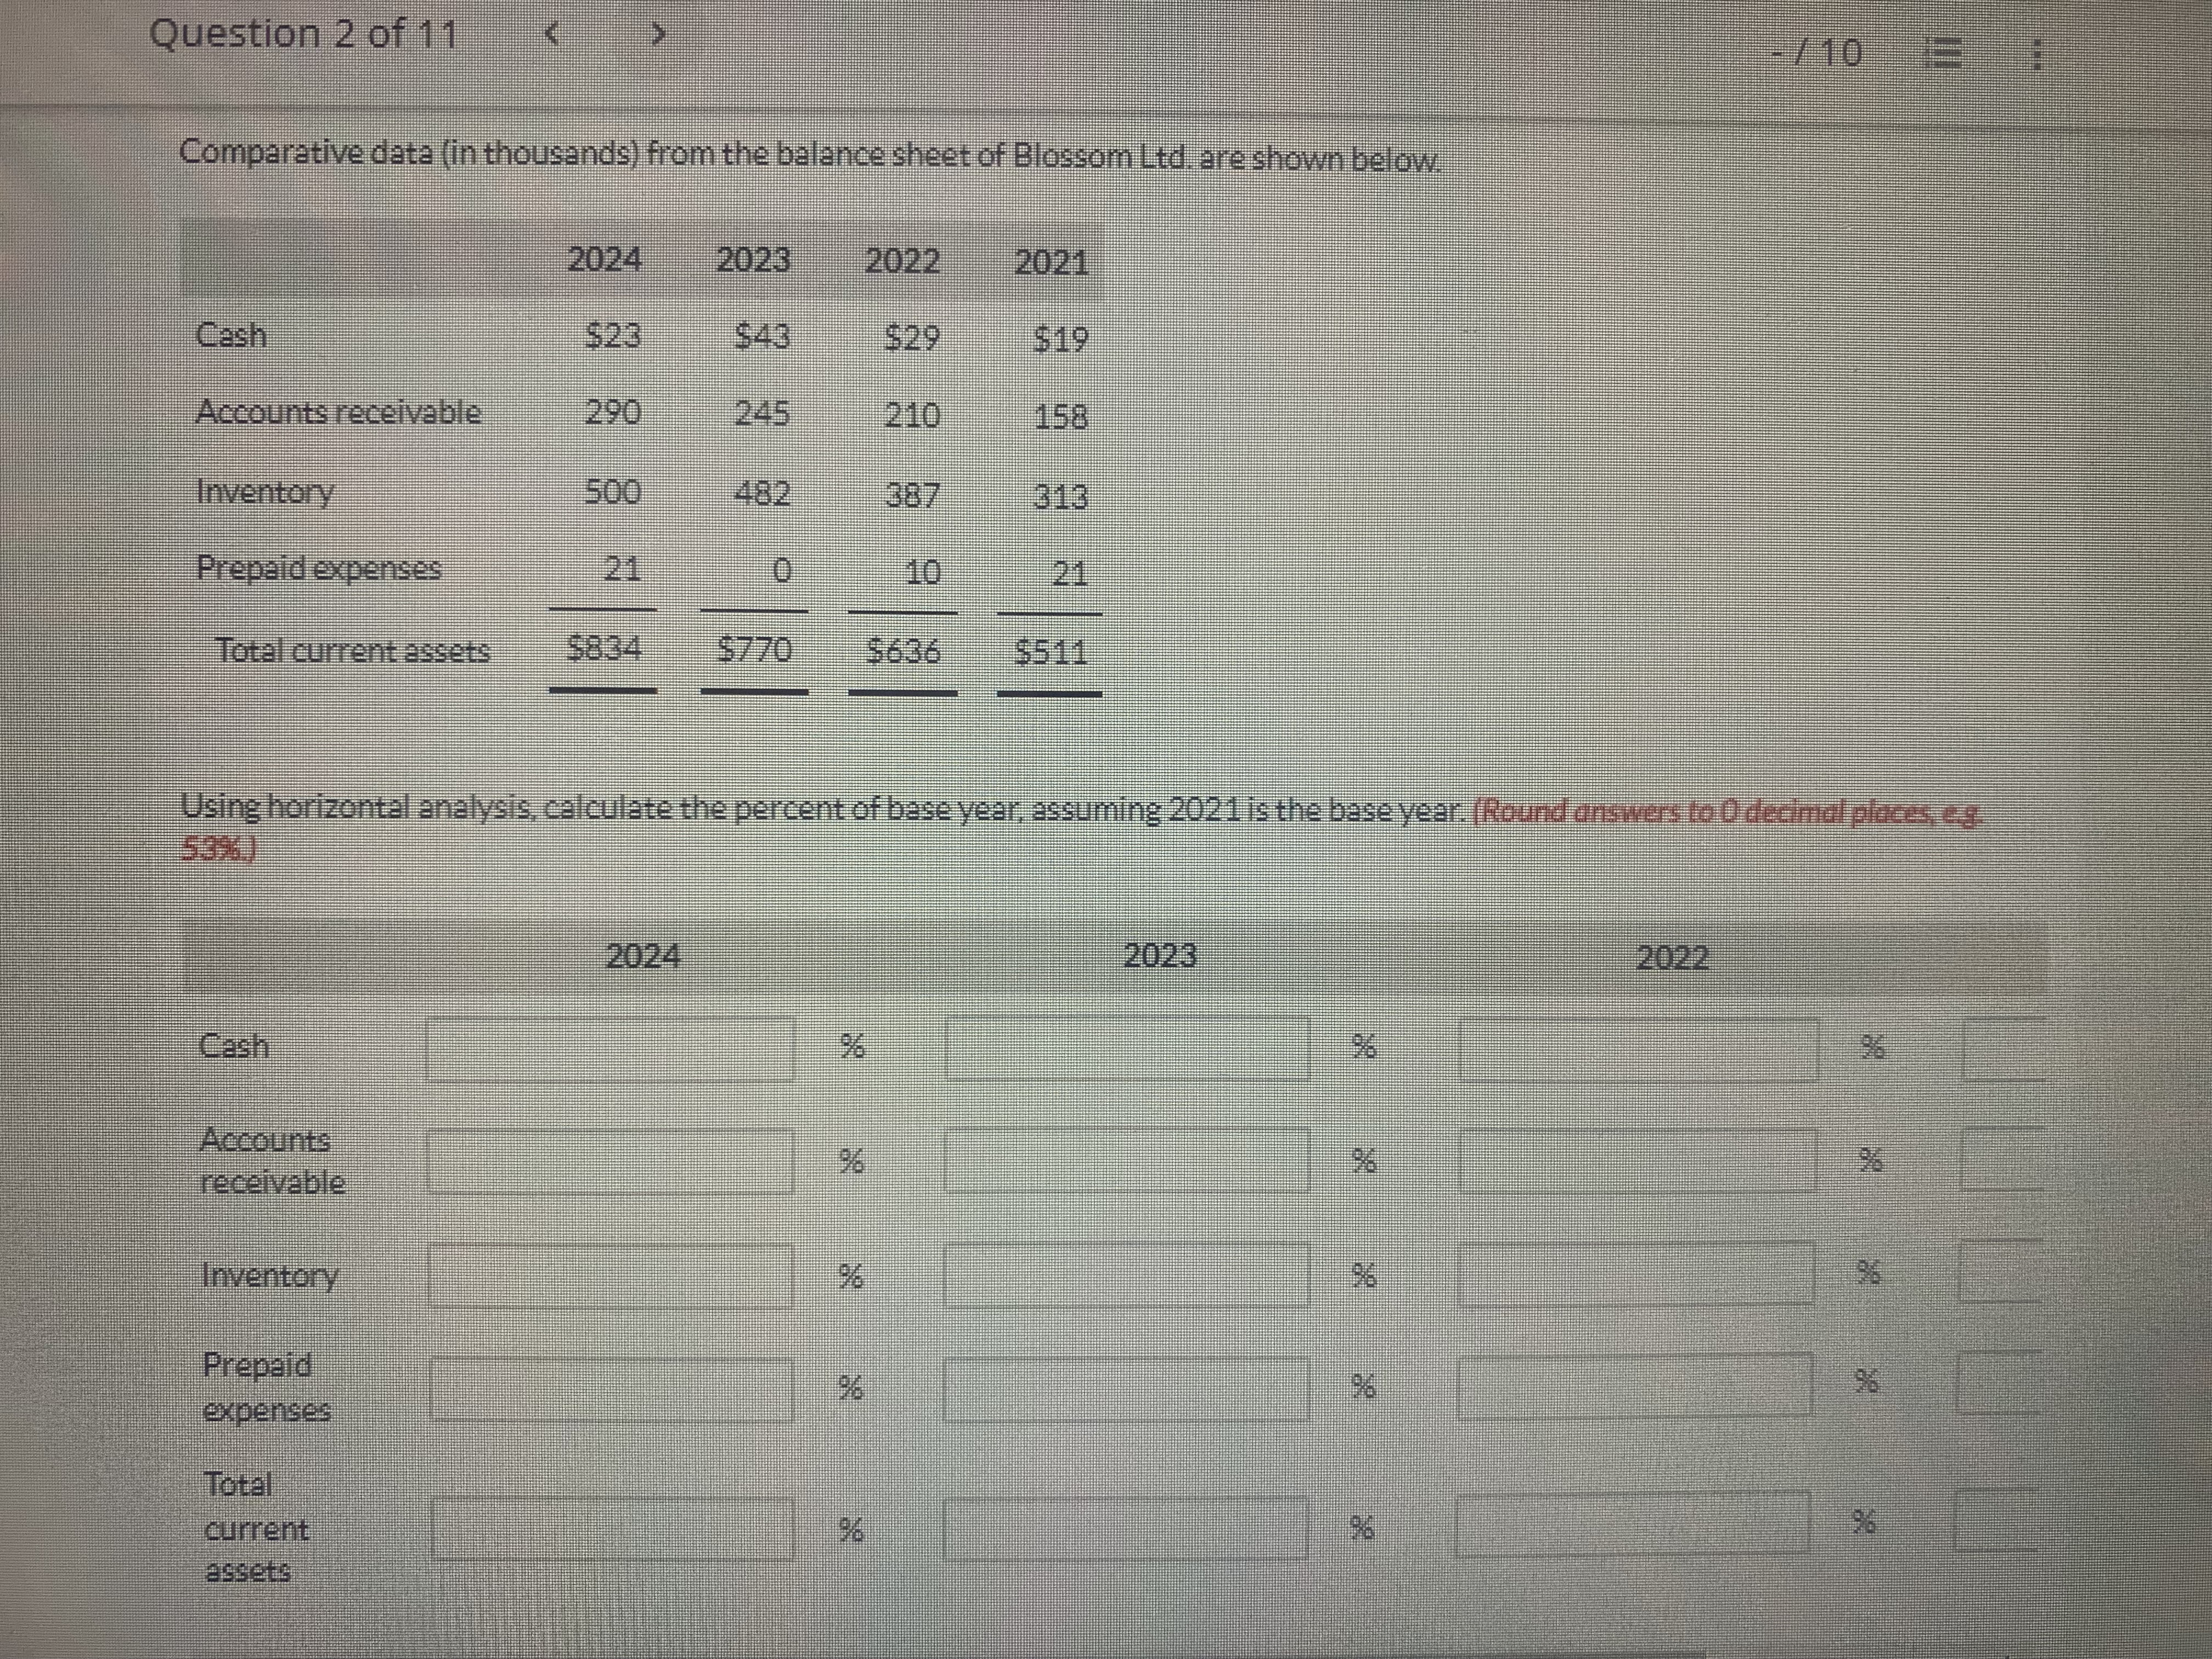
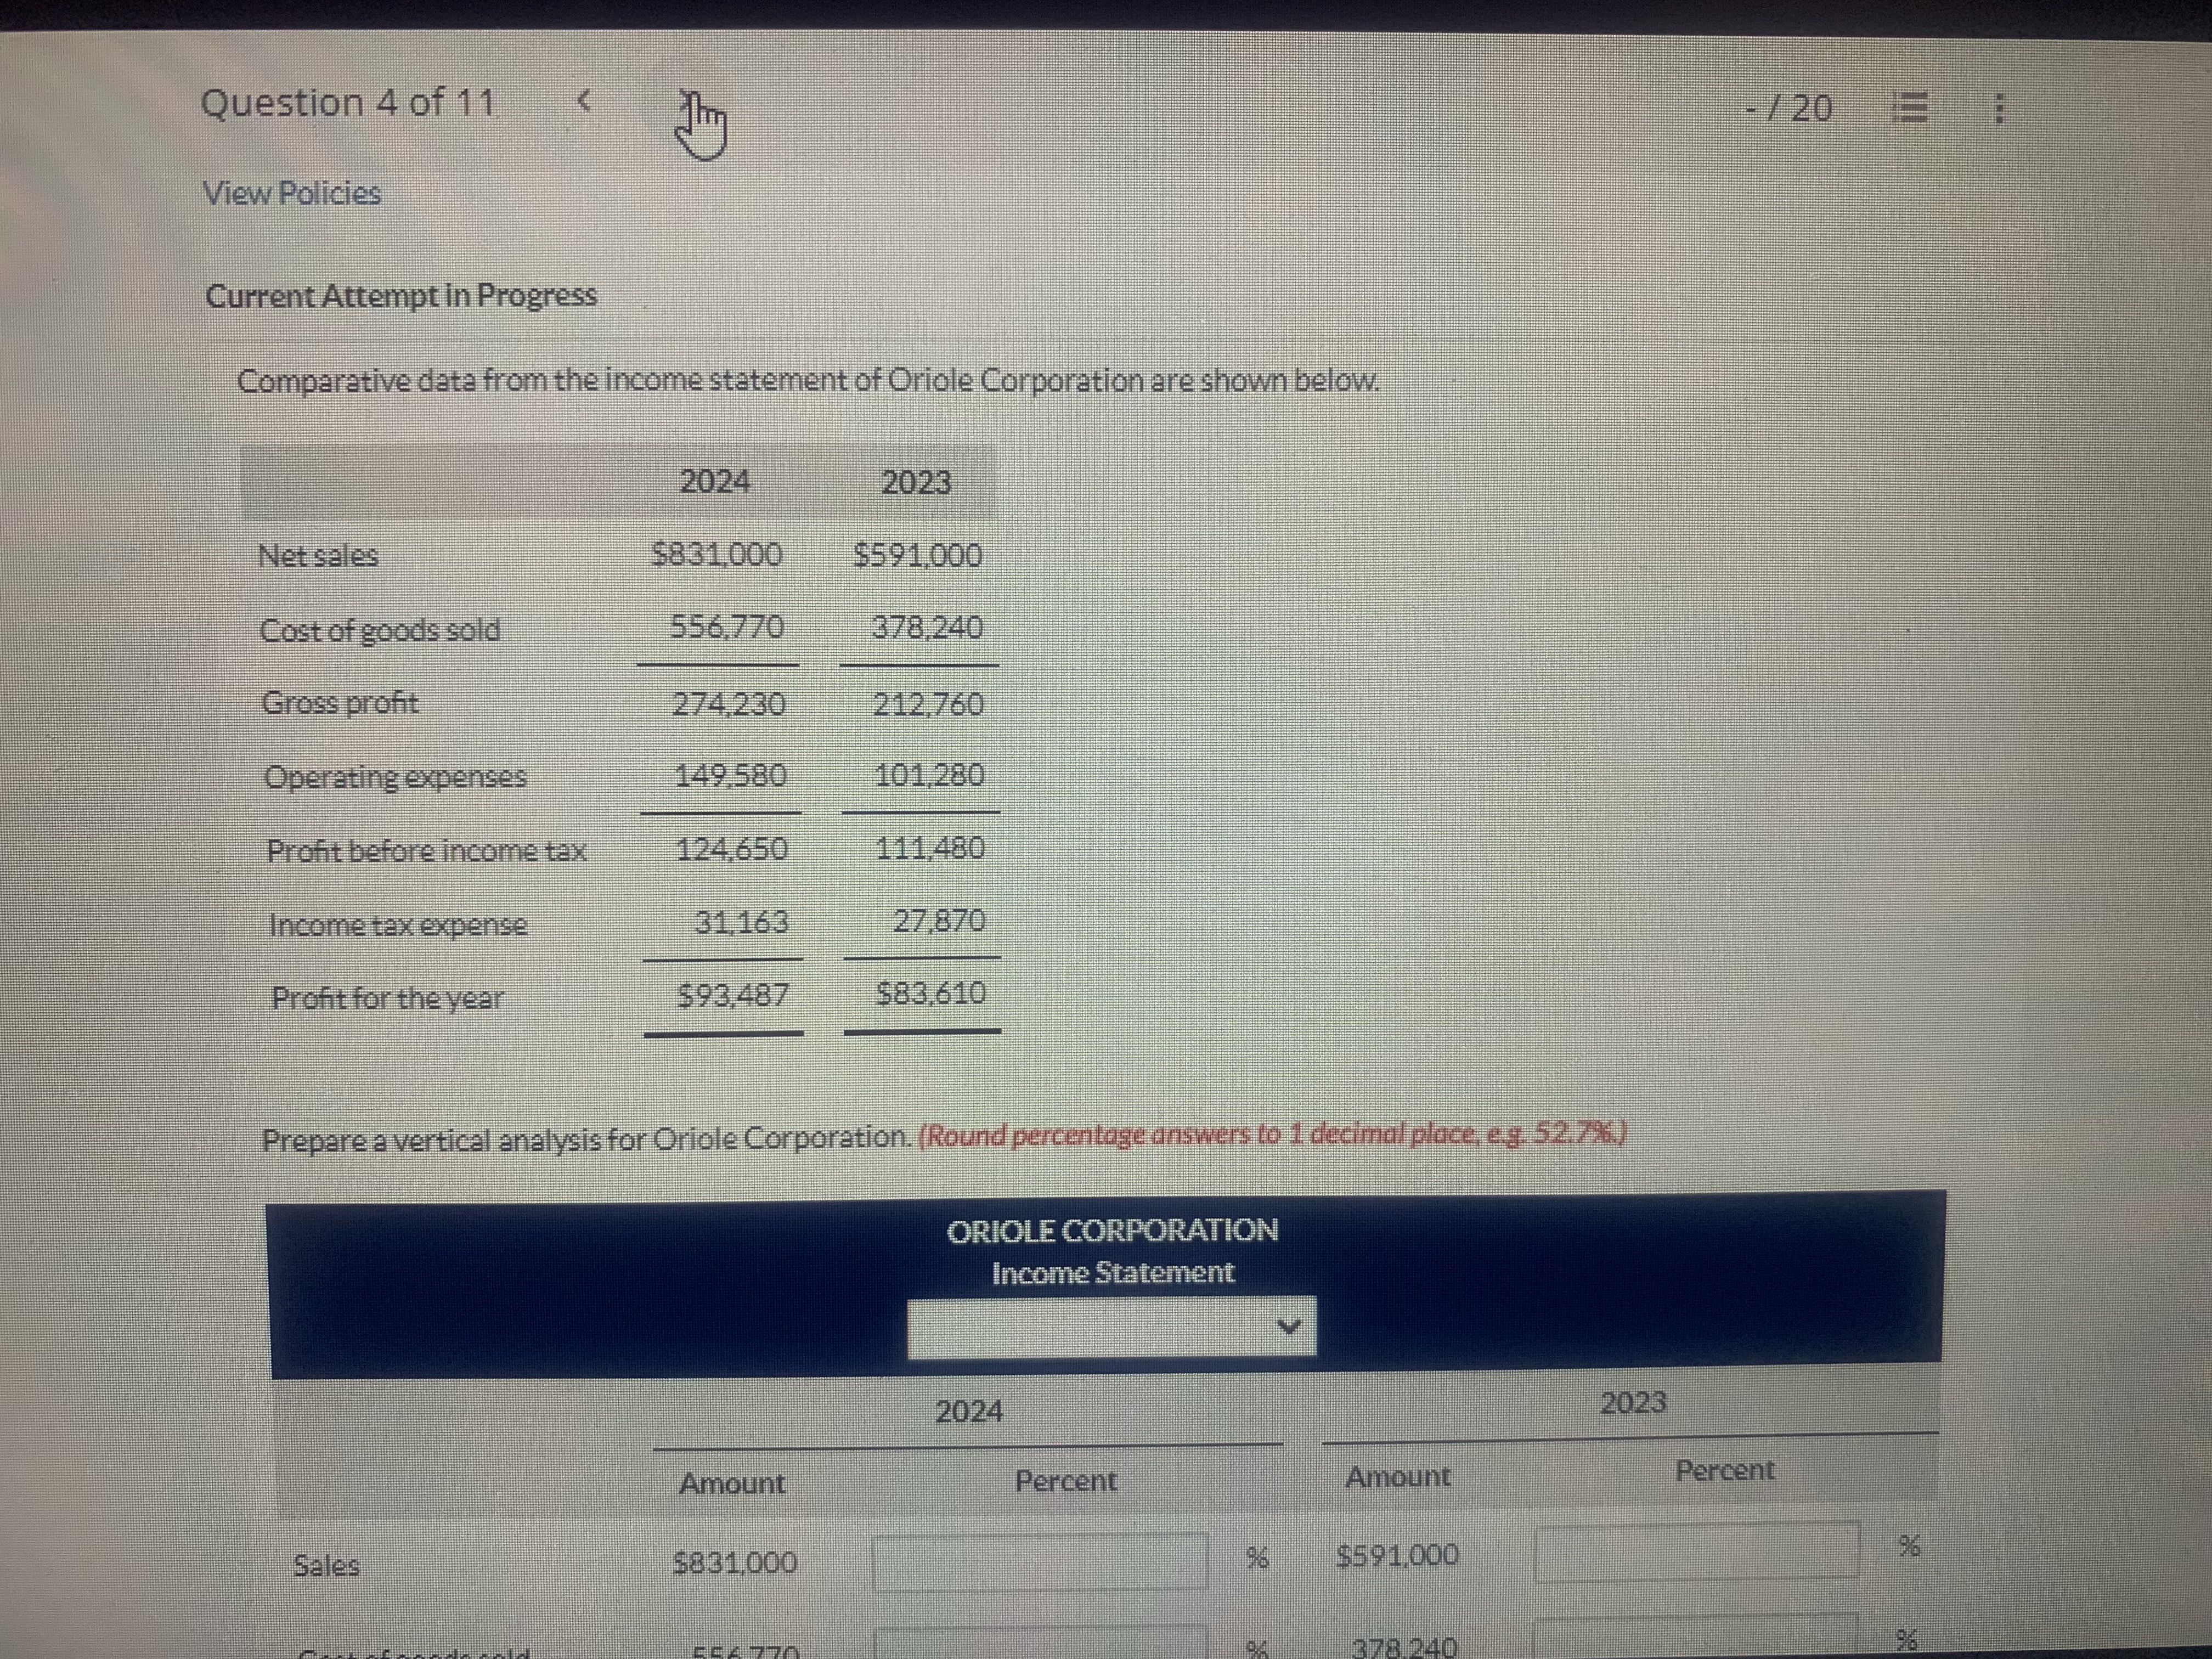
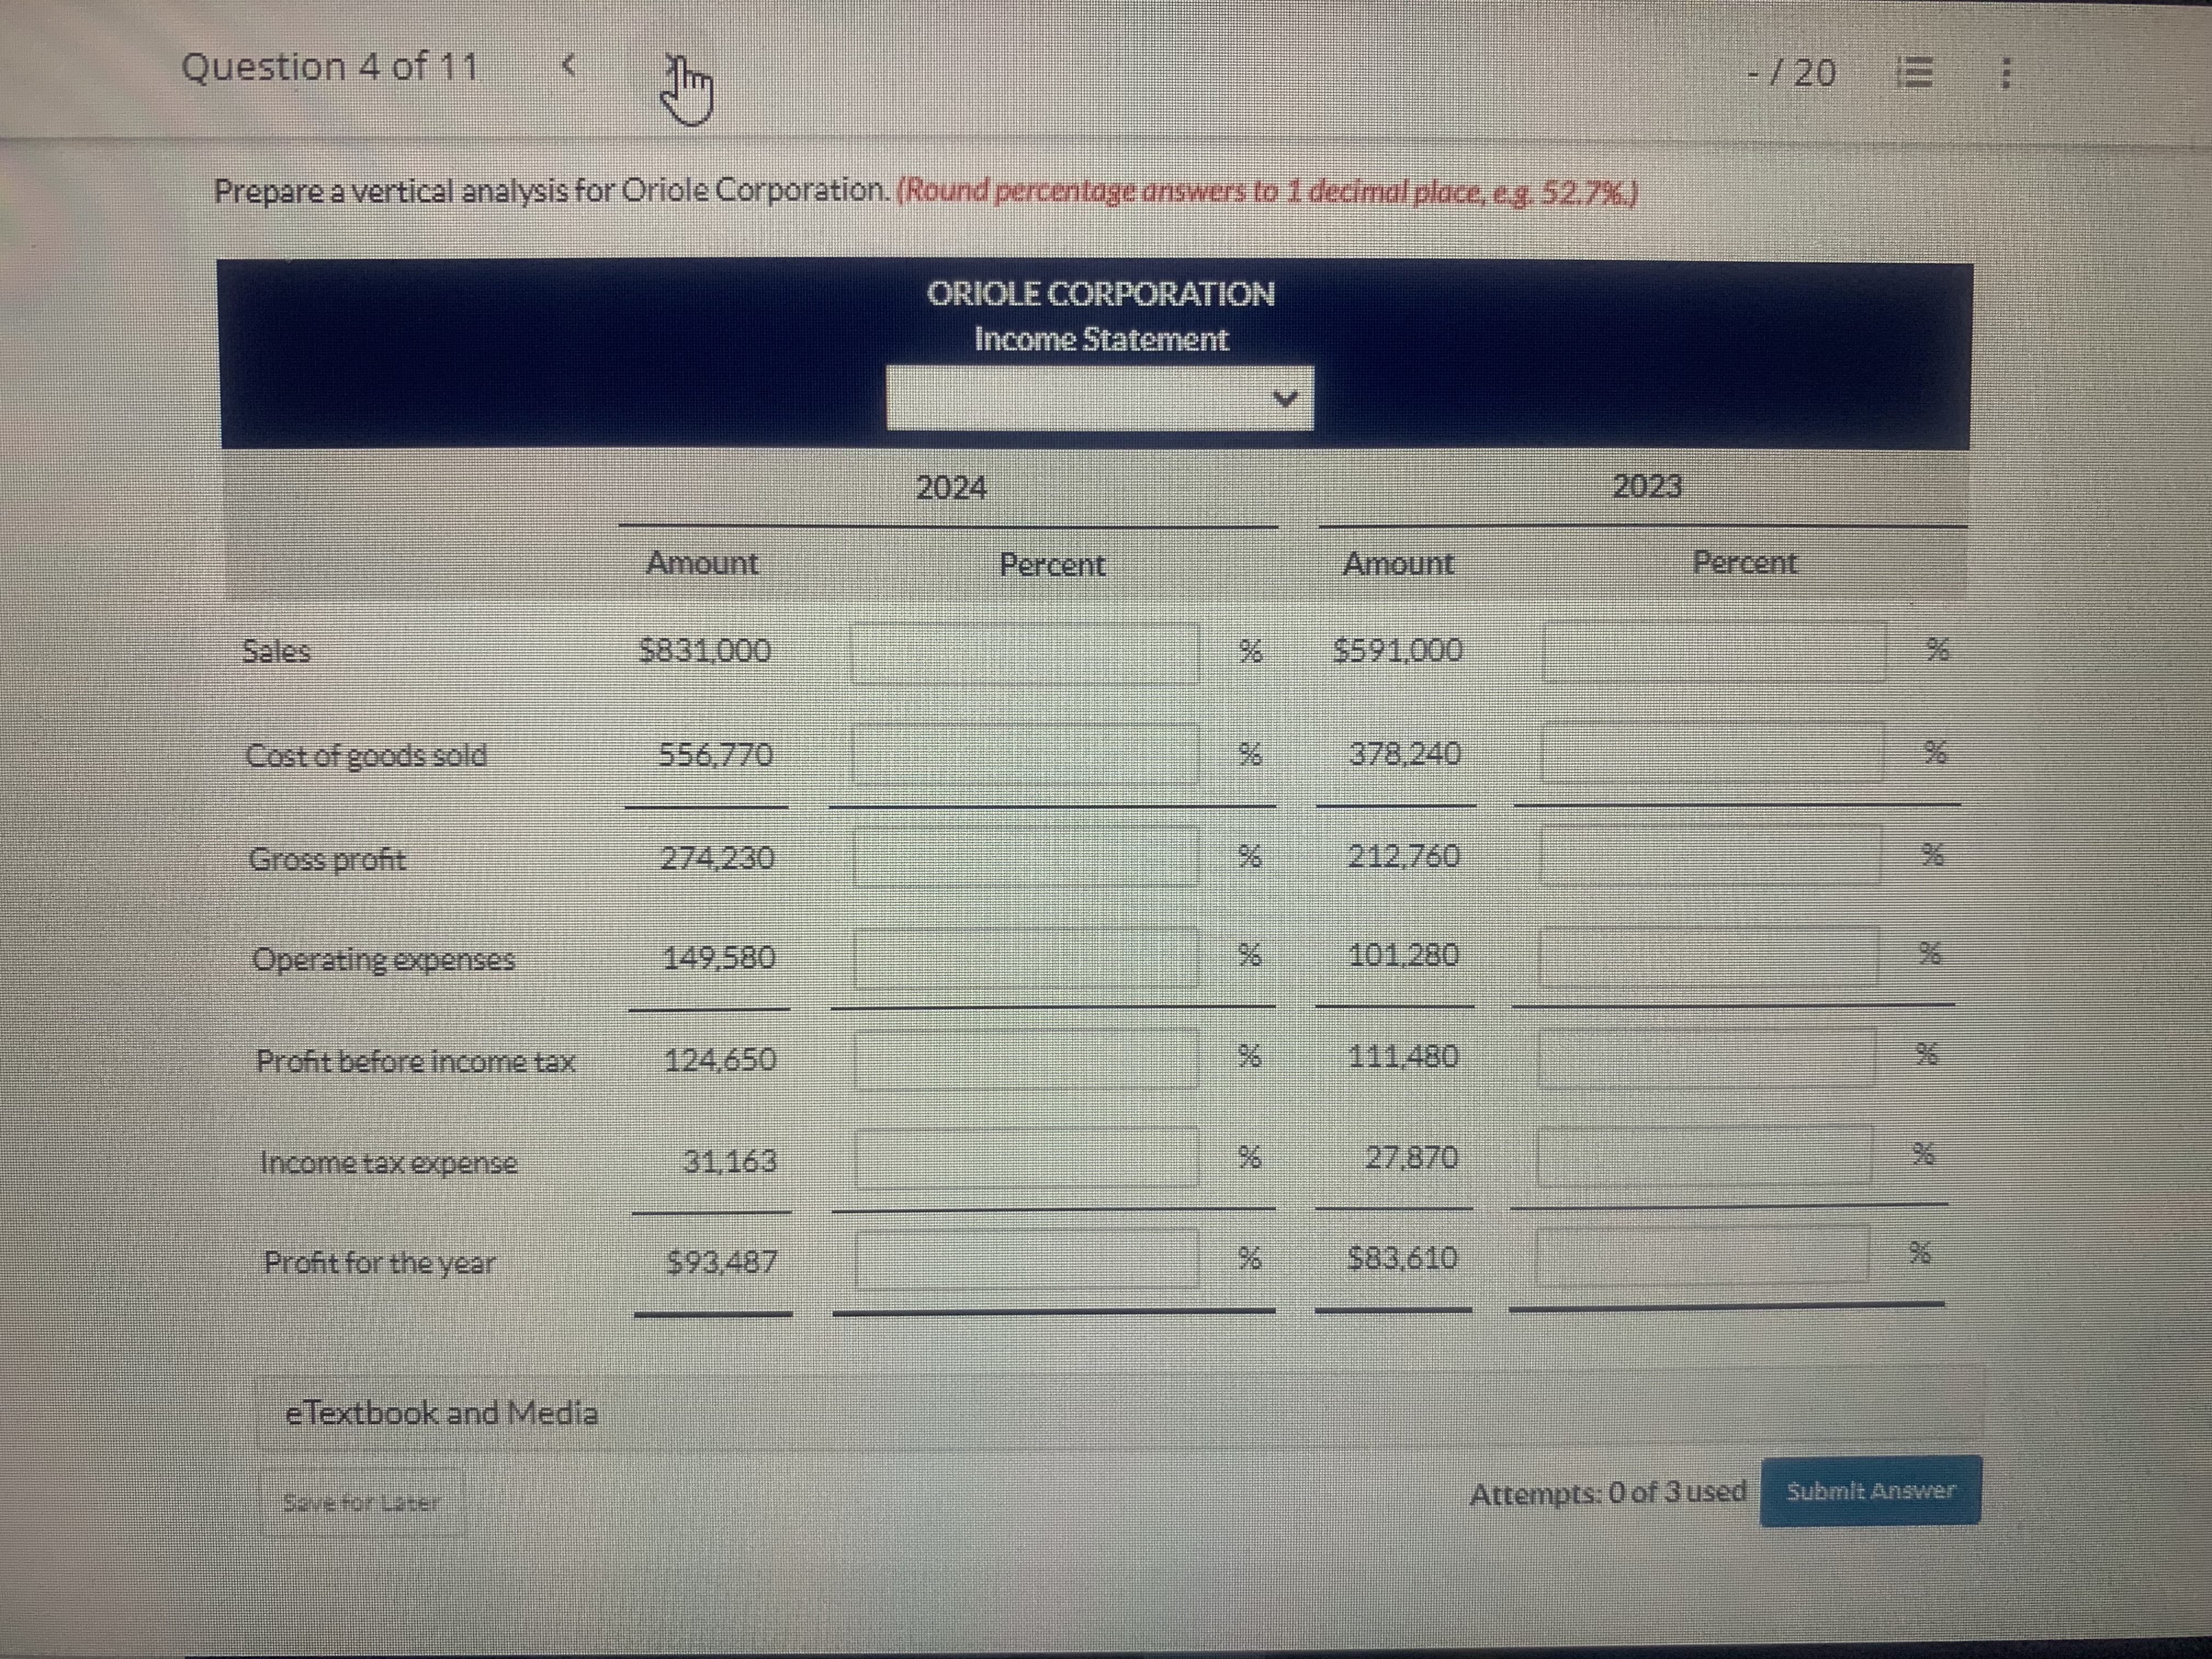
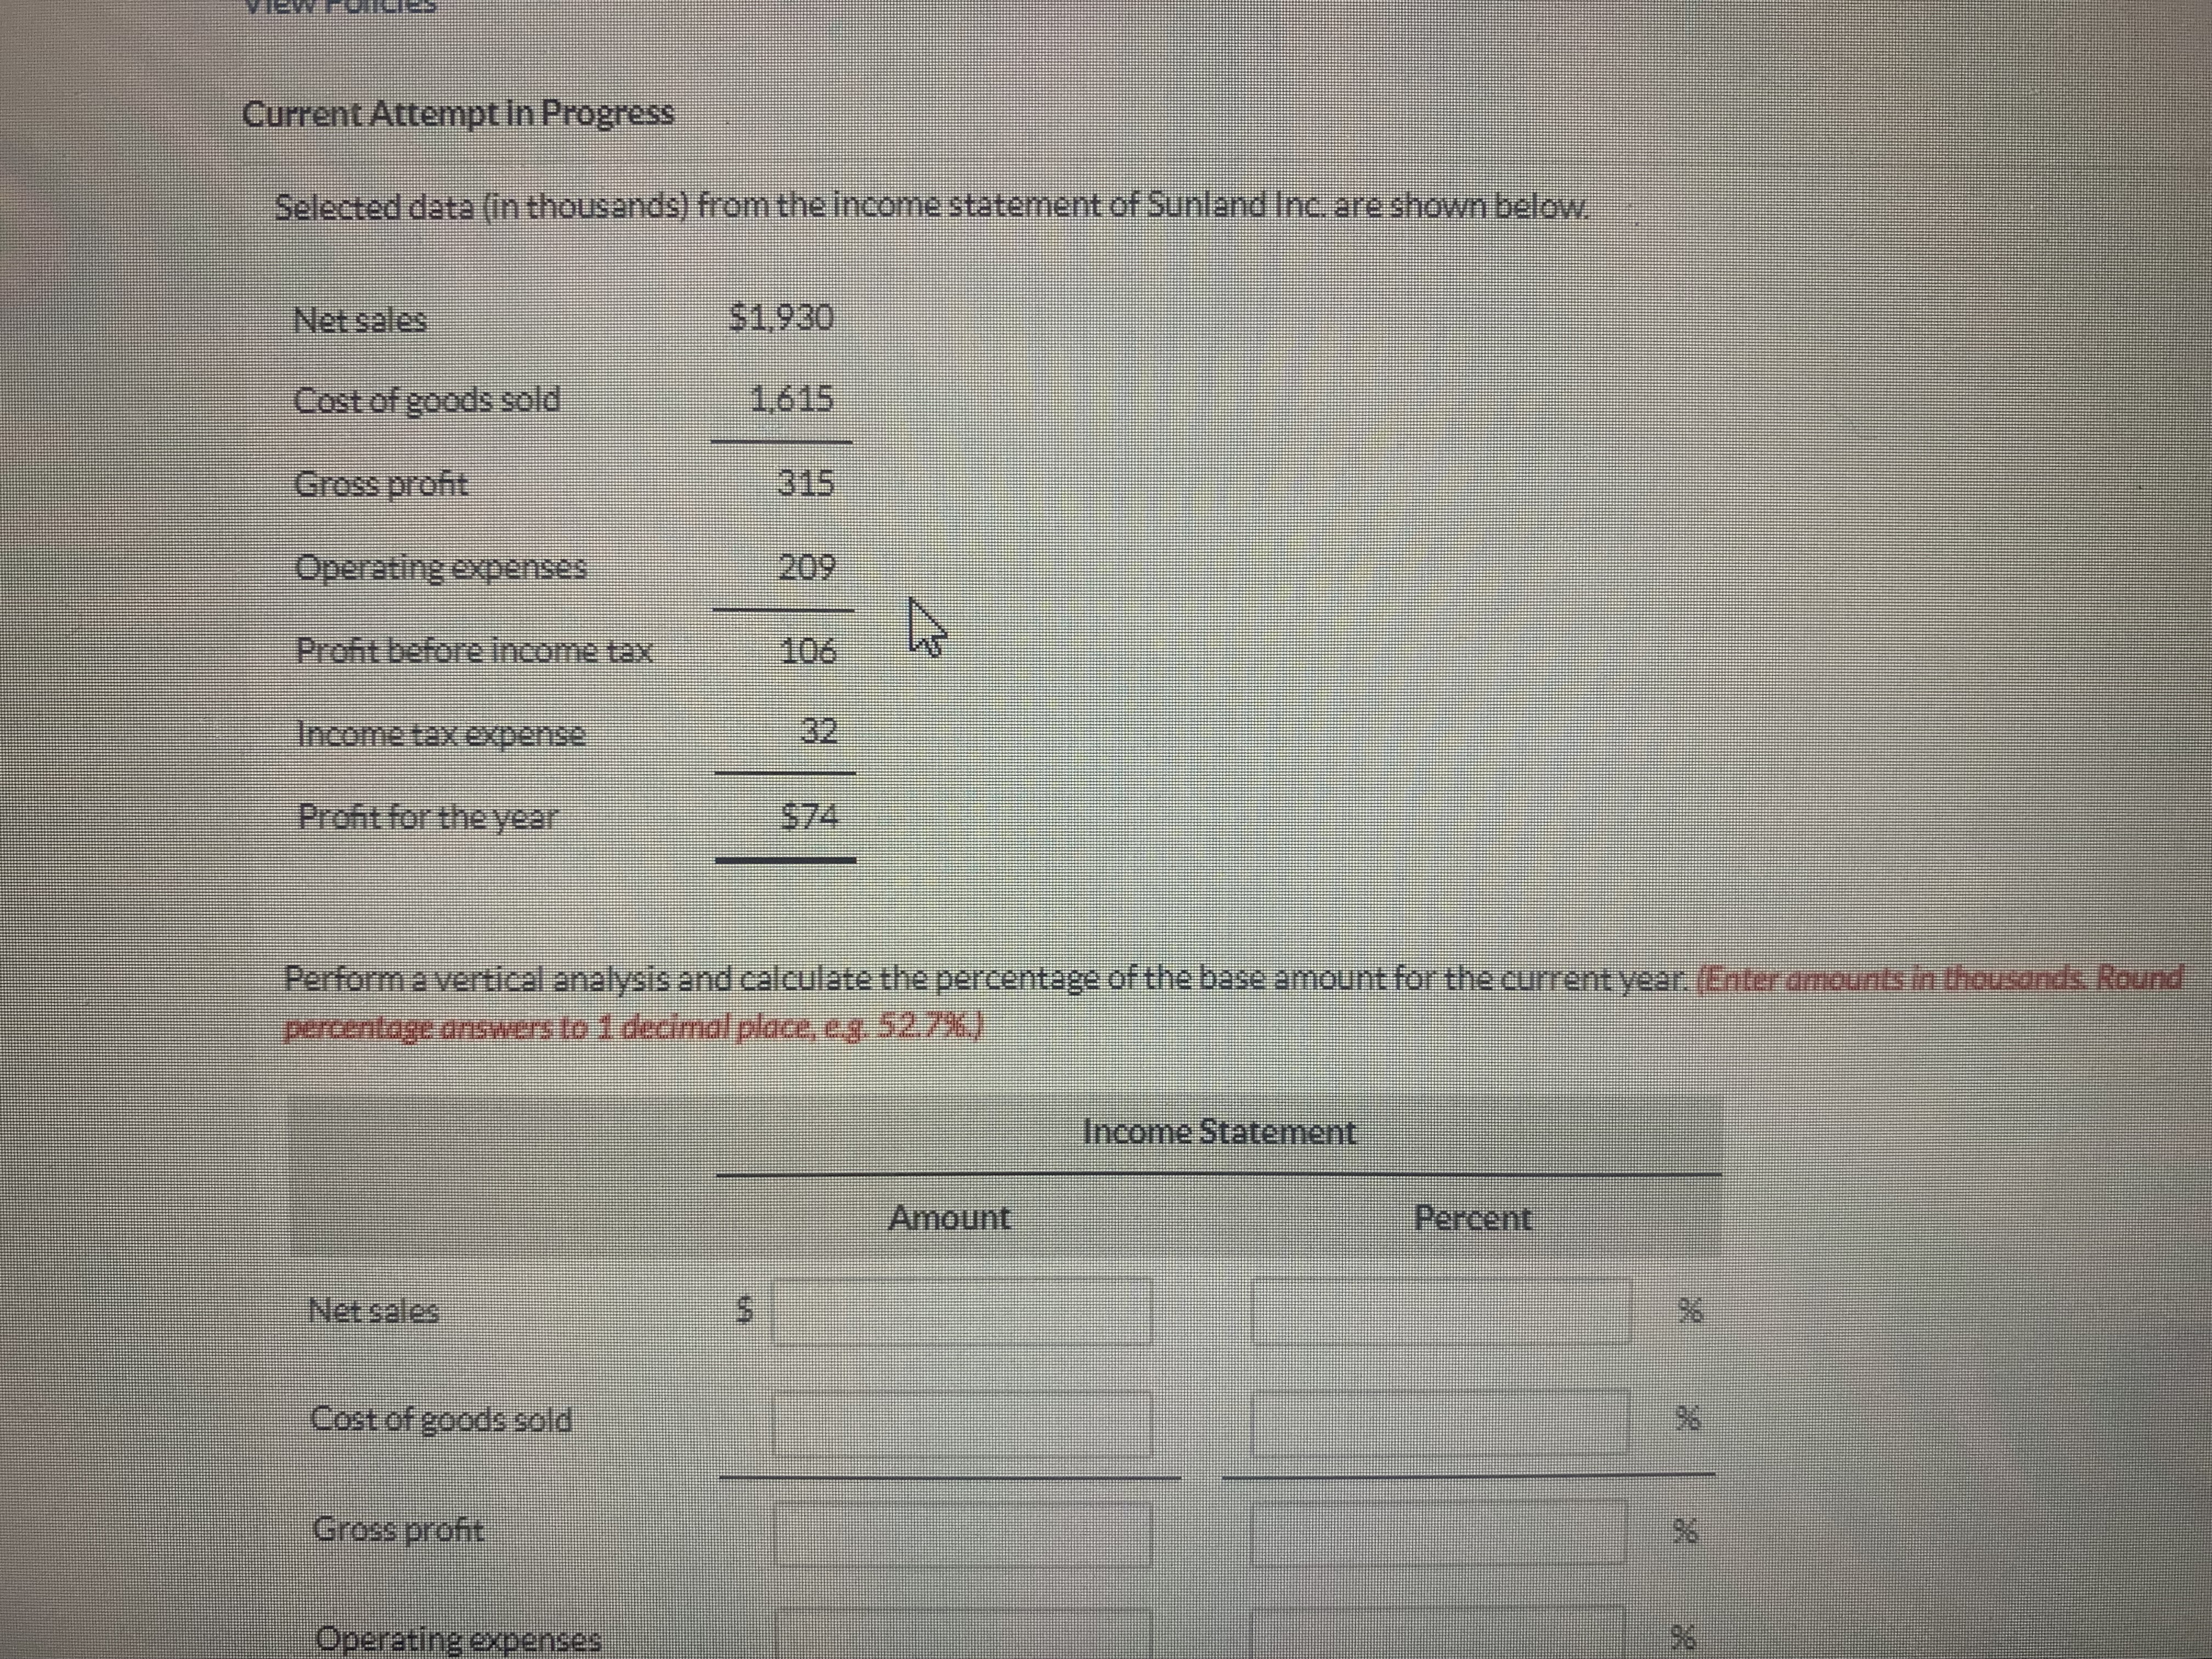
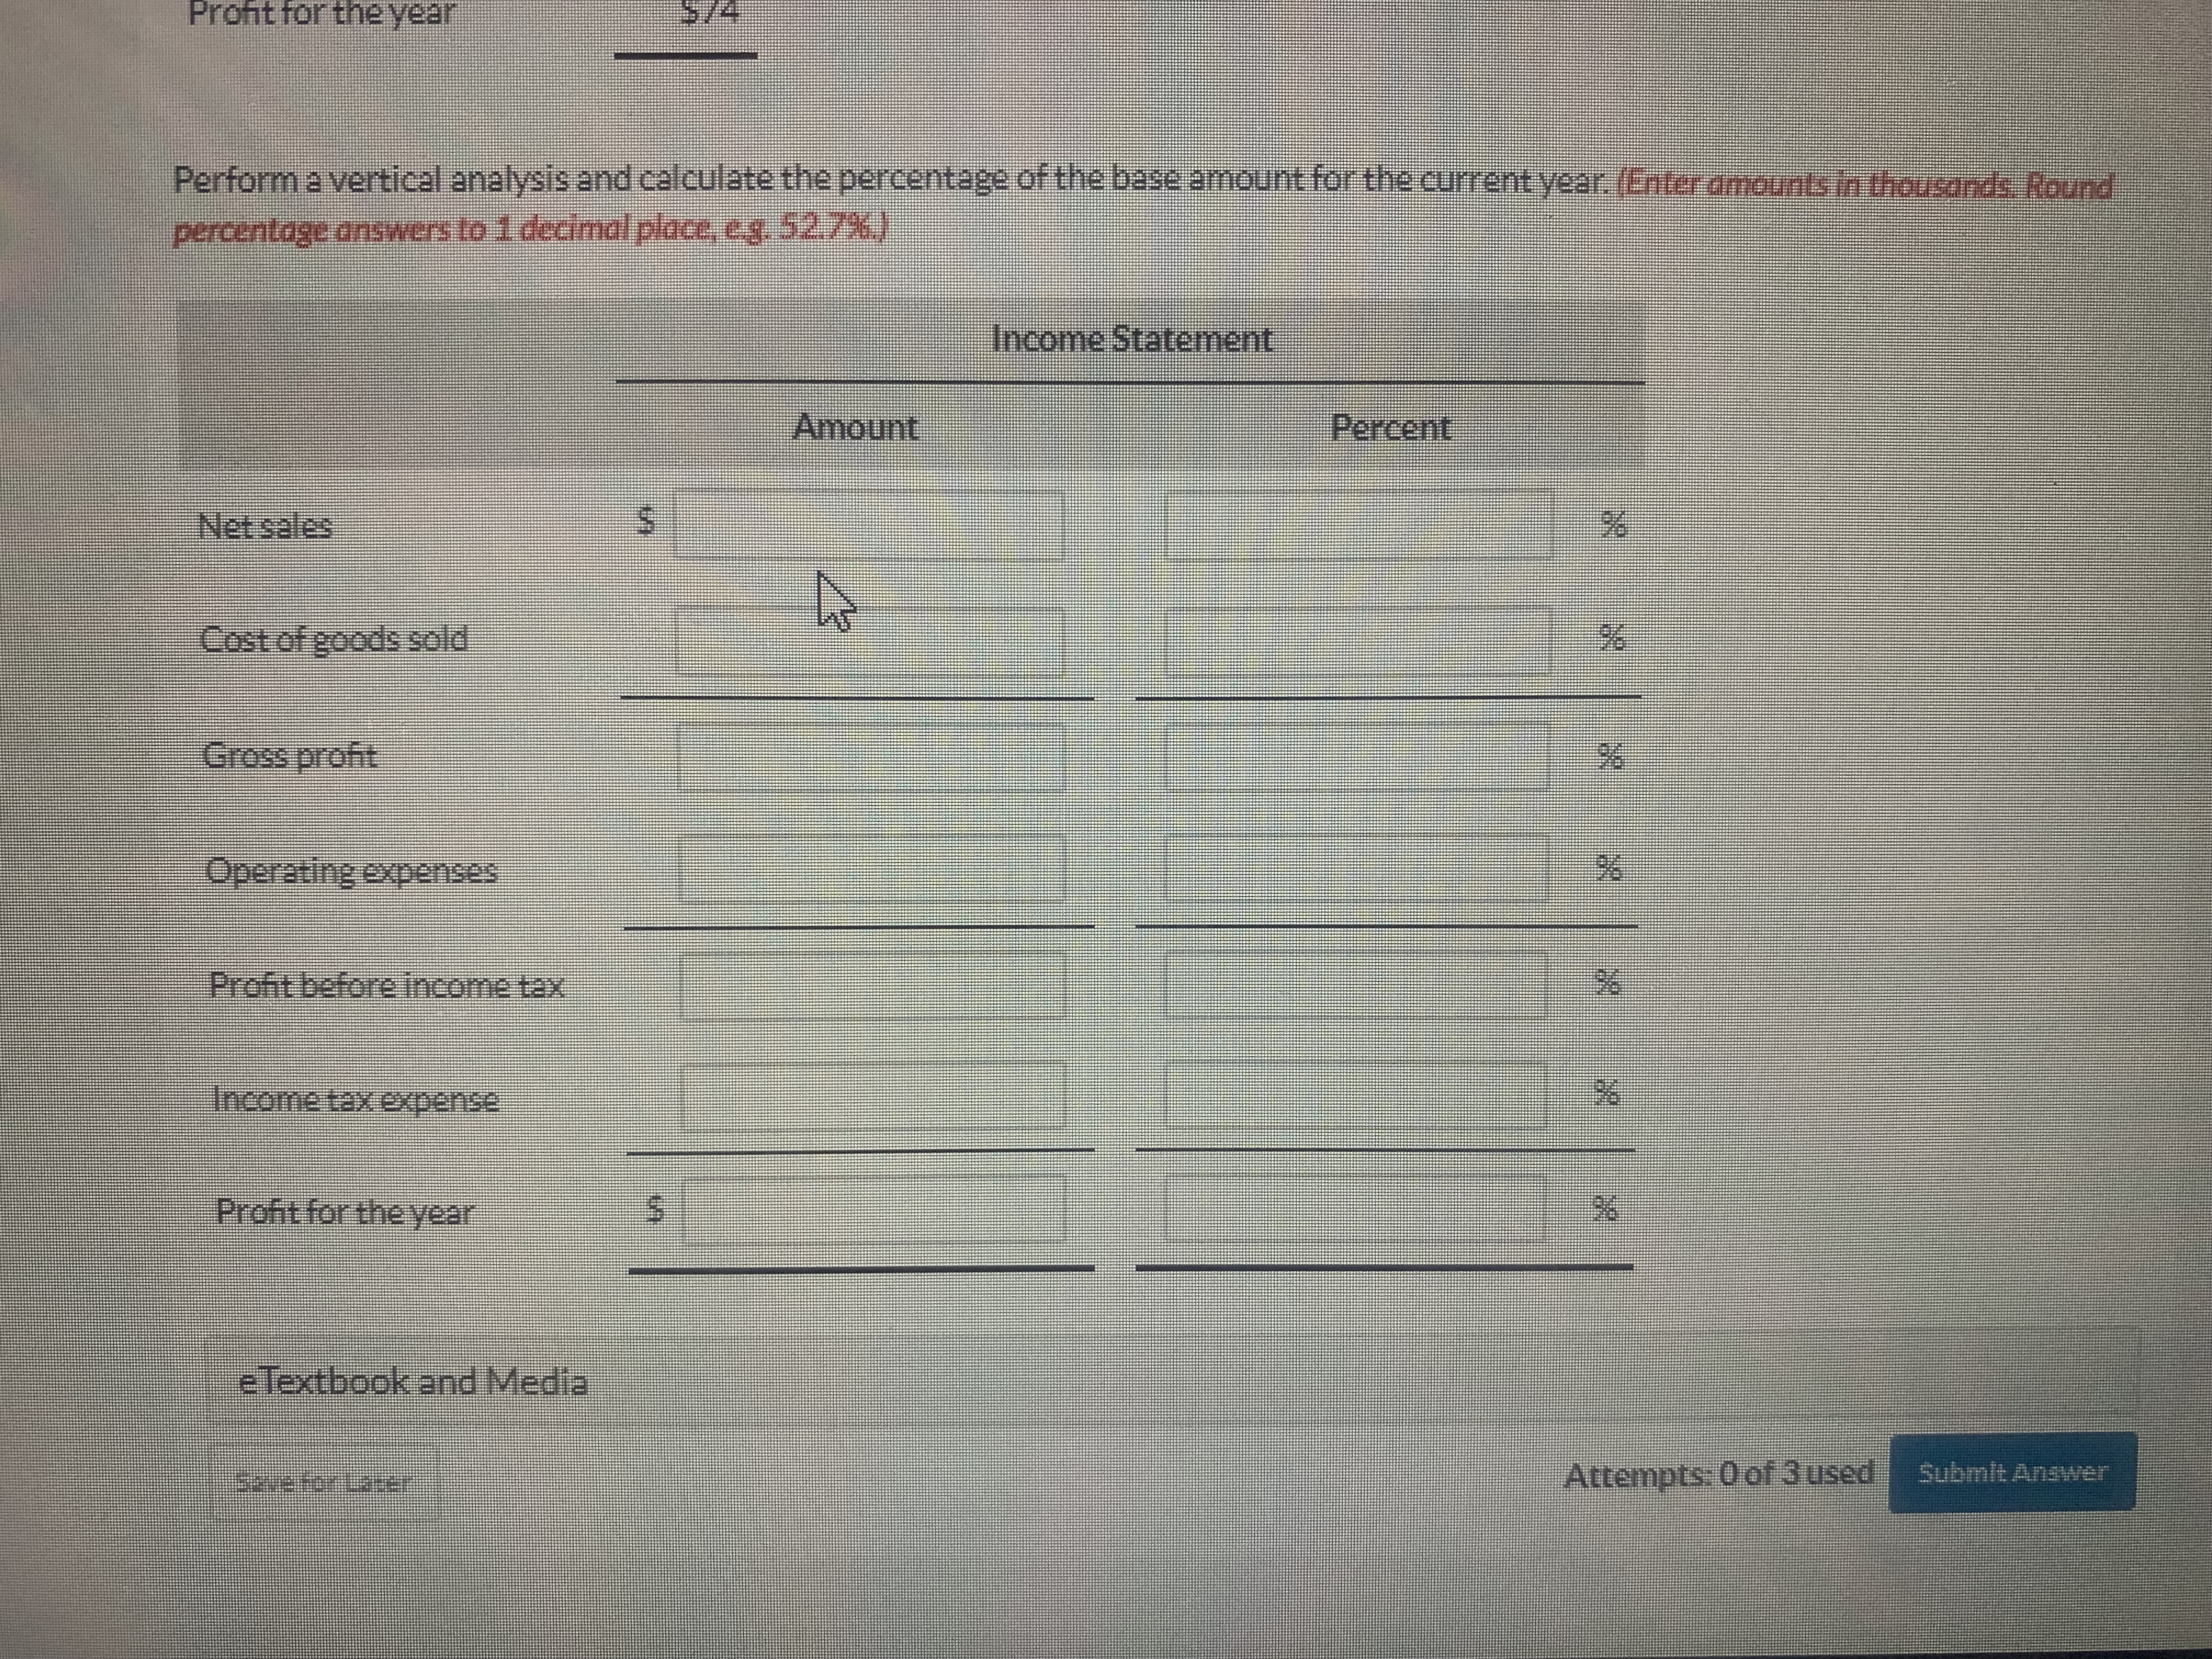
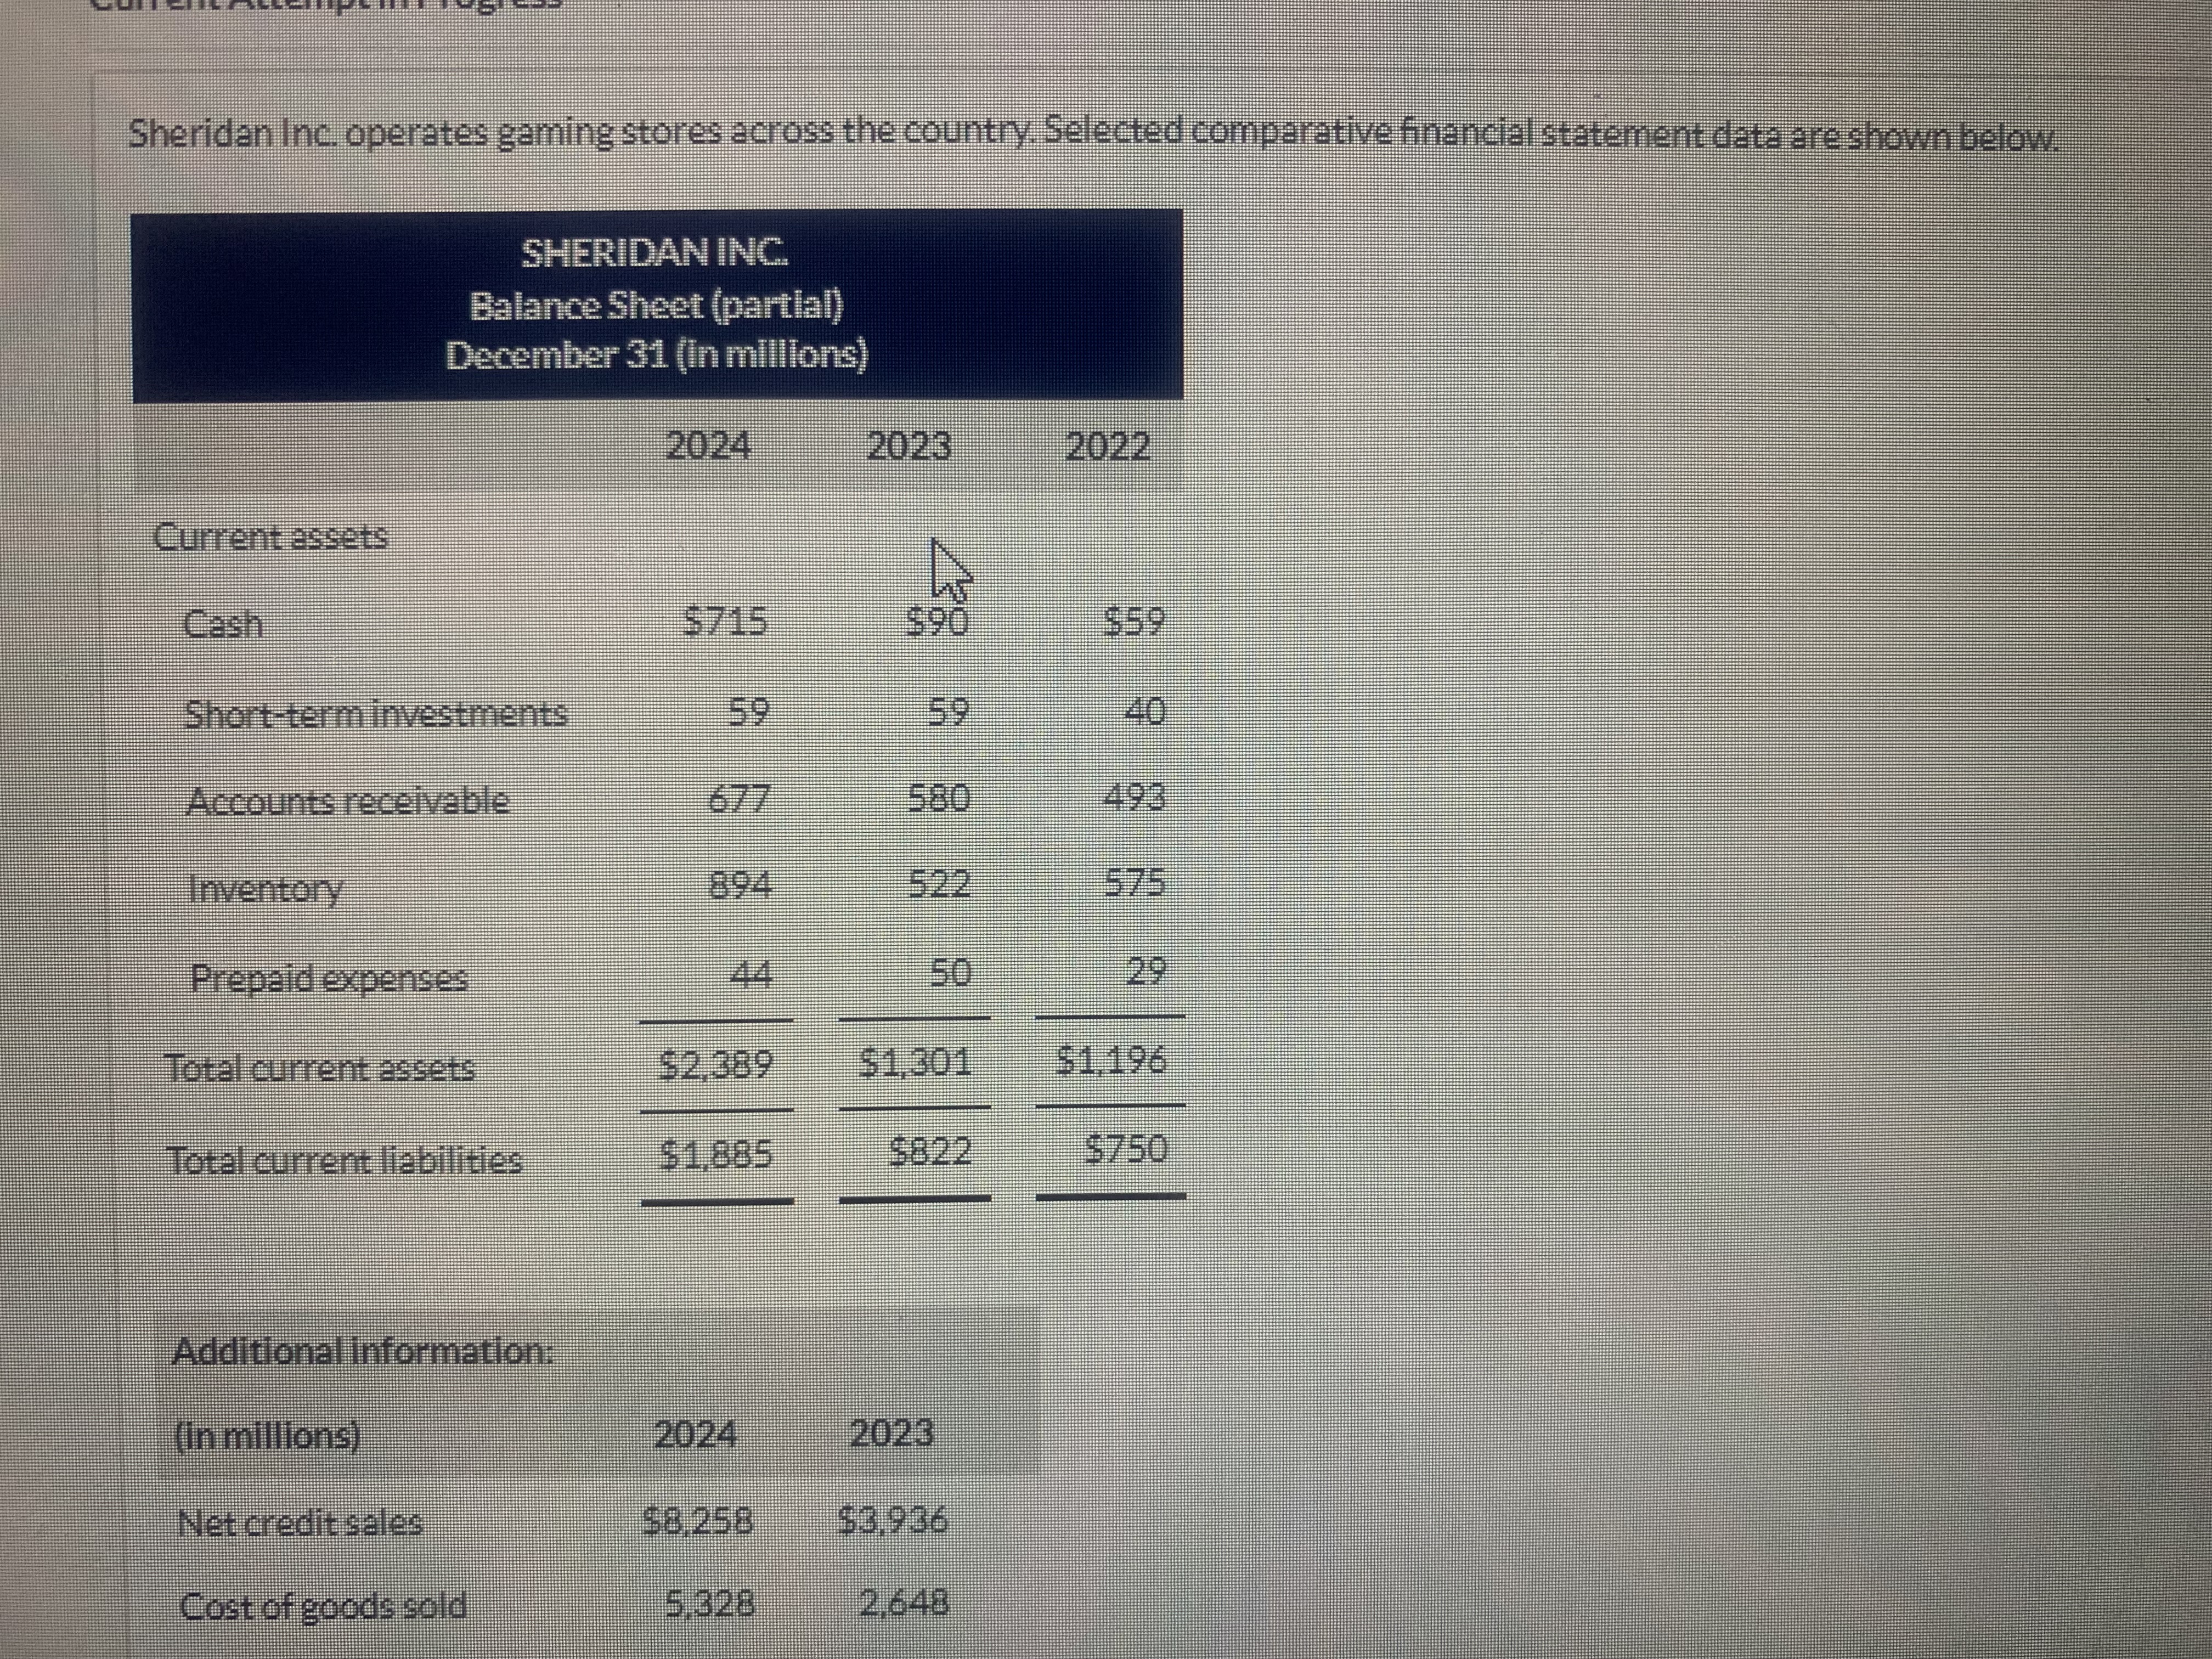
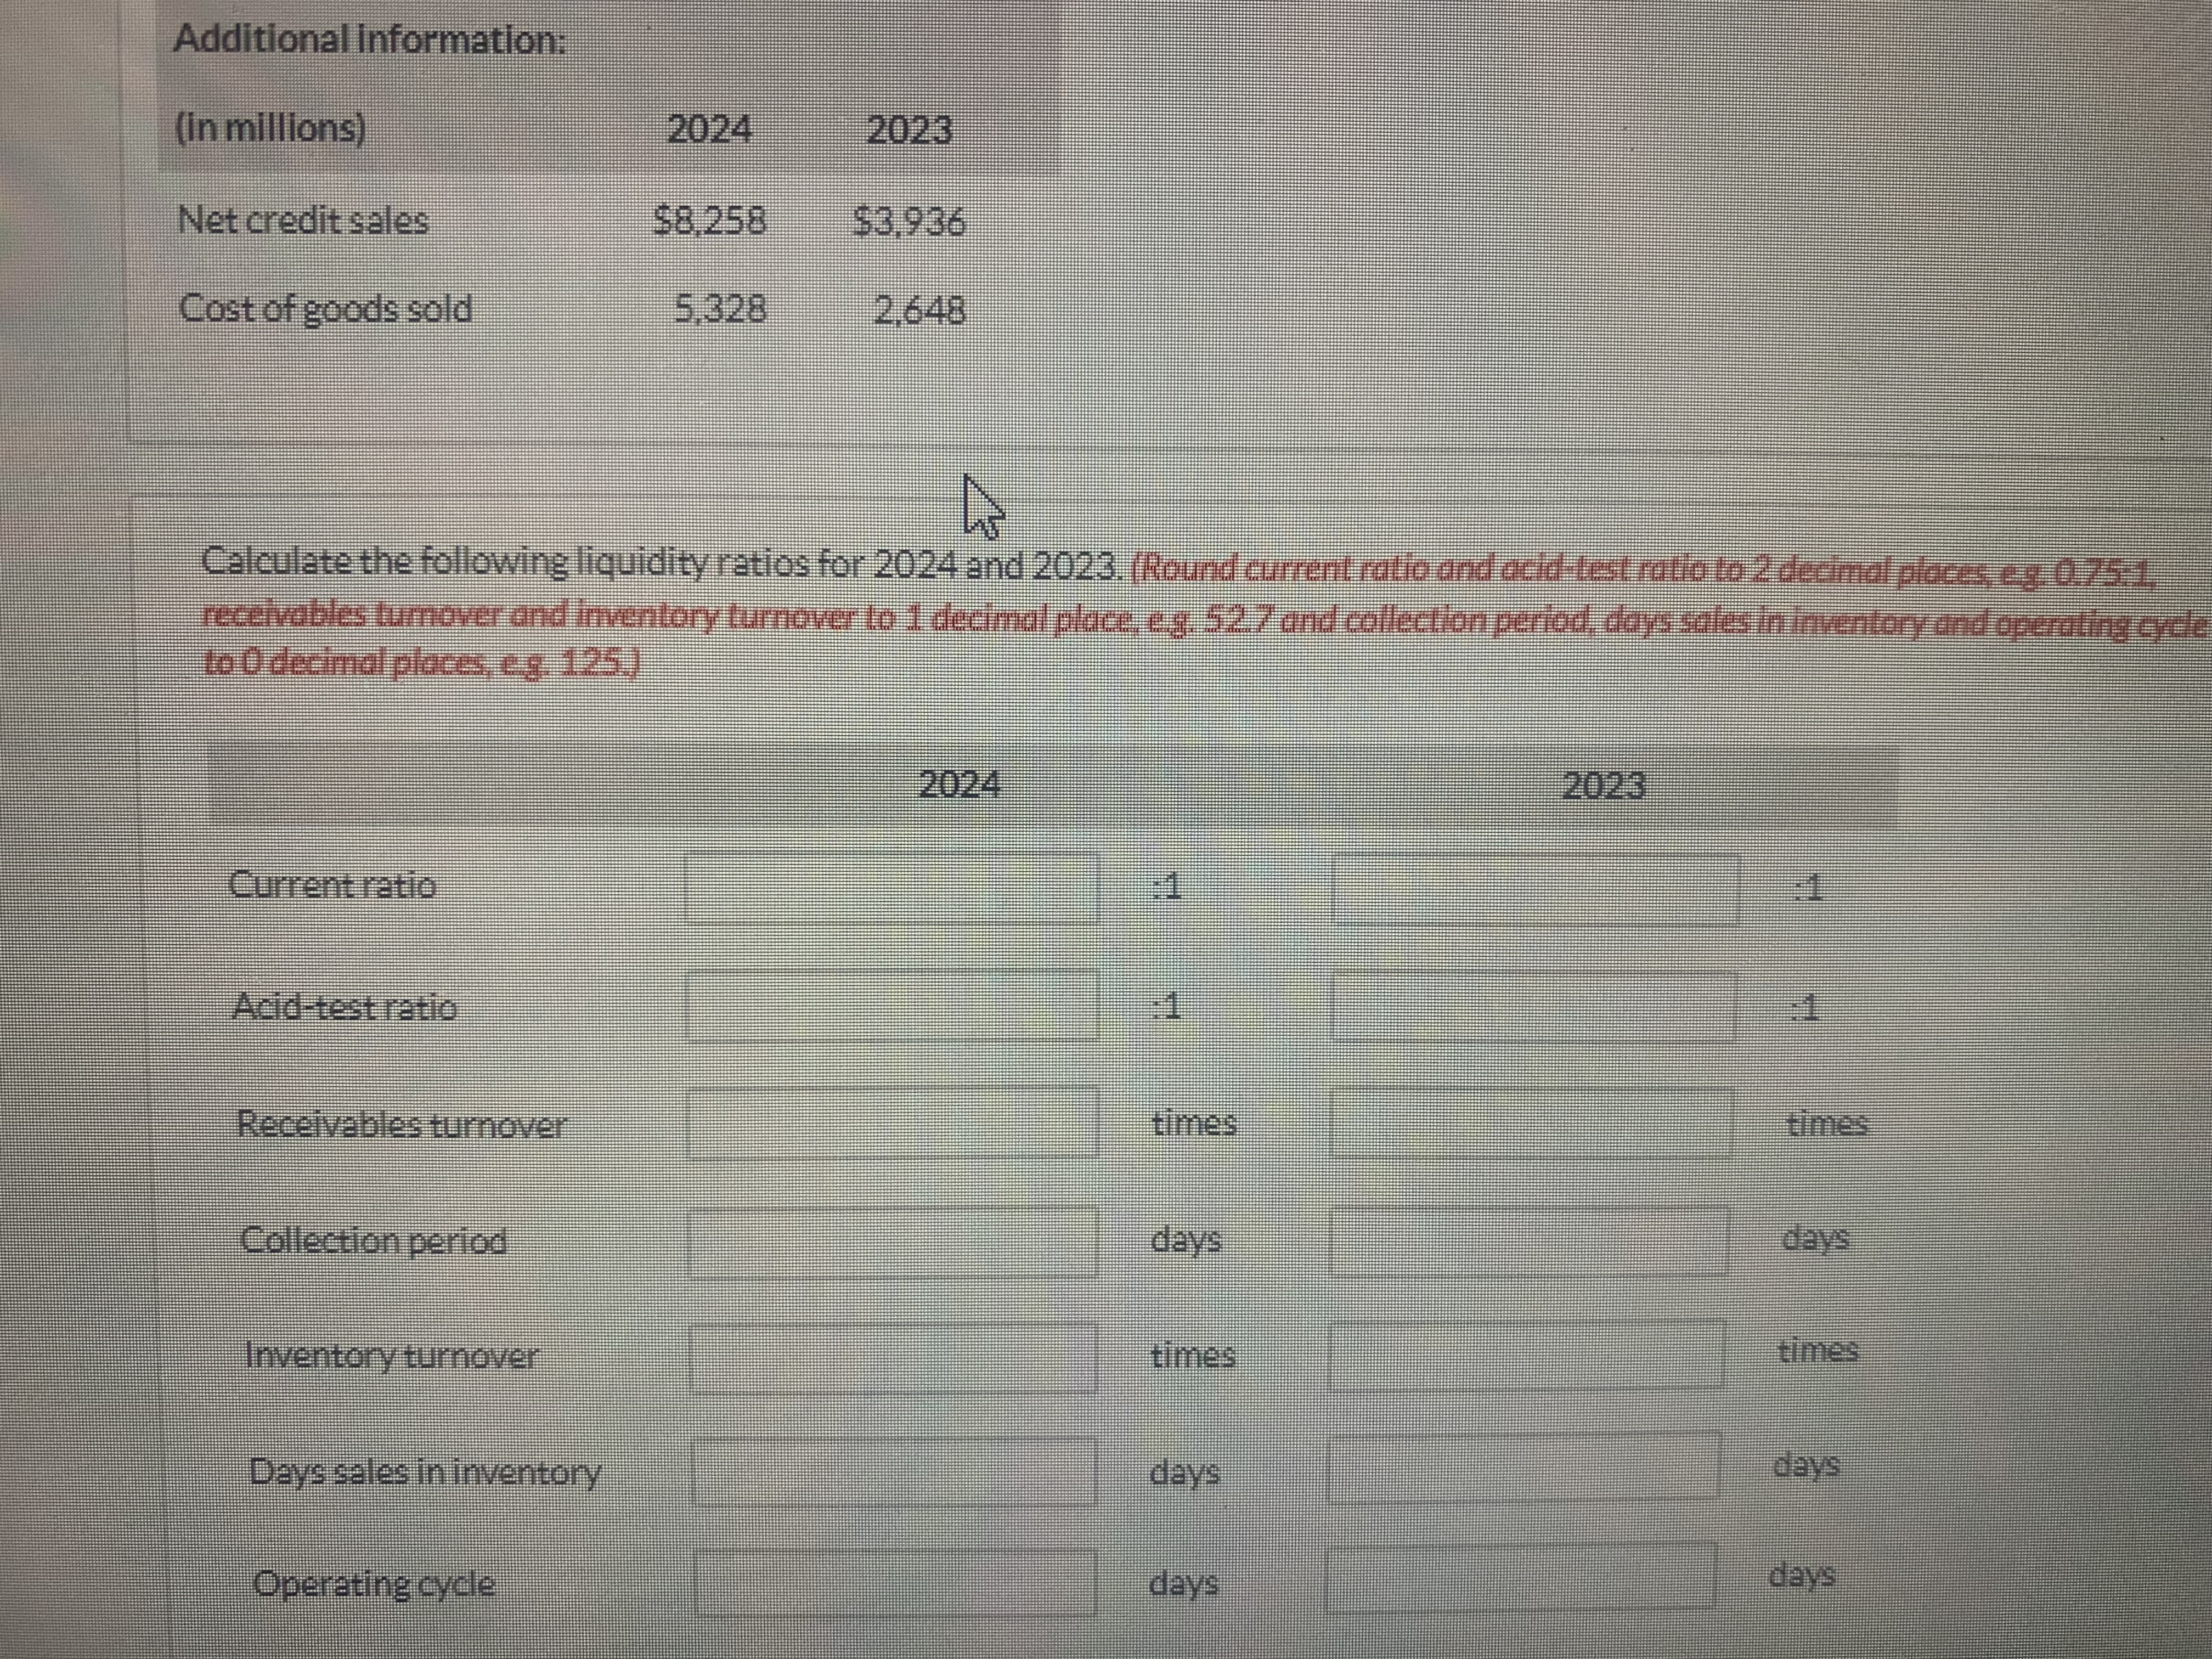
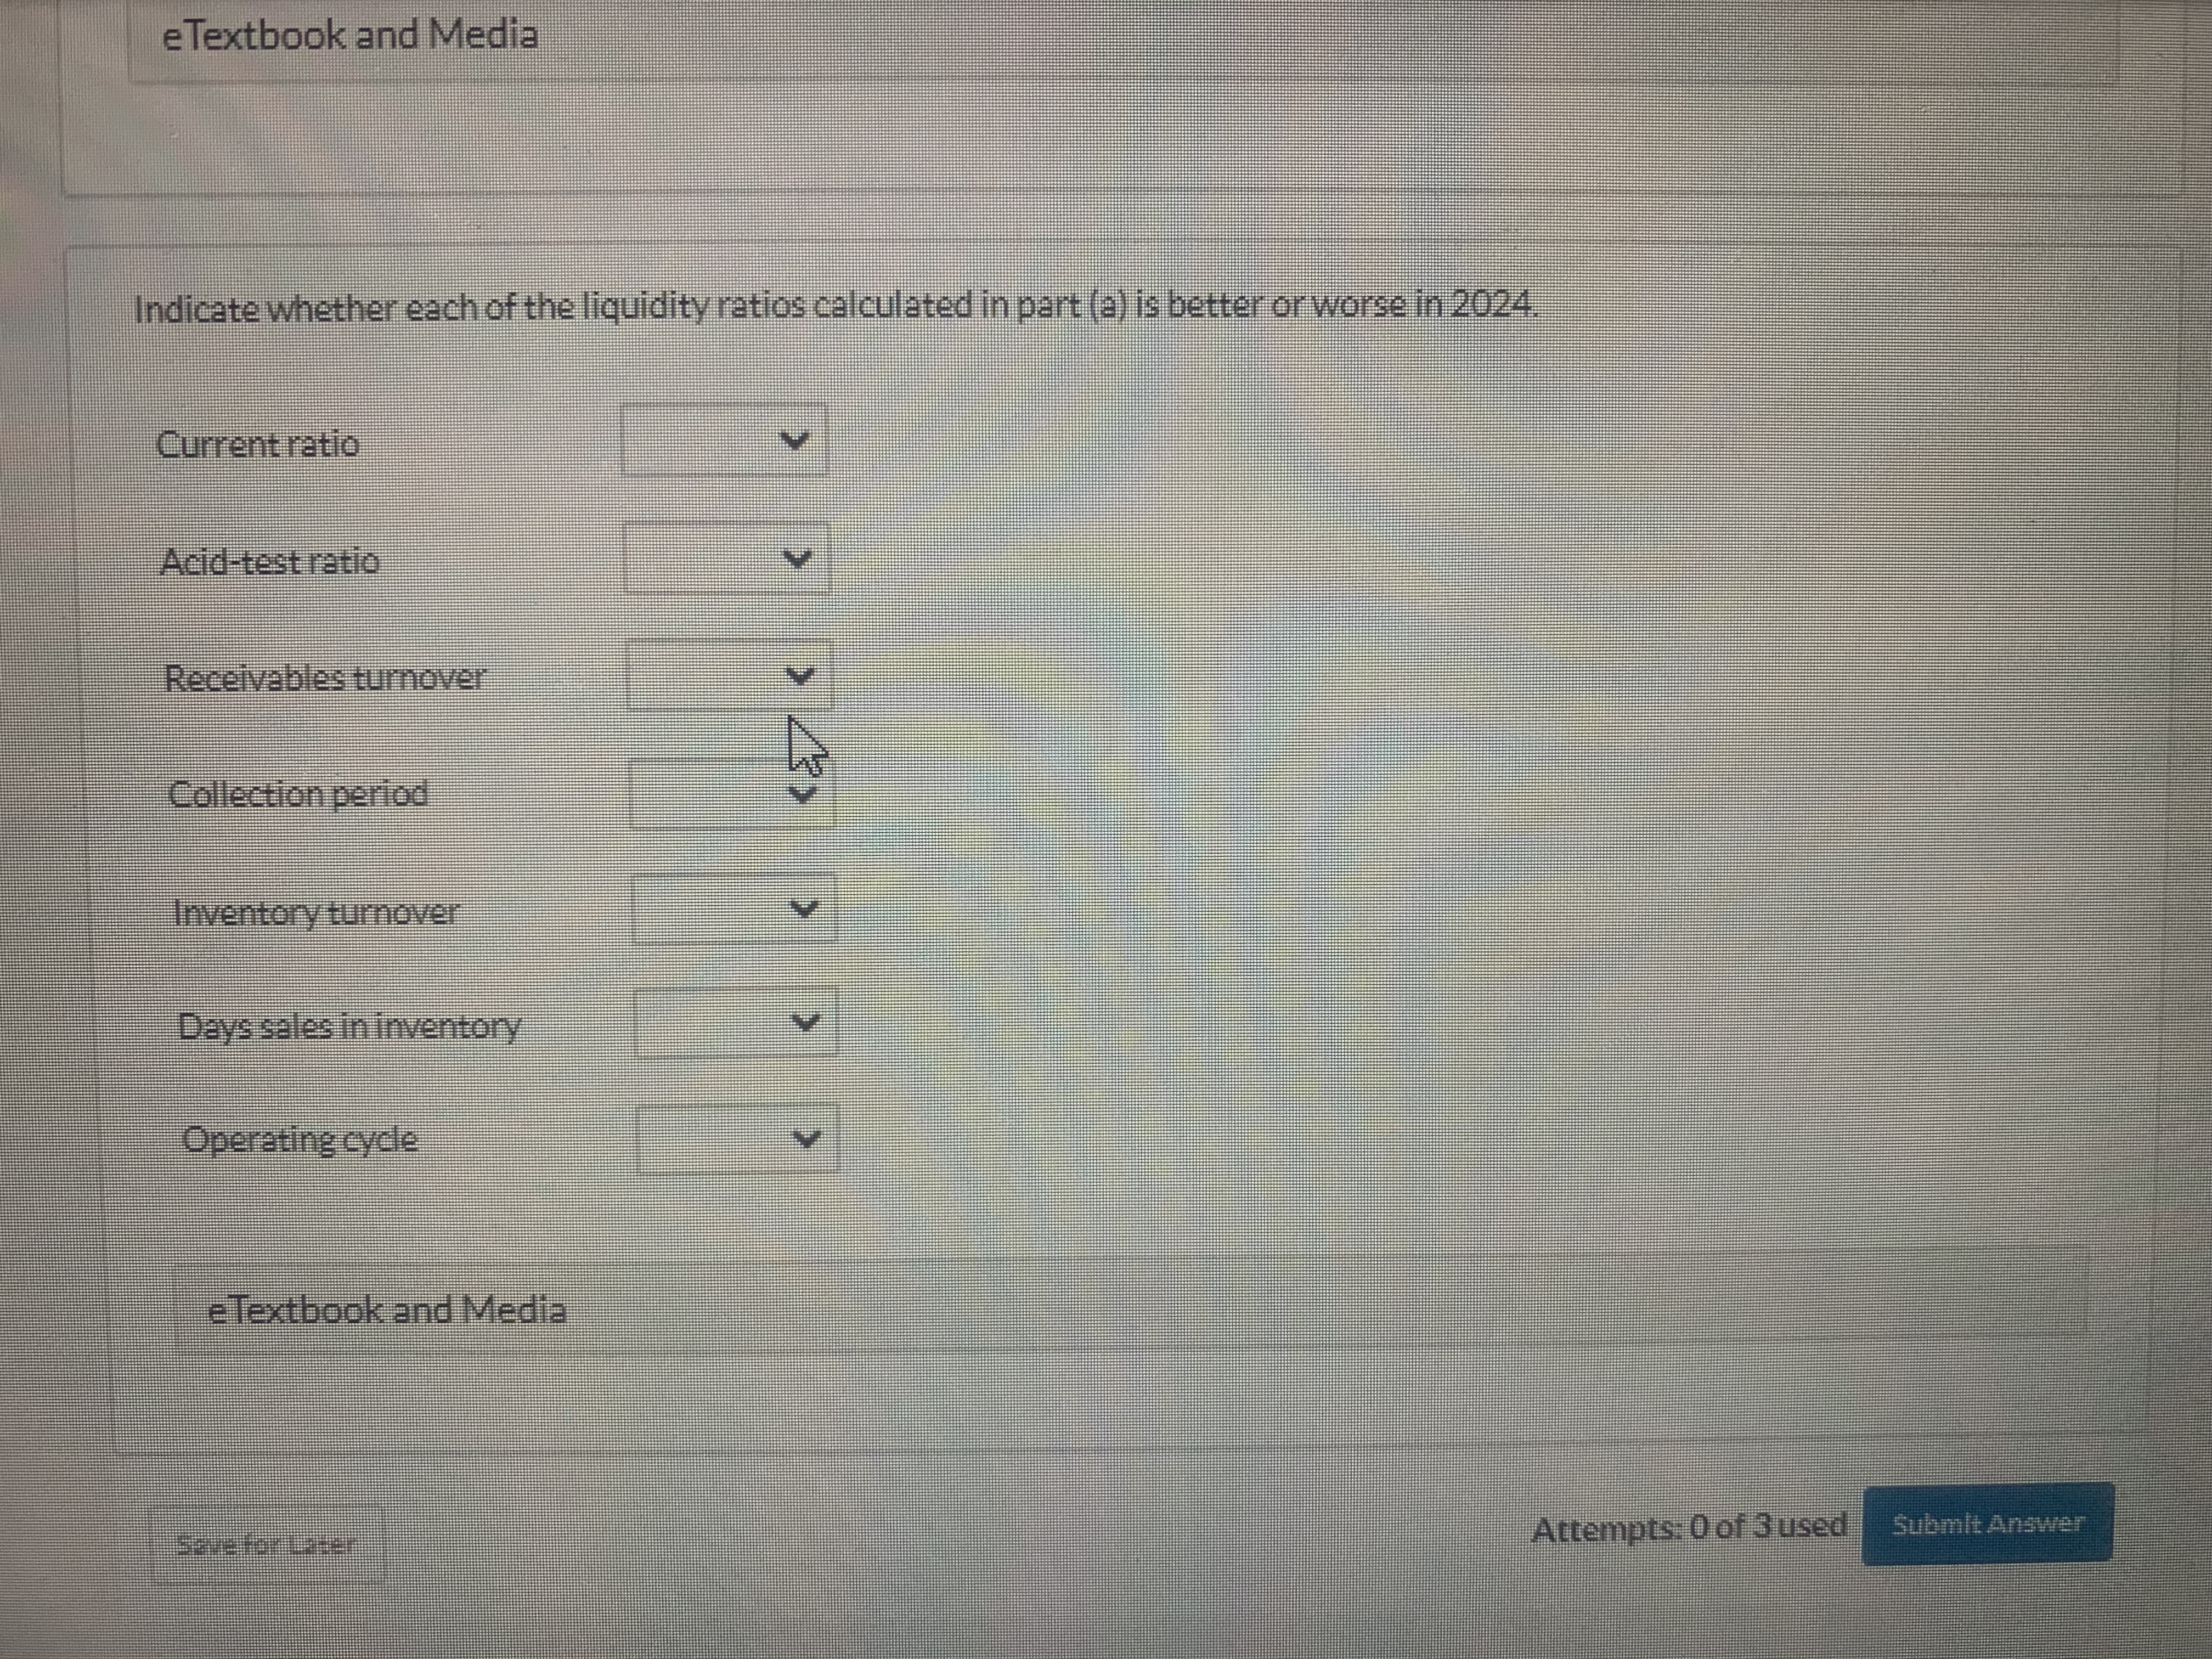
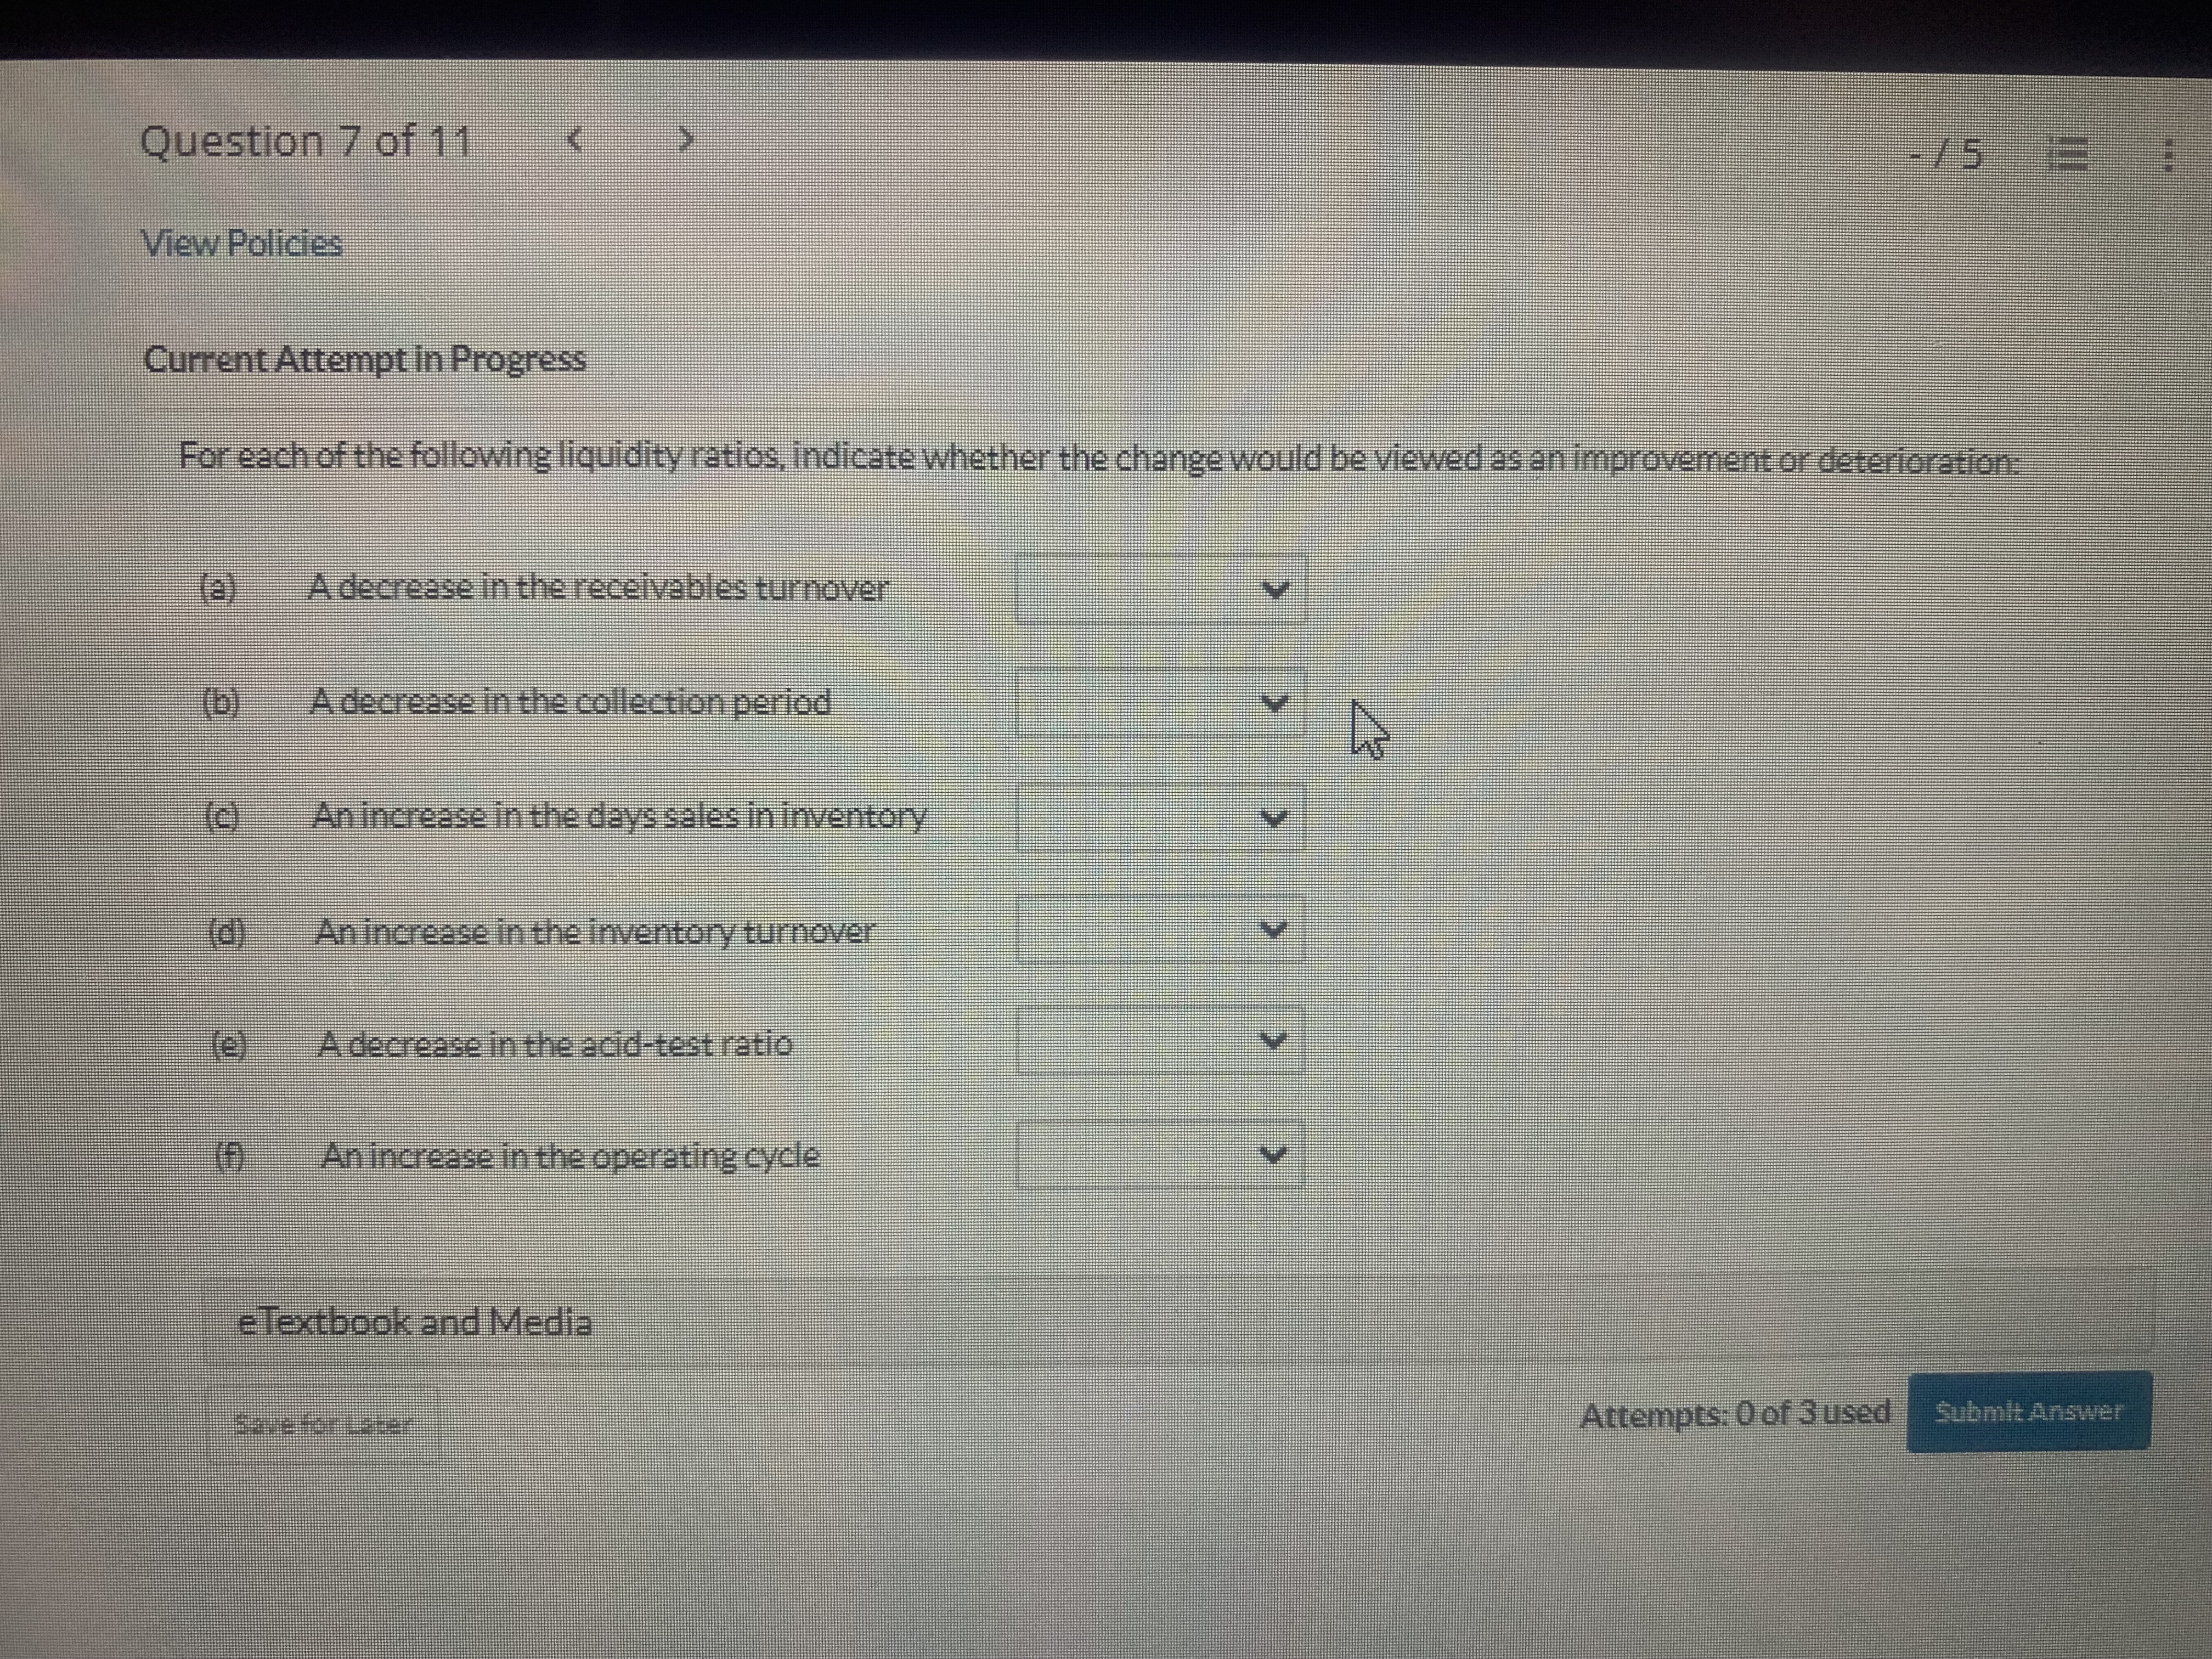
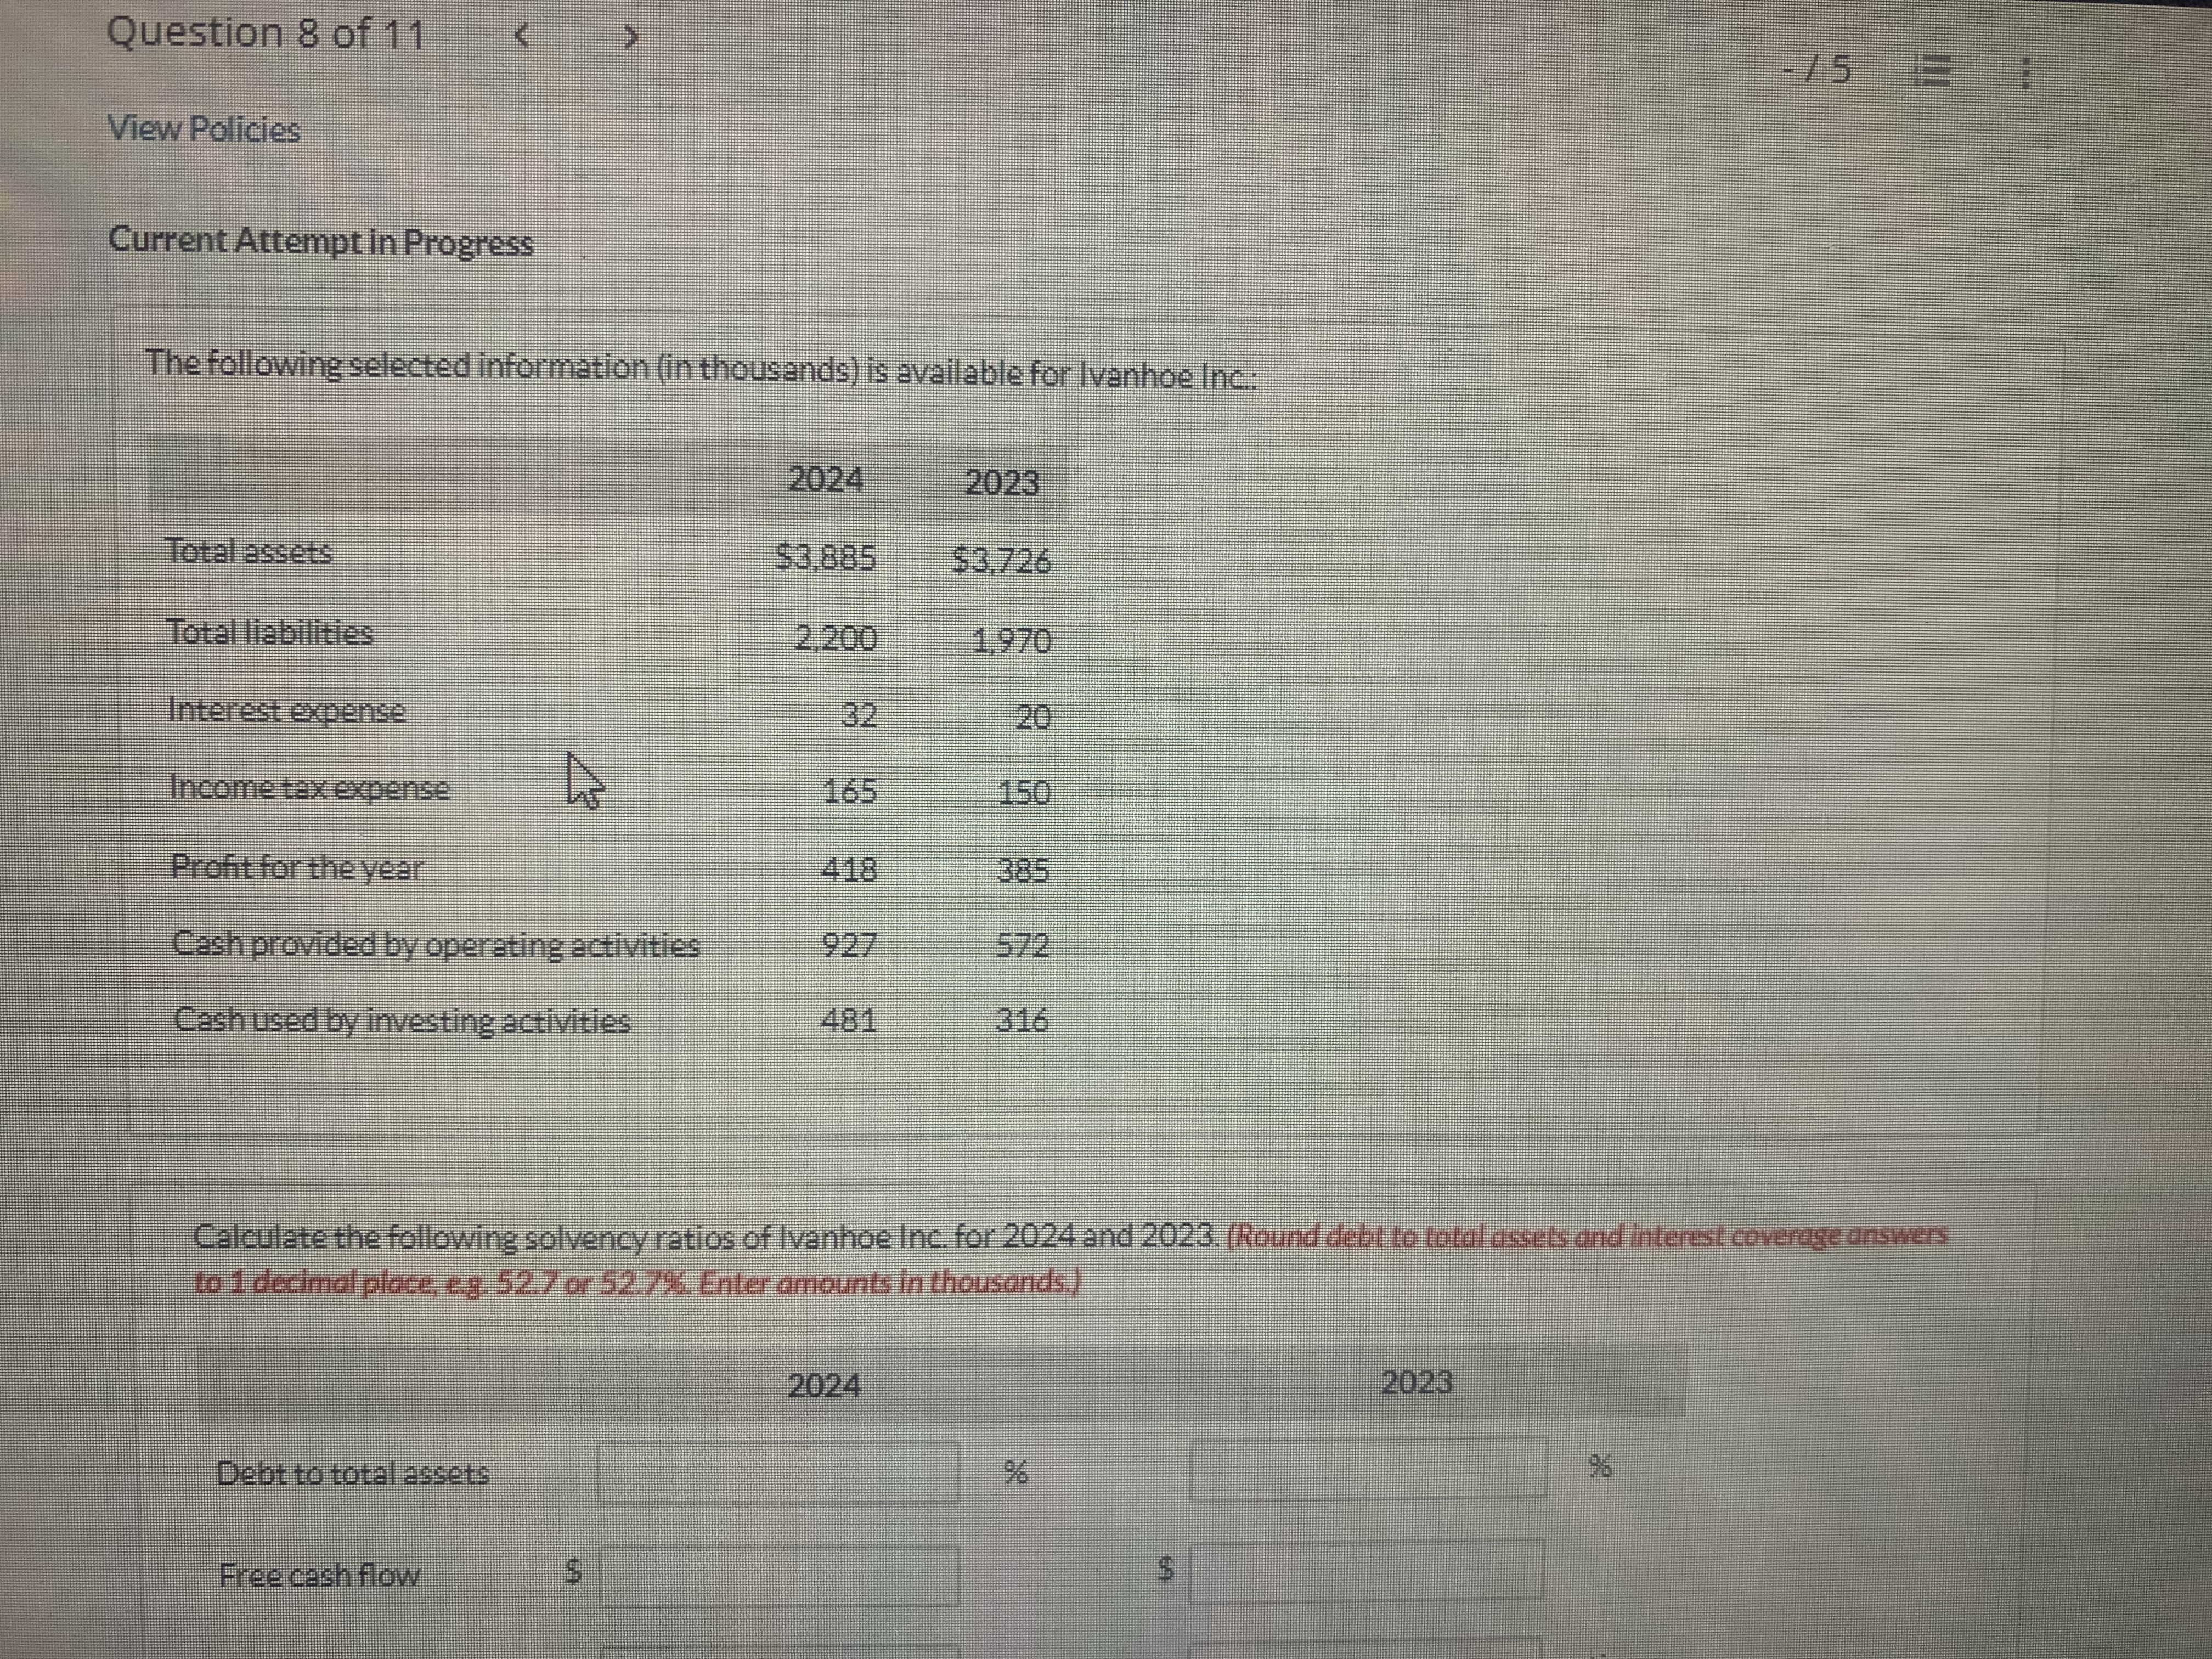
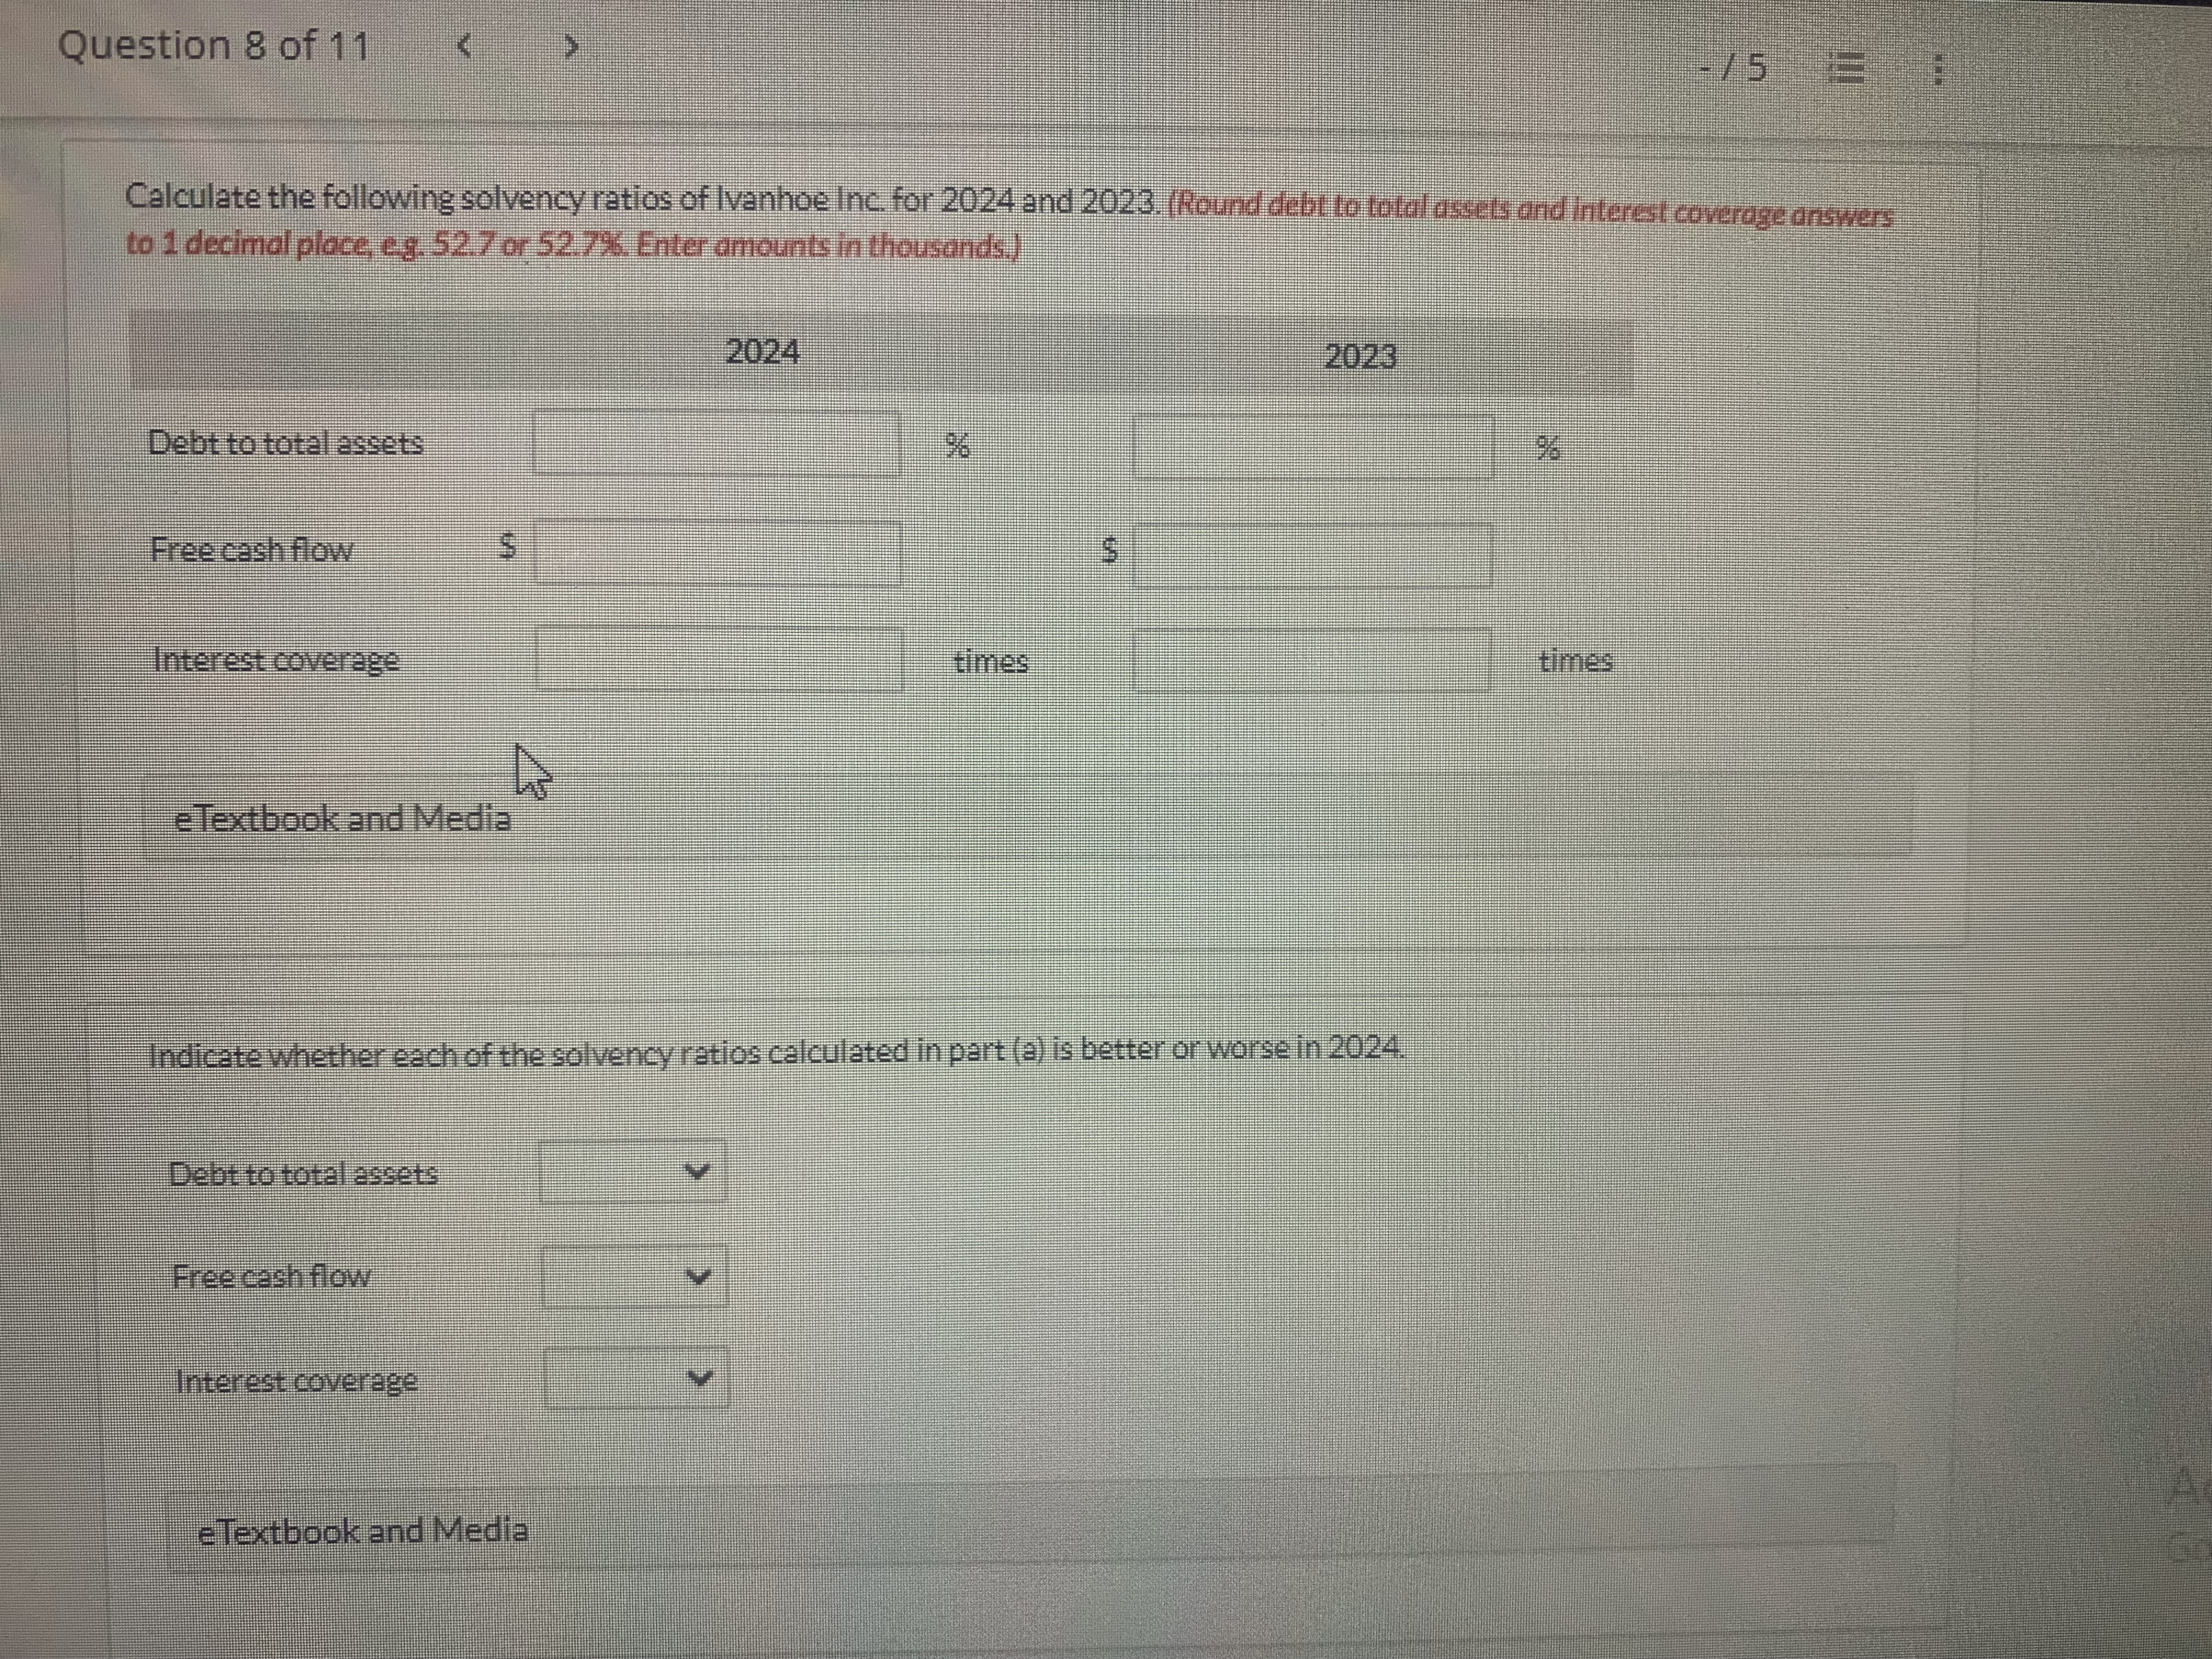
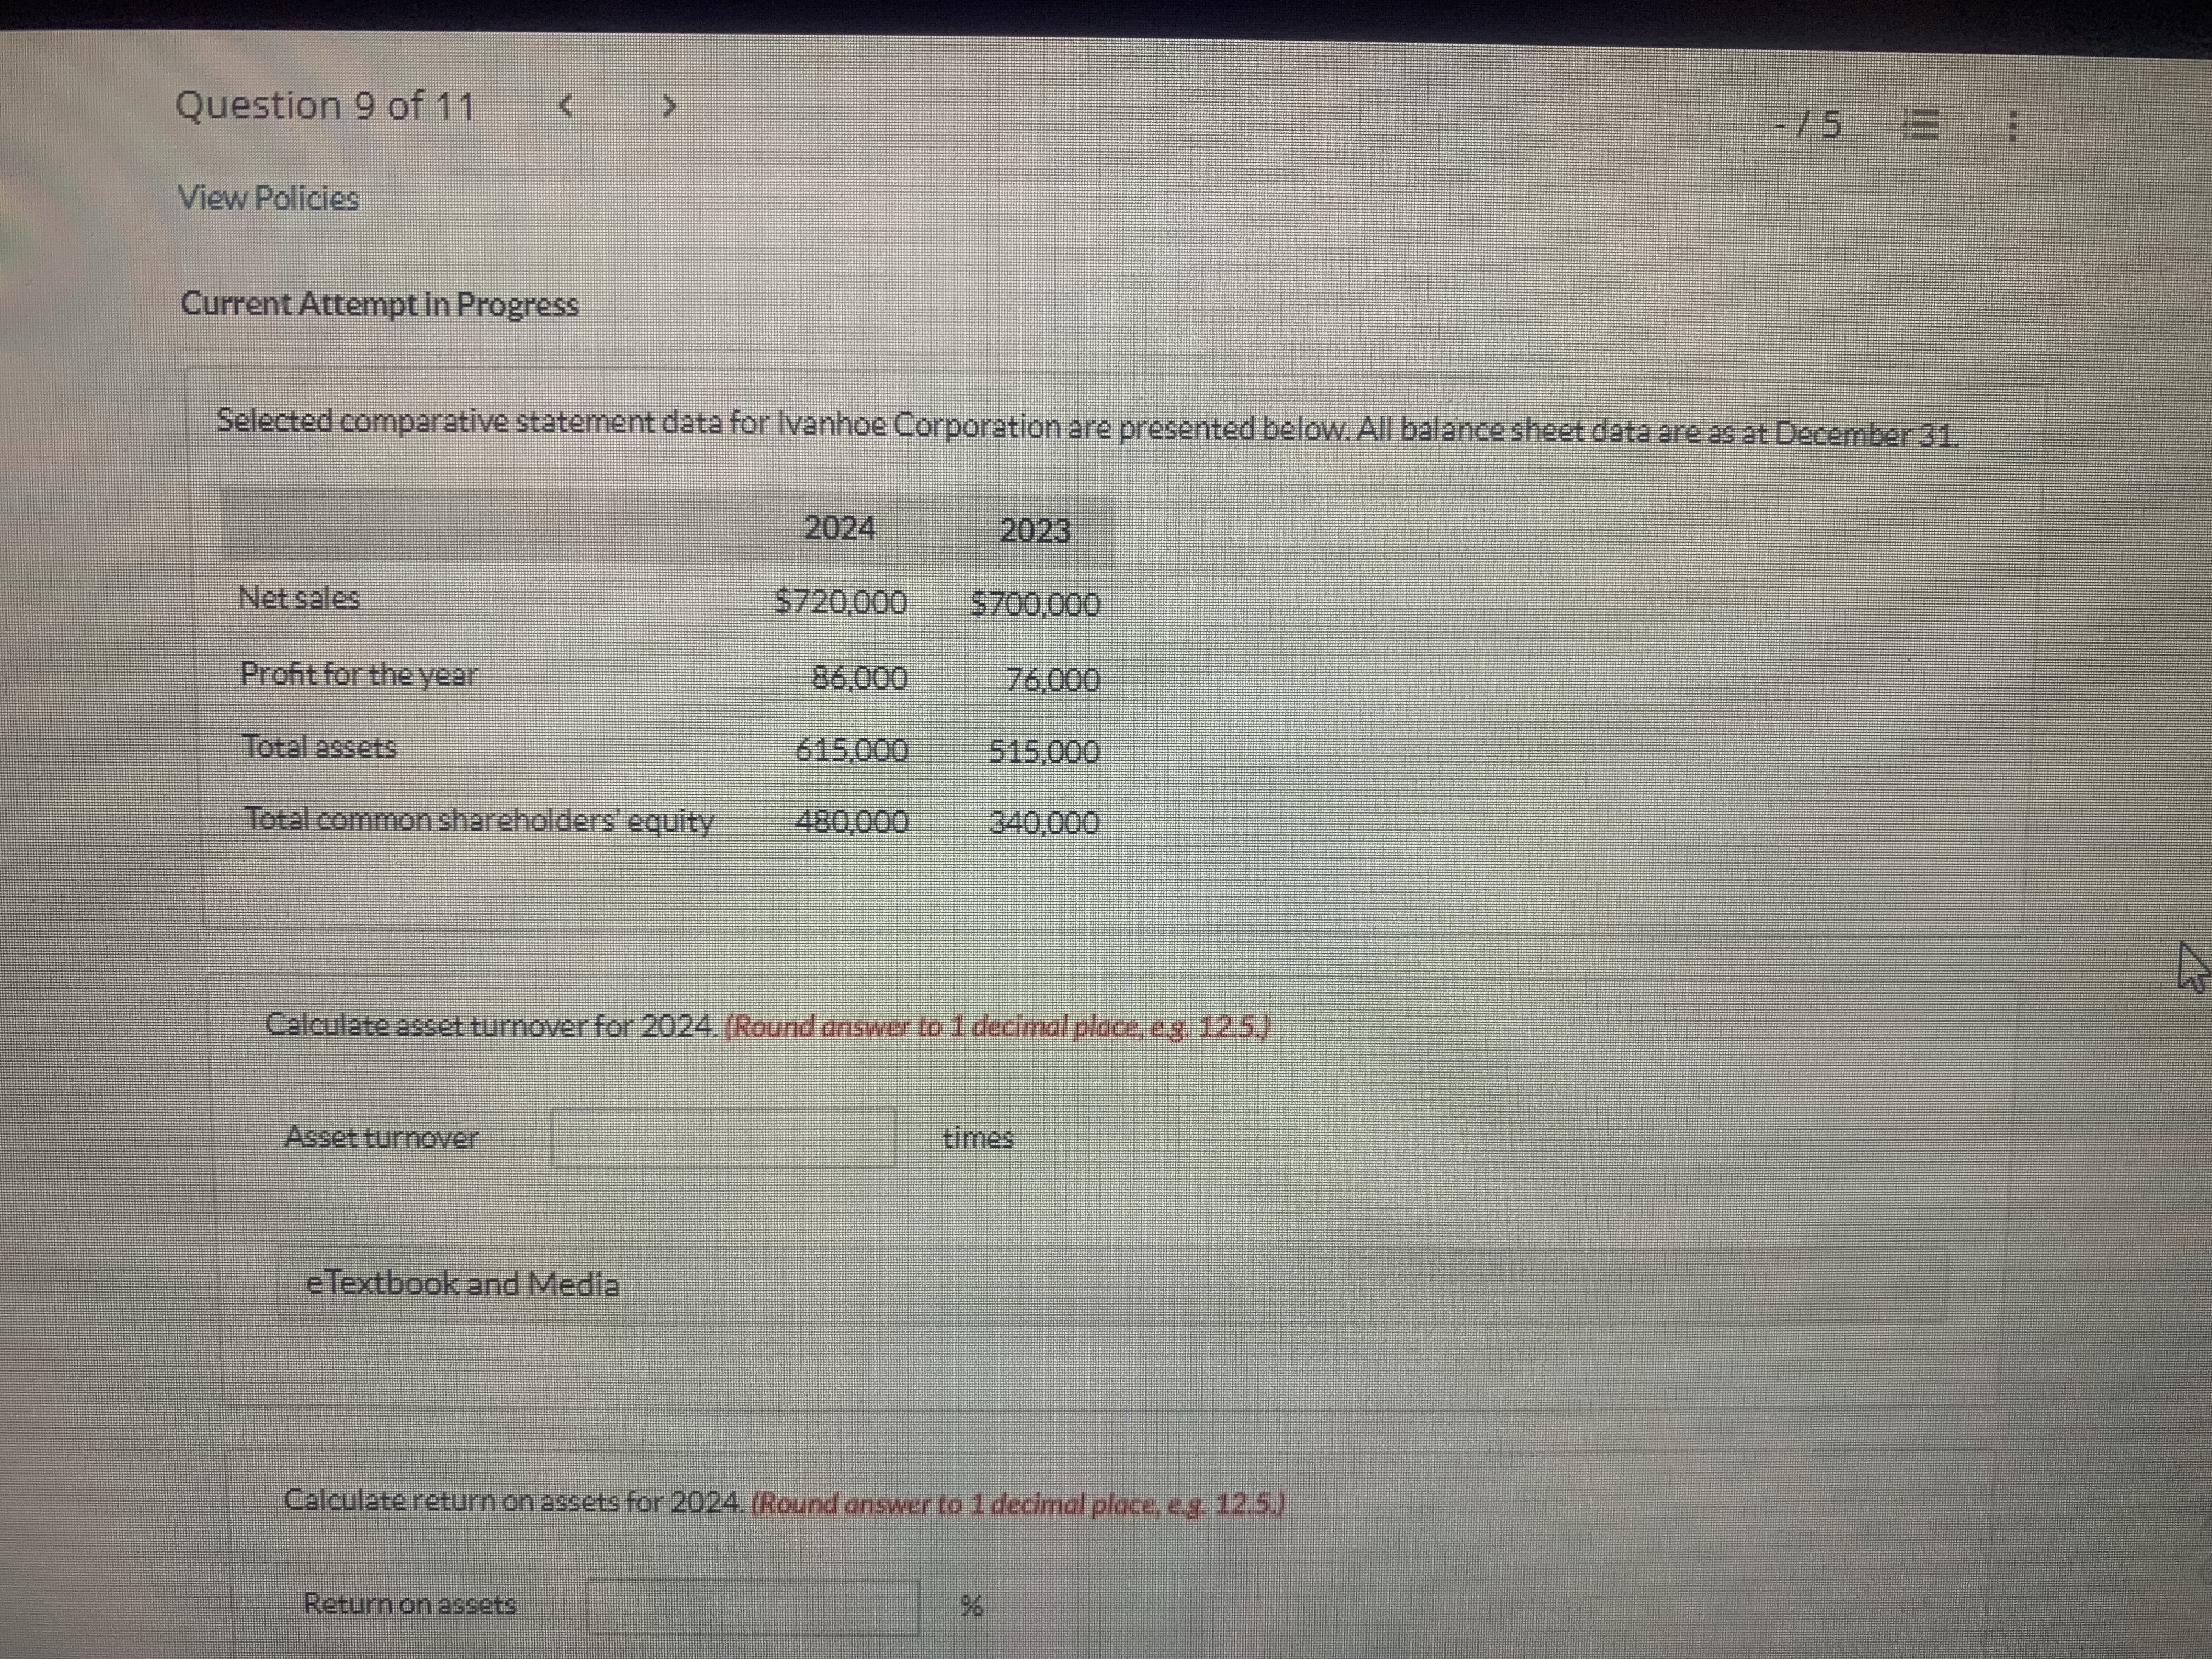
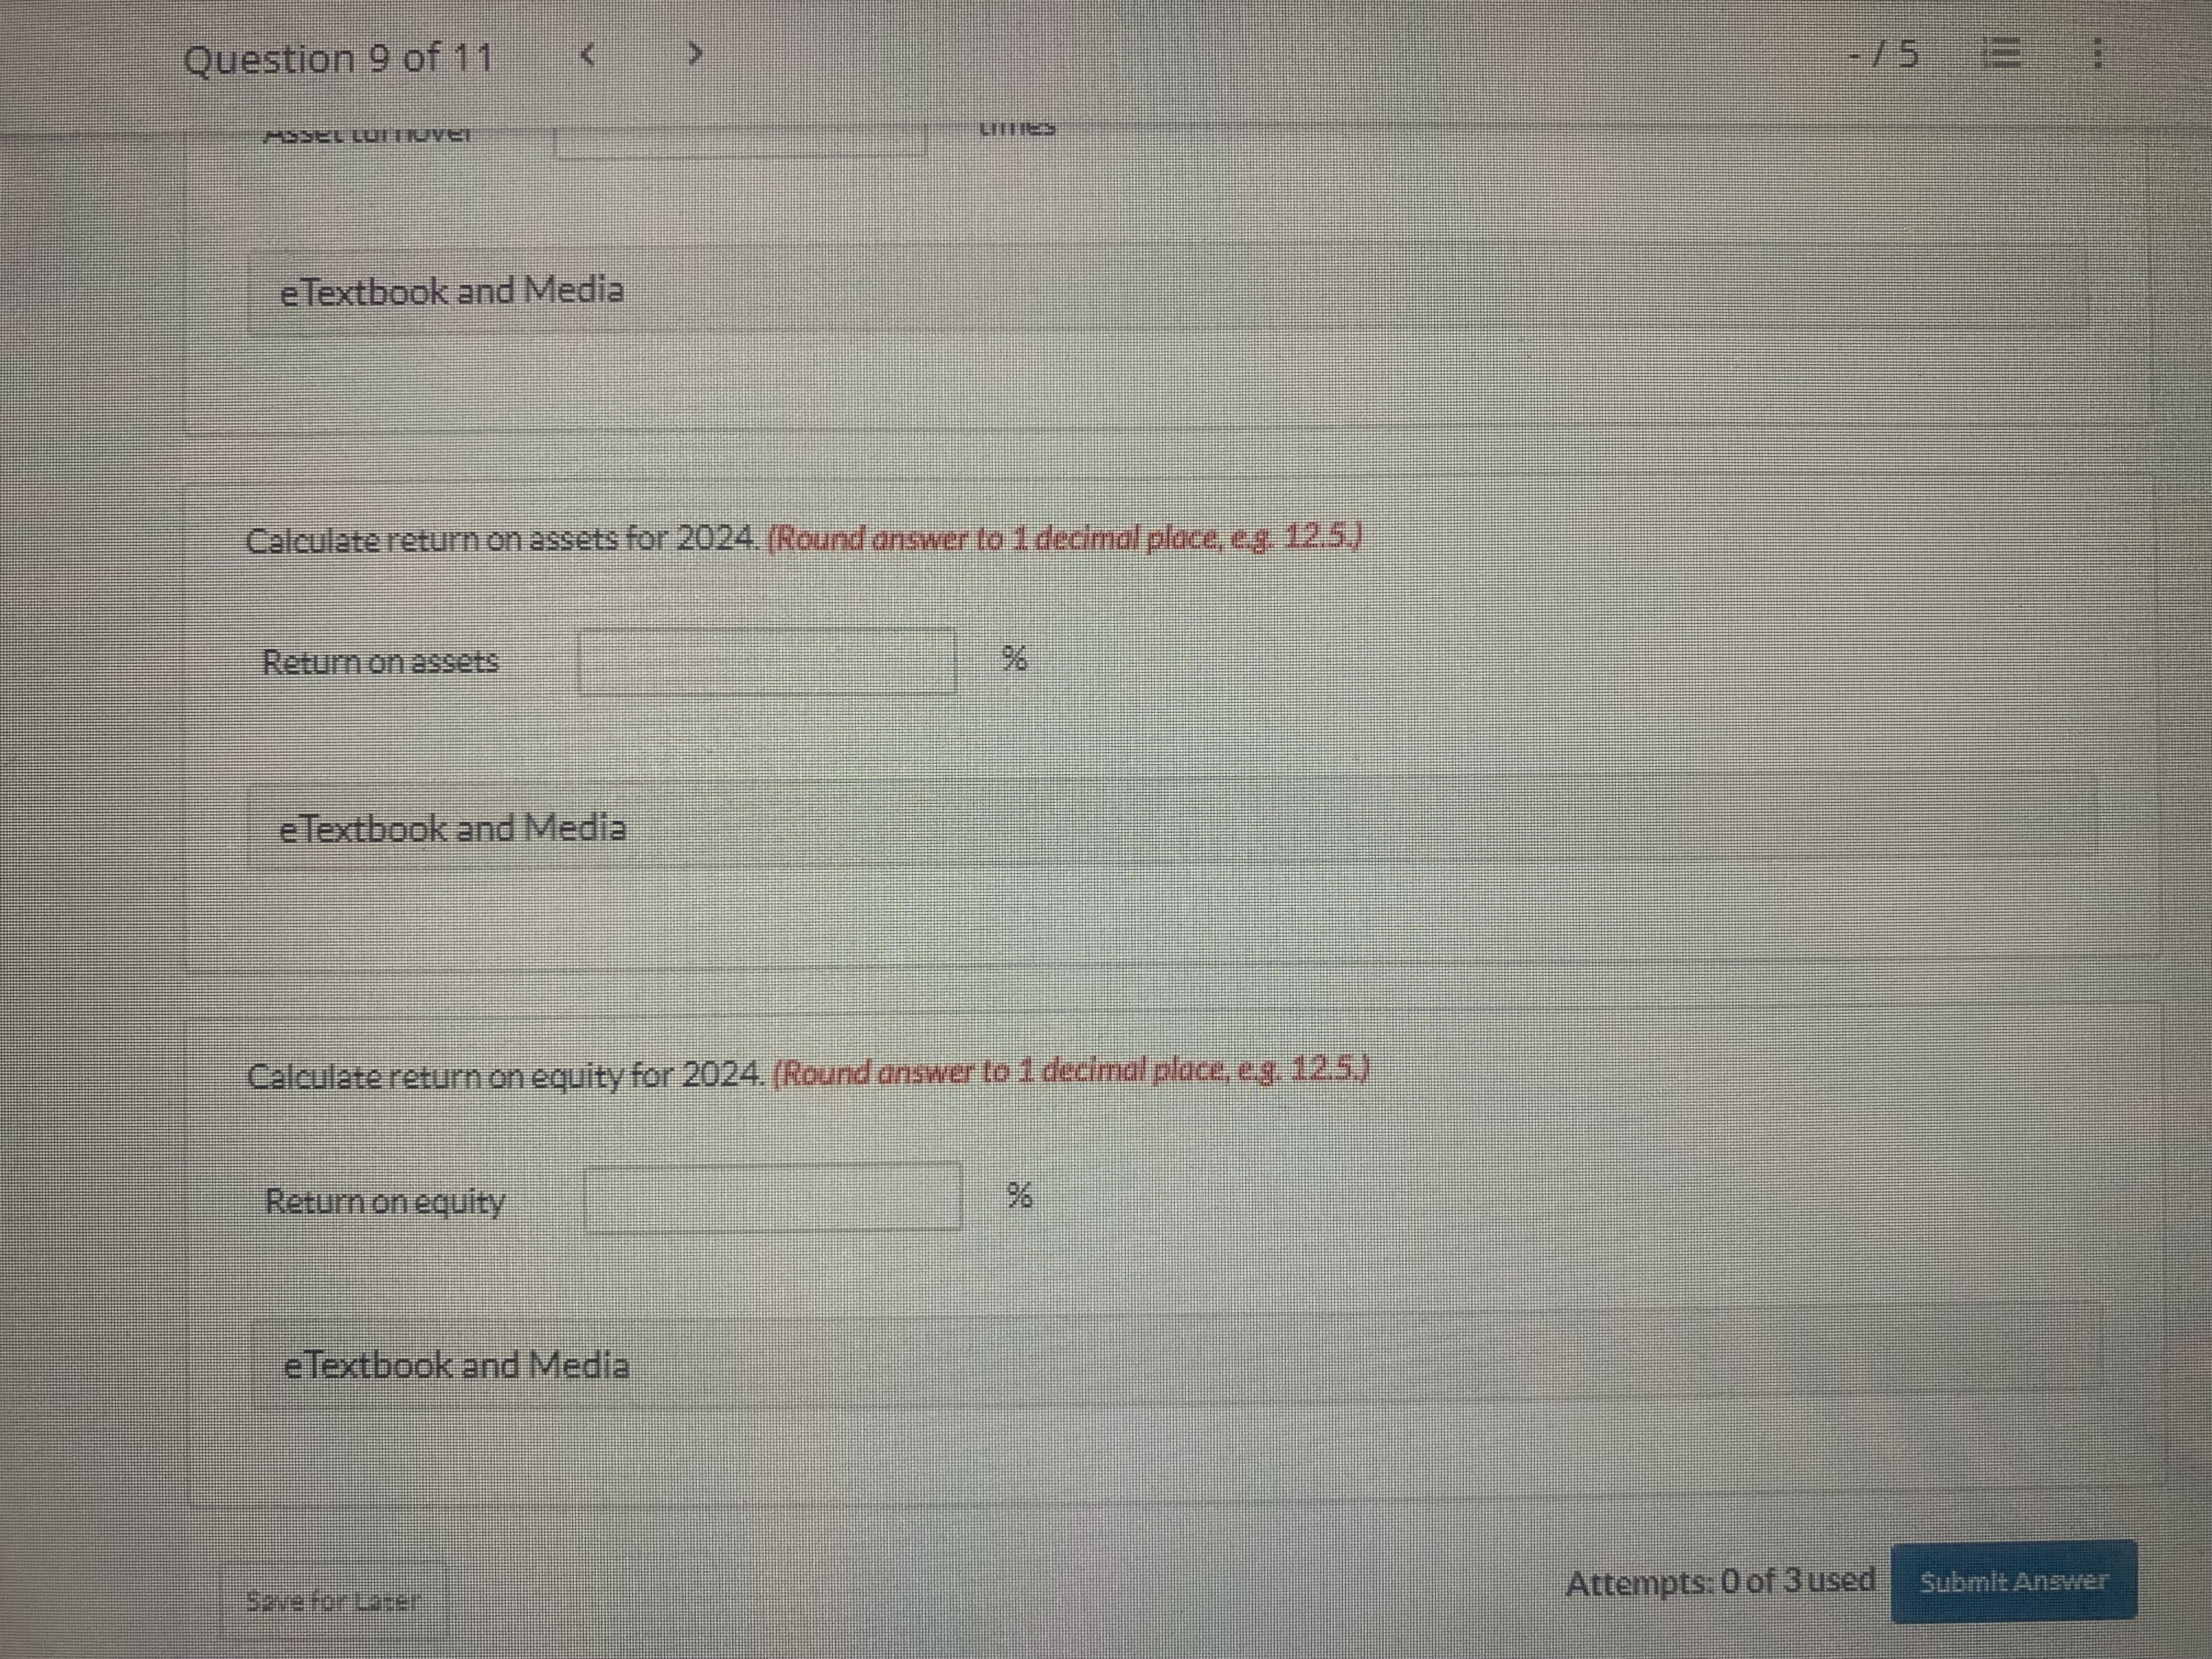
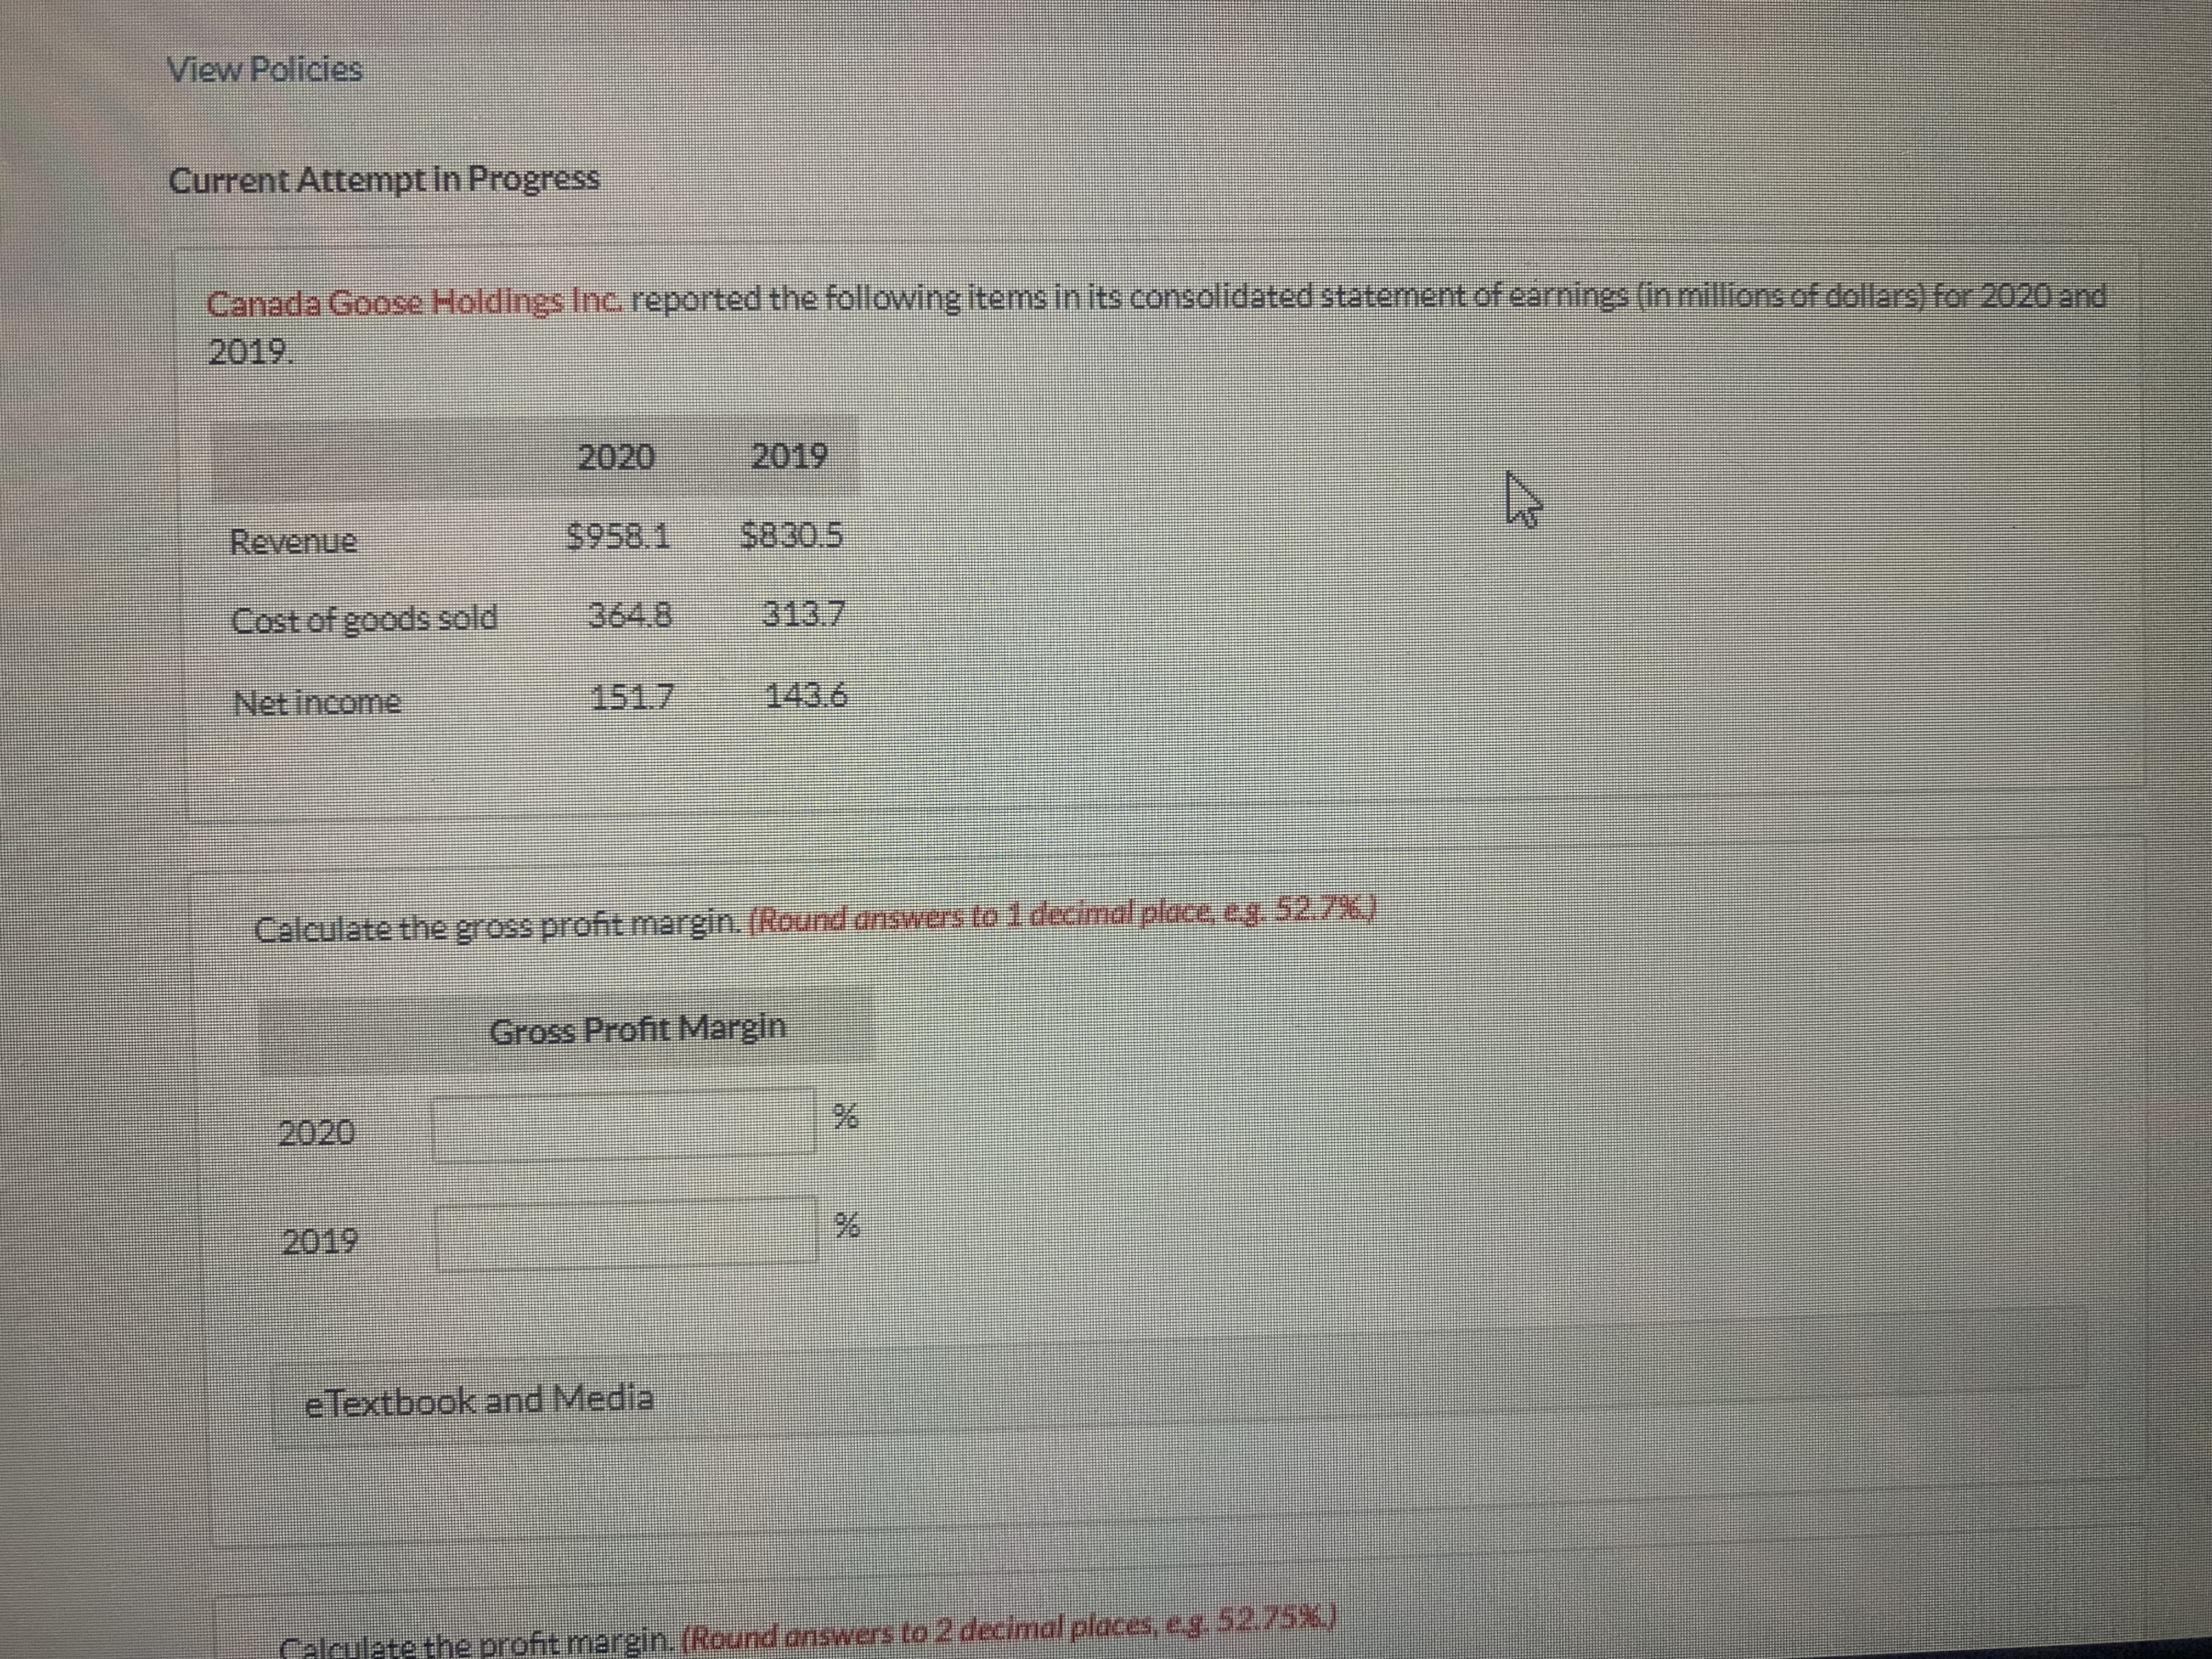
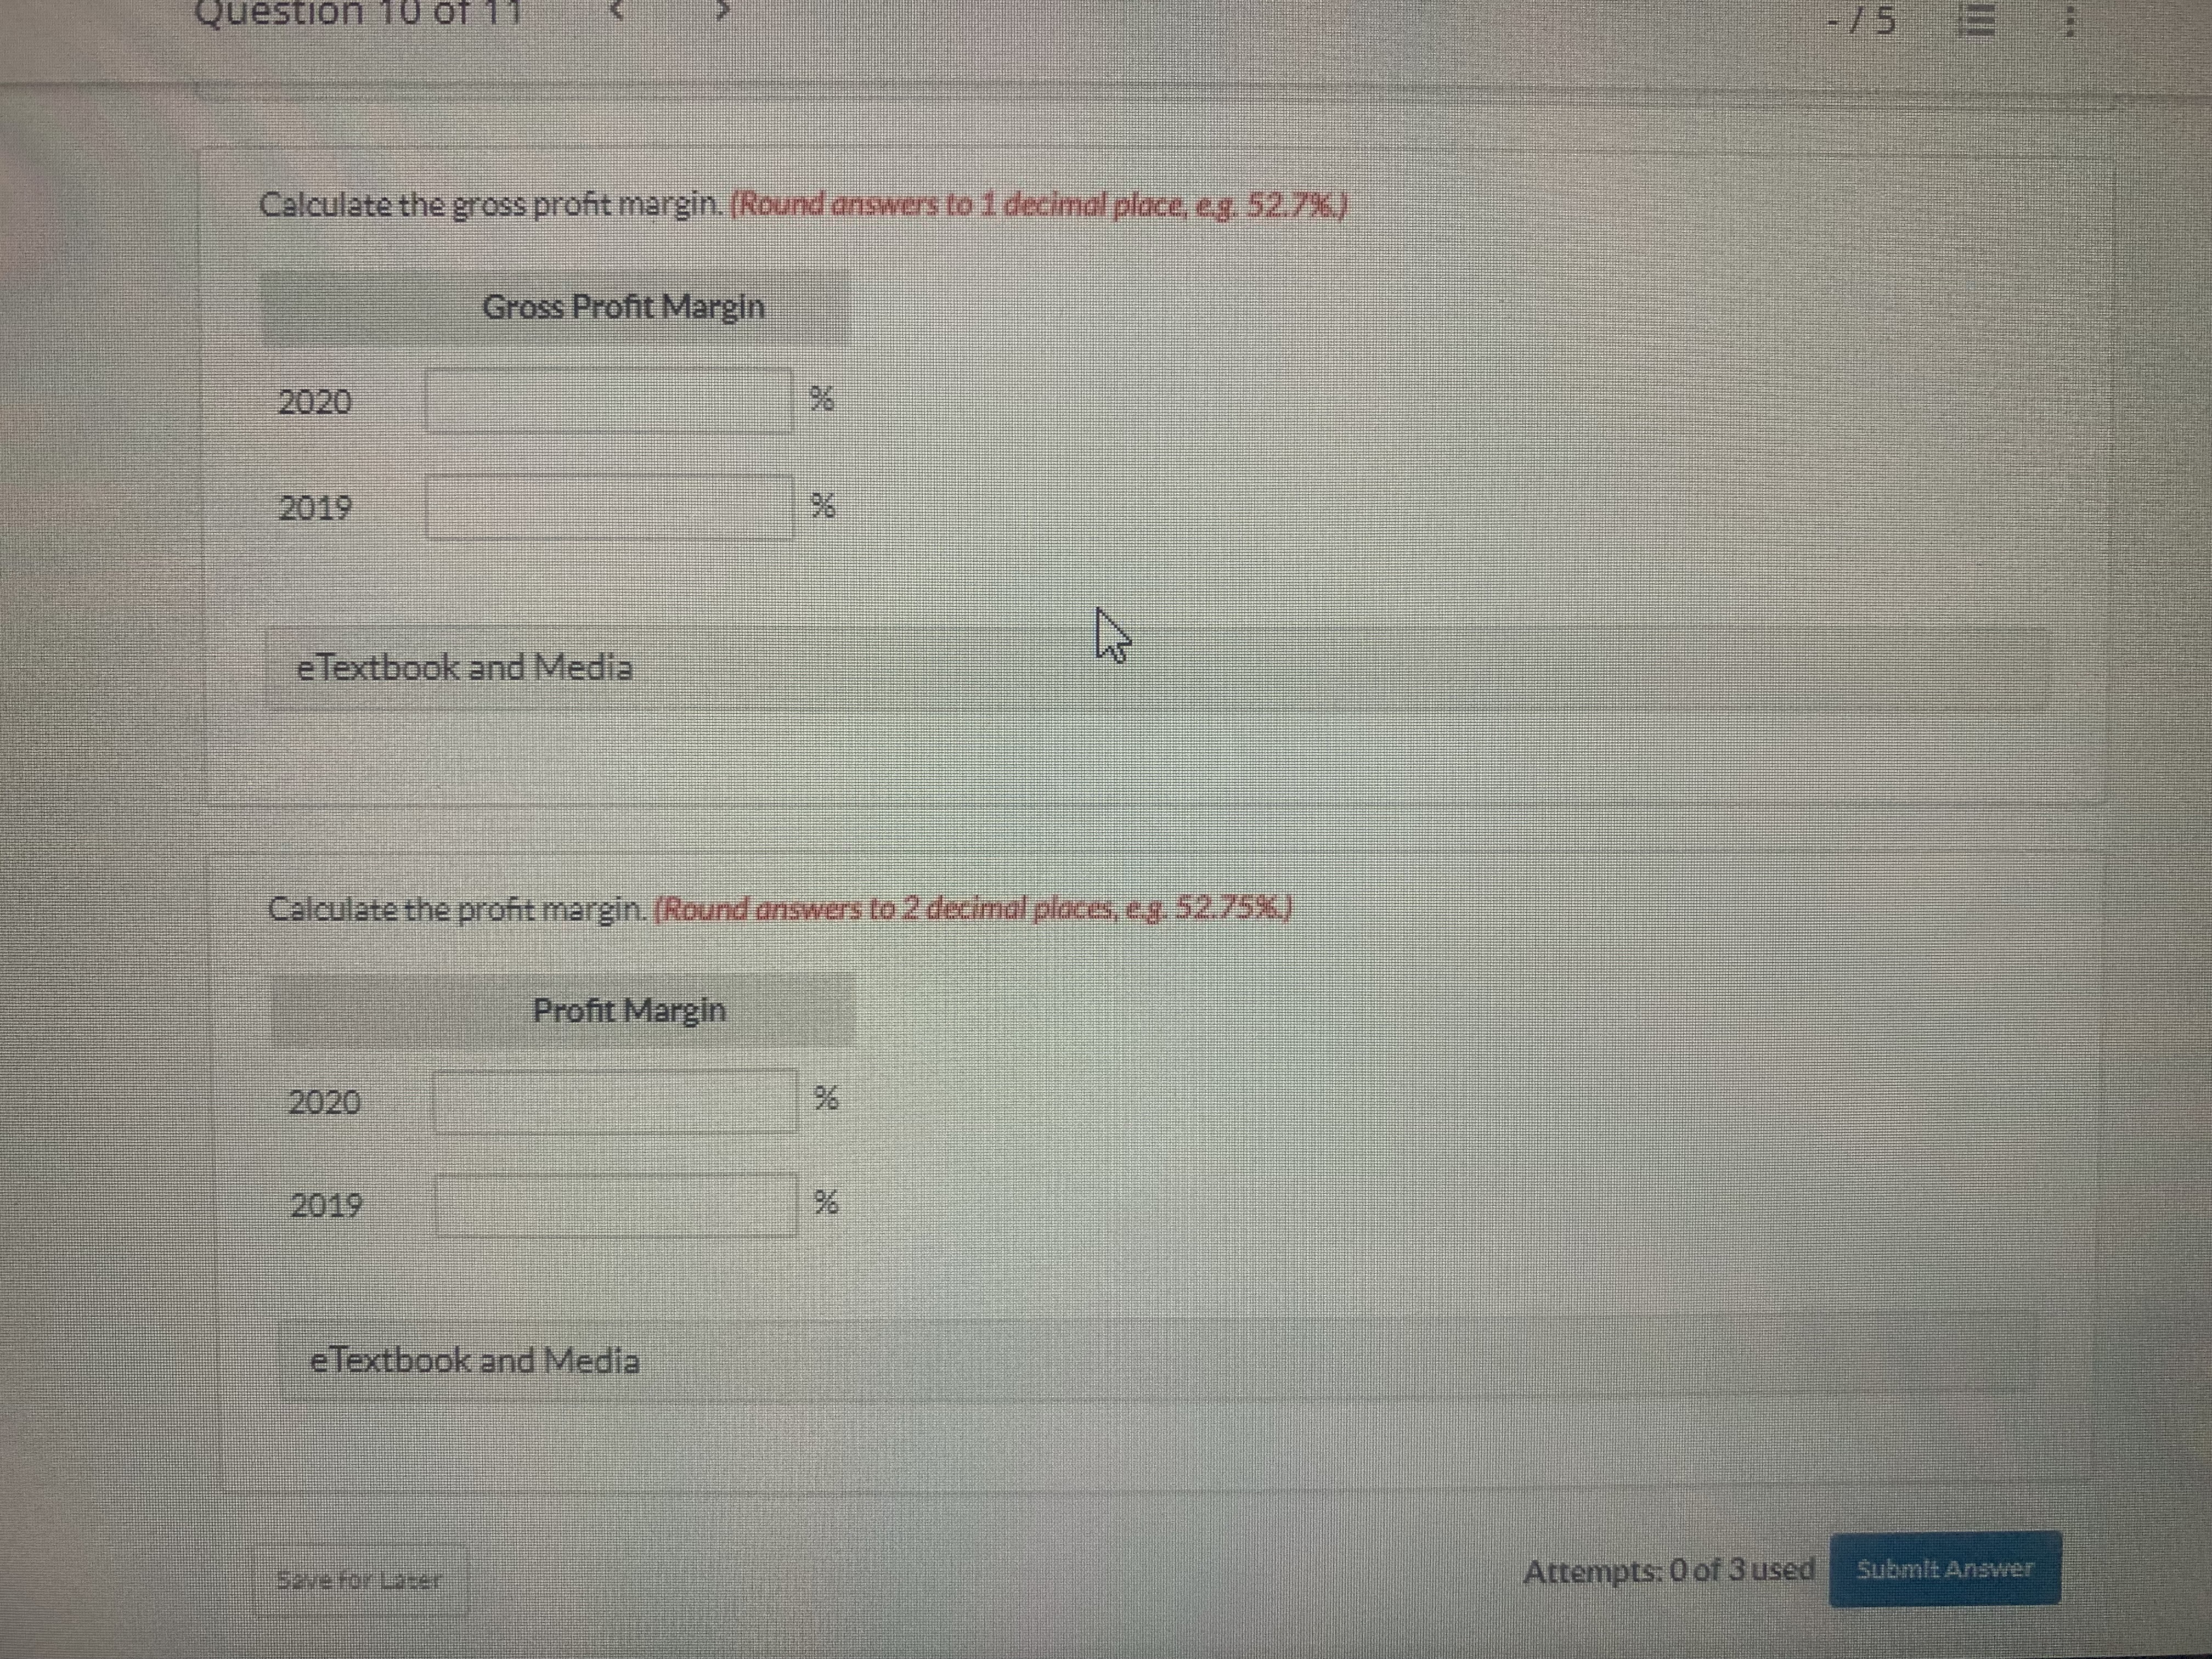
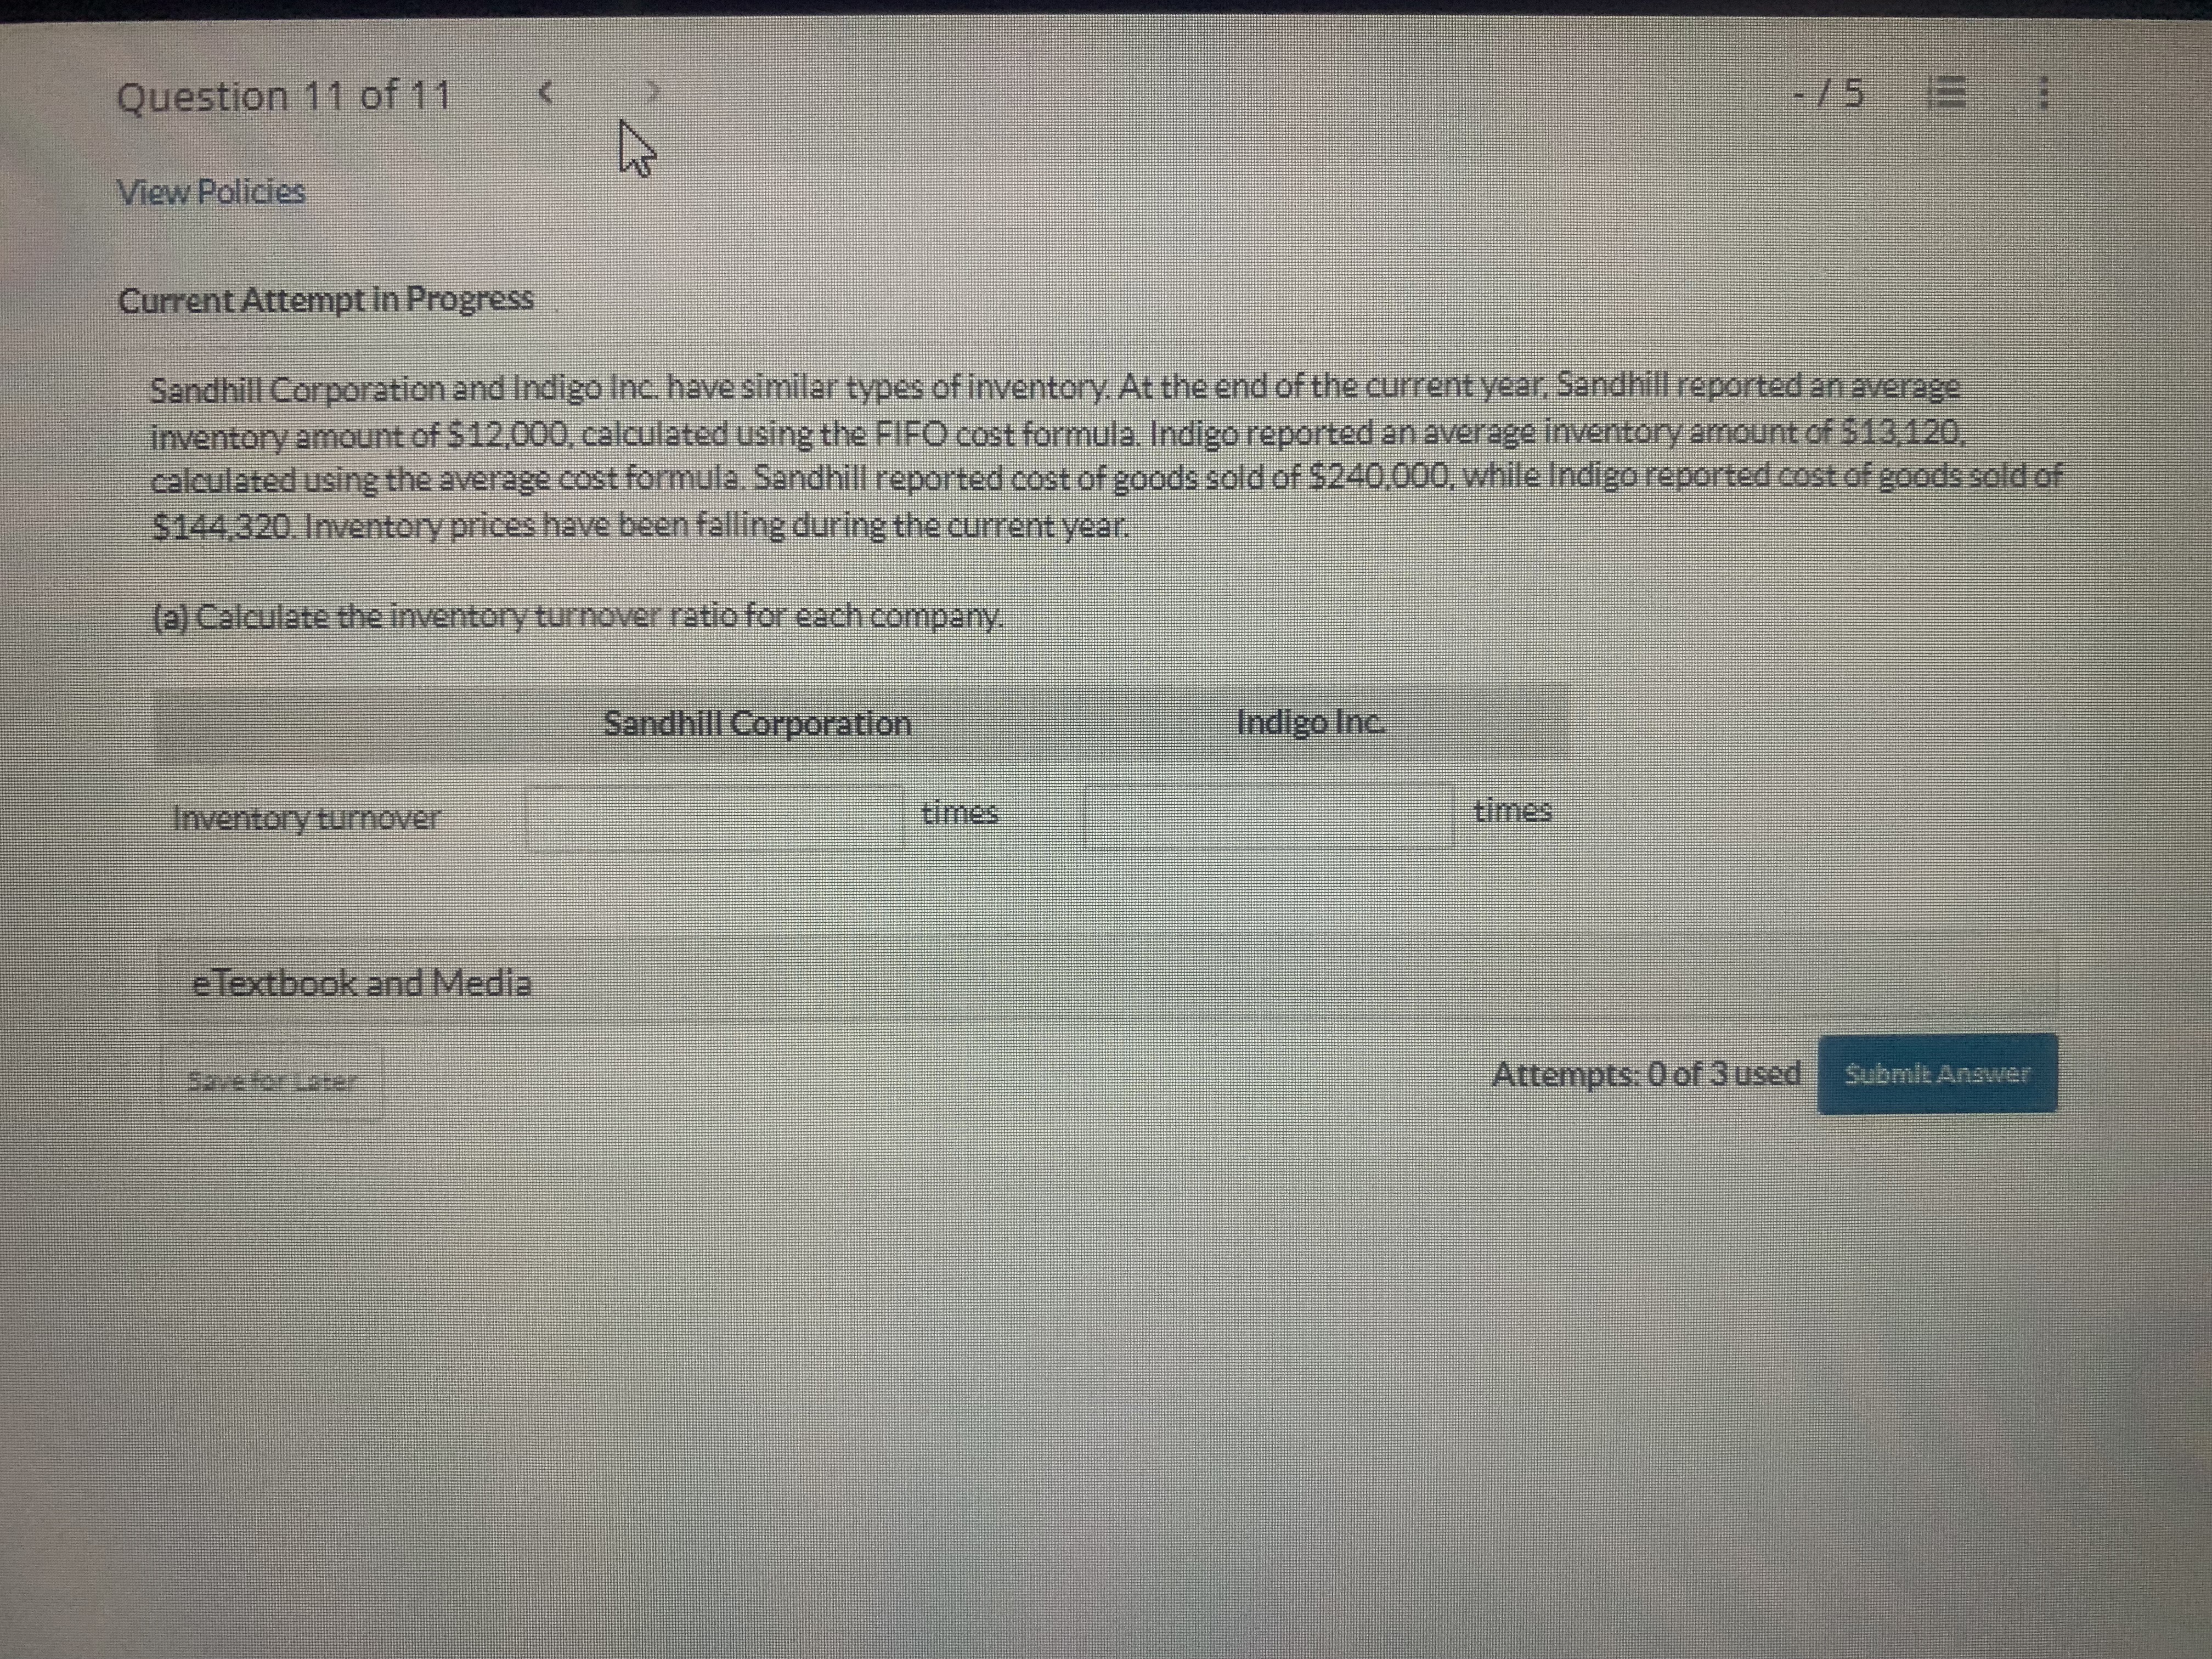
Question 1 of 11 View Policies Current Attempt in Progress Select the appropriate description for the following terms. 4 Intracompan Intercompany Horizontal analysis Vertical analysis Ratio analysis e Textbook and Media Save fenten Description Attempts: 0 of 3 used MEDEN Question 2 of 11 Comparative data (in thousands) from the balance sheet of Blossom Ltd. are shown below. Accounts receivable Inventory Prepaid expenses Total current assets Accounts receivable Inventory Prepaid expenses 500 current assets 245 $636 Using horizontal analysis, calculate the percent of base year, assuming 2021 is the base year. (Round answers to 0 decimal places, e.g. 158 21 X -/10 5 96 MAN Question 4 of 11 View Policies Net sales Current Attempt in Progress Comparative data from the income statement of Oriole Corporation are shown below. Cost of goods sold Gross profit < Operating expenses Profit before income tax Income tax expense Profit for the year Jury 41315 2024 $831,000 $591,000 556,770 378,240 149,580 124,650 31,163 $93,487 Prepare a vertical analysis for Oriole Corporation. (Round percentage answers to 1 decimal place, e.g. 52.7%) 212,760 101,280 111,480 27,870 $83,610 Amount $831,000 ORIOLE CORPORATION Income Statement 2024 Percent BA 27 Amount $591,000 378 240 2023 - /20 Percent 96 %6 Jy Prepare a vertical analysis for Oriole Corporation. (Round percentage answers to 1 decimal place, e.g. 52.7%) Question 4 of 11 Cost of goods sold Gross profit Operating expenses Profit before income tax Income tax expense Profit for the year eTextbook and Media Save for Later Amount $831,000 149,580 124.650 31,163 $93,487 ORIOLE CORPORATION Income Statement 2024 Percent * %6 X Amount $591,000 378,240 212,760 101,280 111,480 27,870 $83,610 Percent Attempts: 0 of 3 used / 20 E E: Submit Answer Current Attempt in Progress Selected data (in thousands) from the income statement of Sunland Inc. are shown below. Net sales Cost of goods sold Gross profit Operating expenses Profit before income tax Income tax expense Profit for the year Net sales Cost of goods sold Perform a vertical analysis and calculate the percentage of the base amount for the current year. (Enter amounts in thousands. Round percentage answers to 1 decimal place, e.g. 52.7%.) Gross profit $1,930 1,615 Operating expenses 209 S A Amount Income Statement Percent X Profit for the year Perform a vertical analysis and calculate the percentage of the base amount for the current year. (Enter amounts in thousands. Round percentage answers to 1 decimal place, e.g. 52.7%) Net sales Cost of goods sold Gross profit Operating expenses Profit before income tax Income tax expense Profit for the year e Textbook and Media seve for Later $ Amount A Income Statement Percent Attempts: 0 of 3 used Submit Answer Sheridan Inc. operates gaming stores across the country. Selected comparative financial statement data are shown below. Current assets SHERIDAN ING. Balance Sheet (partial) December 31 (in millions) Short-term investments Accounts receivable Inventory Prepaid expenses Total current assets Total current liabilities Additional information: (In millions) Net credit sales Cost of goods sold & $2,389 $1,885 $1,301 $1,196 $750 2023 & $8,258 $3,936 5,328 2,648 Additional information: (in millions) Net credit sales Cost of goods sold Current ratio A Calculate the following liquidity ratios for 2024 and 2023. (Round current ratio and acid-test ratio to 2 decimal places, eg 0.75.1. receivables turnover and inventory turnover to 1 decimal place, eg, 527 and collection period, days sales in inventory and operating cycle to 0 decimal places, e.g. 125.) Acid-test ratio Receivables turnover Collection period Inventory turnover Days sales in inventory $8,258 5,328 Operating cycle $3,936 2,648 times days times days days times days days eTextbook and Media Indicate whether each of the liquidity ratios calculated in part (a) is better or worse in 2024. Current ratio Acid-test ratio Receivables turnover Collection period Inventory turnover Days sales in inventory Operating cycle e Textbook and Media Save for Later Attempts: 0 of 3 used Submit Answer Question 7 of 11 View Policies Current Attempt in Progress For each of the following liquidity ratios, indicate whether the change would be viewed as an improvement or deterioration: @ @ @ A decrease in the receivables turnover (6) A decrease in the collection period An increase in the days sales in inventory An increase in the inventory turnover (e) A decrease in the acid-test ratio An increase in the operating cycle eTextbook and Media Some for Late Attempts: 0 of 3 used PUTIN # Question 8 of 11 View Policies Current Attempt in Progress The following selected information (in thousands) is available for Ivanhoe Inc.. Total assets Total liabilities Interest expense Income tax expense Profit for the year Cash provided by operating activities Cash used by investing activities A Debt to total assets Free cash flow $3,885 61 2,200 481 Calculate the following solvency ratios of Ivanhoe Inc. for 2024 and 2023. (Round debt to total assets and interest coverage answers to 1 decimal place, eg. 52.7 or 52.7%. Enter amounts in thousands.) 1,970 2024 LA 2023 -/5 B 96 MIMIN Question 8 of 11 Calculate the following solvency ratios of Ivanhoe Inc. for 2024 and 2023. (Round debt to total assets and interest coverage answers to 1 decimal place, e.g. 52.7 or 52.7%. Enter amounts in thousands.) Debt to total assets Free cash flow Interest coverage eTextbook and Media Debt to total assets 5 Free cash flow 4 Interest coverage Indicate whether each of the solvency ratios calculated in part (a) is better or worse in 2024. 2024 e Textbook and Media times $ -75 : times 66 Question 9 of 11 View Policies Current Attempt in Progress Net sales Selected comparative statement data for Ivanhoe Corporation are presented below. All balance sheet data are as at December 31 Profit for the year K Total assets Asset turnover 615,000 Total common shareholders' equity 480,000 2024 eTextbook and Media $720,000 Return on assets 86,000 2023 $700,000 Calculate asset turnover for 2024. (Round answer to 1 decimal place, e.g. 12.5.) 76,000 515,000 340,000 times Calculate return on assets for 2024. (Round answer to 1 decimal place, e.g. 12.5.) 196 5 CON A Question 9 of 11 FI eTextbook and Media Calculate return on assets for 2024. (Round answer to 1 decimal place, e.g. 12.5.) Return on assets e Textbook and Media Calculate return on equity for 2024. (Round answer to 1 decimal place, e.g. 125.) Return on equity UNS eTextbook and Media Sevel for LaRE. Attempts: 0 of 3 used 2 Submit Answer View Policies Current Attempt in Progress Canada Goose Holdings Inc. reported the following items in its consolidated statement of earnings (in millions of dollars) for 2020 and 2019. Revenue Cost of goods sold Net income 2020 2019 Calculate the gross profit margin. (Round answers to 1 decimal place, e.g. 52.7%) $8.30.5 Gross Profit Margin e Textbook and Media Calculate the profit margin. (Round answers to 2 decimal places, e.g. 52.75%) Question 10 of 11 Calculate the gross profit margin. (Round answers to 1 decimal place, eg. 52.7%) Gross Profit Margin e Textbook and Media Calculate the profit margin. (Round answers to 2 decimal places, e.g. 52.75%) Save for Laser Profit Margin eTextbook and Media A Attempts: 0 of 3 used E Submit Answer Question 11 of 11 View Policies Inventory turnover A eTextbook and Media Current Attempt in Progress Sandhill Corporation and Indigo Inc. have similar types of inventory. At the end of the current year, Sandhill reported an average inventory amount of $12,000, calculated using the FIFO cost formula. Indigo reported an average inventory amount of $13,120, calculated using the average cost formula. Sandhill reported cost of goods sold of $240,000, while Indigo reported cost of goods sold of $144,320. Inventory prices have been falling during the current year. (a) Calculate the inventory turnover ratio for each company. Sandhill Corporation times -75 Indigo Inc. E Attempts: 0 of 3 used MIMIN Question 1 of 11 View Policies Current Attempt in Progress Select the appropriate description for the following terms. 4 Intracompan Intercompany Horizontal analysis Vertical analysis Ratio analysis e Textbook and Media Save fenten Description Attempts: 0 of 3 used MEDEN Question 2 of 11 Comparative data (in thousands) from the balance sheet of Blossom Ltd. are shown below. Accounts receivable Inventory Prepaid expenses Total current assets Accounts receivable Inventory Prepaid expenses 500 current assets 245 $636 Using horizontal analysis, calculate the percent of base year, assuming 2021 is the base year. (Round answers to 0 decimal places, e.g. 158 21 X -/10 5 96 MAN Question 4 of 11 View Policies Net sales Current Attempt in Progress Comparative data from the income statement of Oriole Corporation are shown below. Cost of goods sold Gross profit < Operating expenses Profit before income tax Income tax expense Profit for the year Jury 41315 2024 $831,000 $591,000 556,770 378,240 149,580 124,650 31,163 $93,487 Prepare a vertical analysis for Oriole Corporation. (Round percentage answers to 1 decimal place, e.g. 52.7%) 212,760 101,280 111,480 27,870 $83,610 Amount $831,000 ORIOLE CORPORATION Income Statement 2024 Percent BA 27 Amount $591,000 378 240 2023 - /20 Percent 96 %6 Jy Prepare a vertical analysis for Oriole Corporation. (Round percentage answers to 1 decimal place, e.g. 52.7%) Question 4 of 11 Cost of goods sold Gross profit Operating expenses Profit before income tax Income tax expense Profit for the year eTextbook and Media Save for Later Amount $831,000 149,580 124.650 31,163 $93,487 ORIOLE CORPORATION Income Statement 2024 Percent * %6 X Amount $591,000 378,240 212,760 101,280 111,480 27,870 $83,610 Percent Attempts: 0 of 3 used / 20 E E: Submit Answer Current Attempt in Progress Selected data (in thousands) from the income statement of Sunland Inc. are shown below. Net sales Cost of goods sold Gross profit Operating expenses Profit before income tax Income tax expense Profit for the year Net sales Cost of goods sold Perform a vertical analysis and calculate the percentage of the base amount for the current year. (Enter amounts in thousands. Round percentage answers to 1 decimal place, e.g. 52.7%.) Gross profit $1,930 1,615 Operating expenses 209 S A Amount Income Statement Percent X Profit for the year Perform a vertical analysis and calculate the percentage of the base amount for the current year. (Enter amounts in thousands. Round percentage answers to 1 decimal place, e.g. 52.7%) Net sales Cost of goods sold Gross profit Operating expenses Profit before income tax Income tax expense Profit for the year e Textbook and Media seve for Later $ Amount A Income Statement Percent Attempts: 0 of 3 used Submit Answer Sheridan Inc. operates gaming stores across the country. Selected comparative financial statement data are shown below. Current assets SHERIDAN ING. Balance Sheet (partial) December 31 (in millions) Short-term investments Accounts receivable Inventory Prepaid expenses Total current assets Total current liabilities Additional information: (In millions) Net credit sales Cost of goods sold & $2,389 $1,885 $1,301 $1,196 $750 2023 & $8,258 $3,936 5,328 2,648 Additional information: (in millions) Net credit sales Cost of goods sold Current ratio A Calculate the following liquidity ratios for 2024 and 2023. (Round current ratio and acid-test ratio to 2 decimal places, eg 0.75.1. receivables turnover and inventory turnover to 1 decimal place, eg, 527 and collection period, days sales in inventory and operating cycle to 0 decimal places, e.g. 125.) Acid-test ratio Receivables turnover Collection period Inventory turnover Days sales in inventory $8,258 5,328 Operating cycle $3,936 2,648 times days times days days times days days eTextbook and Media Indicate whether each of the liquidity ratios calculated in part (a) is better or worse in 2024. Current ratio Acid-test ratio Receivables turnover Collection period Inventory turnover Days sales in inventory Operating cycle e Textbook and Media Save for Later Attempts: 0 of 3 used Submit Answer Question 7 of 11 View Policies Current Attempt in Progress For each of the following liquidity ratios, indicate whether the change would be viewed as an improvement or deterioration: @ @ @ A decrease in the receivables turnover (6) A decrease in the collection period An increase in the days sales in inventory An increase in the inventory turnover (e) A decrease in the acid-test ratio An increase in the operating cycle eTextbook and Media Some for Late Attempts: 0 of 3 used PUTIN # Question 8 of 11 View Policies Current Attempt in Progress The following selected information (in thousands) is available for Ivanhoe Inc.. Total assets Total liabilities Interest expense Income tax expense Profit for the year Cash provided by operating activities Cash used by investing activities A Debt to total assets Free cash flow $3,885 61 2,200 481 Calculate the following solvency ratios of Ivanhoe Inc. for 2024 and 2023. (Round debt to total assets and interest coverage answers to 1 decimal place, eg. 52.7 or 52.7%. Enter amounts in thousands.) 1,970 2024 LA 2023 -/5 B 96 MIMIN Question 8 of 11 Calculate the following solvency ratios of Ivanhoe Inc. for 2024 and 2023. (Round debt to total assets and interest coverage answers to 1 decimal place, e.g. 52.7 or 52.7%. Enter amounts in thousands.) Debt to total assets Free cash flow Interest coverage eTextbook and Media Debt to total assets 5 Free cash flow 4 Interest coverage Indicate whether each of the solvency ratios calculated in part (a) is better or worse in 2024. 2024 e Textbook and Media times $ -75 : times 66 Question 9 of 11 View Policies Current Attempt in Progress Net sales Selected comparative statement data for Ivanhoe Corporation are presented below. All balance sheet data are as at December 31 Profit for the year K Total assets Asset turnover 615,000 Total common shareholders' equity 480,000 2024 eTextbook and Media $720,000 Return on assets 86,000 2023 $700,000 Calculate asset turnover for 2024. (Round answer to 1 decimal place, e.g. 12.5.) 76,000 515,000 340,000 times Calculate return on assets for 2024. (Round answer to 1 decimal place, e.g. 12.5.) 196 5 CON A Question 9 of 11 FI eTextbook and Media Calculate return on assets for 2024. (Round answer to 1 decimal place, e.g. 12.5.) Return on assets e Textbook and Media Calculate return on equity for 2024. (Round answer to 1 decimal place, e.g. 125.) Return on equity UNS eTextbook and Media Sevel for LaRE. Attempts: 0 of 3 used 2 Submit Answer View Policies Current Attempt in Progress Canada Goose Holdings Inc. reported the following items in its consolidated statement of earnings (in millions of dollars) for 2020 and 2019. Revenue Cost of goods sold Net income 2020 2019 Calculate the gross profit margin. (Round answers to 1 decimal place, e.g. 52.7%) $8.30.5 Gross Profit Margin e Textbook and Media Calculate the profit margin. (Round answers to 2 decimal places, e.g. 52.75%) Question 10 of 11 Calculate the gross profit margin. (Round answers to 1 decimal place, eg. 52.7%) Gross Profit Margin e Textbook and Media Calculate the profit margin. (Round answers to 2 decimal places, e.g. 52.75%) Save for Laser Profit Margin eTextbook and Media A Attempts: 0 of 3 used E Submit Answer Question 11 of 11 View Policies Inventory turnover A eTextbook and Media Current Attempt in Progress Sandhill Corporation and Indigo Inc. have similar types of inventory. At the end of the current year, Sandhill reported an average inventory amount of $12,000, calculated using the FIFO cost formula. Indigo reported an average inventory amount of $13,120, calculated using the average cost formula. Sandhill reported cost of goods sold of $240,000, while Indigo reported cost of goods sold of $144,320. Inventory prices have been falling during the current year. (a) Calculate the inventory turnover ratio for each company. Sandhill Corporation times -75 Indigo Inc. E Attempts: 0 of 3 used MIMIN
Expert Answer:
Answer rating: 100% (QA)
Answer Question 1 Here are the appropriate descriptions for the terms Terms Description Intracompany Analysis conducted within a single company comparing financial data over time to assess performance ... View the full answer

Related Book For 
Posted Date:
Students also viewed these finance questions
-
We consider an example that applies to individuals and ourselves and companies. We assume that we are the owners of the property. This can be our main residence, a rental property we buy, or a...
-
It is generally agreed that the maximum packet lifetime on the Internet is roughly 2 minutes; i.e., either the packet arrives at the destination before that, or the TTL will have killed the packet by...
-
Simplify the following Boolean expressions to a minimum number of literals: Question Example 1. Any Boolean function that has 2 inputs and at least 2 terms. F(x,y) = xy+x'y 2. Any Boolean function...
-
How do digital media change how we relate to others?
-
Use the data in Problem and Case 2.12. In problem Required: (a) Prepare a calculation to prove the net loss on the sale of the truck. (b) Prepare the cash flow from investing activities section of...
-
Presented here is information for Eliason, Inc., for the year ended August 31, 2016. Requirements 1. What is the beginning stockholders' equity of Eliason, Inc.? 2. What is the ending stockholders'...
-
Use Fleury's algorithm to construct an Euler trail for the given graph beginning at vertex \(f\) of your choice. a d a 6 b
-
Alice has invented a new card game to play with Bob. Alice made a deck of cards with random values between 1 and 52. Bob picks 5 cards. Then, he has to rearrange the cards so that by utilizing the...
-
Required: Gleason Guitars produces acoustic guitars. The table below contains budget and actual information for the month of June: Note: Indicate the effect of each variance by selecting " F " for...
-
In Problem 5-8, suppose that the daily demand at area 3 drops to 4 million gallons. Surplus production at refineries 1 and 2 is diverted to other distribution areas by truck. The transportation cost...
-
In this assignment, students will conduct in-depth research on three leading anti-malware programs currently available in the market. The primary focus is to compare and contrast the features,...
-
Explain why internal auditors, rather than executive management, operating management, or the systems and procedures people, should follow up on corrective action.
-
Why must action be taken on a deficiency but not necessarily on a suggestion for improvement?
-
Why is the assumption of constant column pressure often reasonable for columns at atmospheric pressure and above, but often not reasonable for vacuum columns?
-
Explain the reasons a constant pressure distillation column is preferable to a. An isothermal distillation system. b. A cascade of flash separators at constant temperature. c. A cascade of flash...
-
The Wankel Publishing Company is planning to start a new magazine devoted to girls high school basketball. The company has the following information. According to census data, one of the states where...
-
A company's maintenance department painted its tennis ball department, the racquet ball department, and its own department. The maintenance department uses square feet as its cost driver. The...
-
What are some of the features of the Unified Process (UP)?
-
Harris Foods had the following independent situations. 1. A court recently found Harris liable for $400,000 in damages due to faulty coatings on paper plates it manufactures. Because Harris plans to...
-
1. Horizontal analysis of accounts receivable: a. calculates accounts receivable as a percentage of total assets. b. highlights the change in accounts receivable as a percentage of the prior year's...
-
Tanner Toys had sales of $2,500,000 during 2012. In 2011, 5% of sales were returned for a refund, but Tanner believes that recent product changes will reduce warranty expense to about 3% of 2012...
-
Refer to the annual report of CVS Corporation and the financial statements of Southwest Airlines Co. in the Supplement to Chapter 1. Prepare a table for the following key financial performance...
-
Ratio analysis enables one to compare the performance of companies whose financial statements are presented in different currencies. Selected data from 2004 for two large pharmaceutical companiesone...
-
Murray Corporation began investing in trading securities in 20x6. At the end of 20x6, it had the following trading portfolio: Prepare the necessary year-end adjusting entry on December 31 and the...

Study smarter with the SolutionInn App