

Question 5 (45 points, solve questions with Excel and then submit your file via Brightspace) The...
Fantastic news! We've Found the answer you've been seeking!
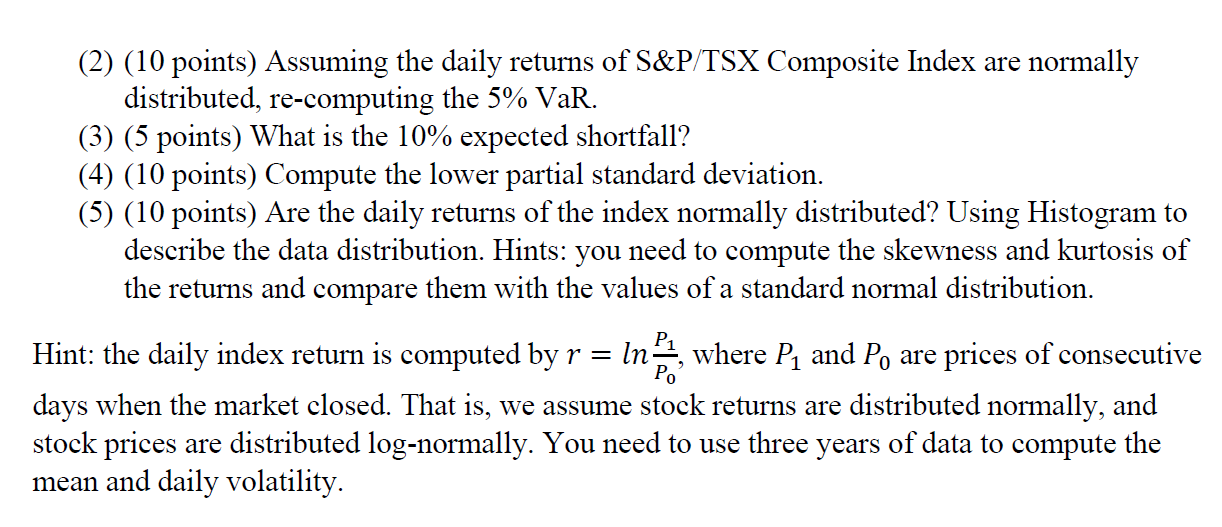
Question:

Transcribed Image Text:
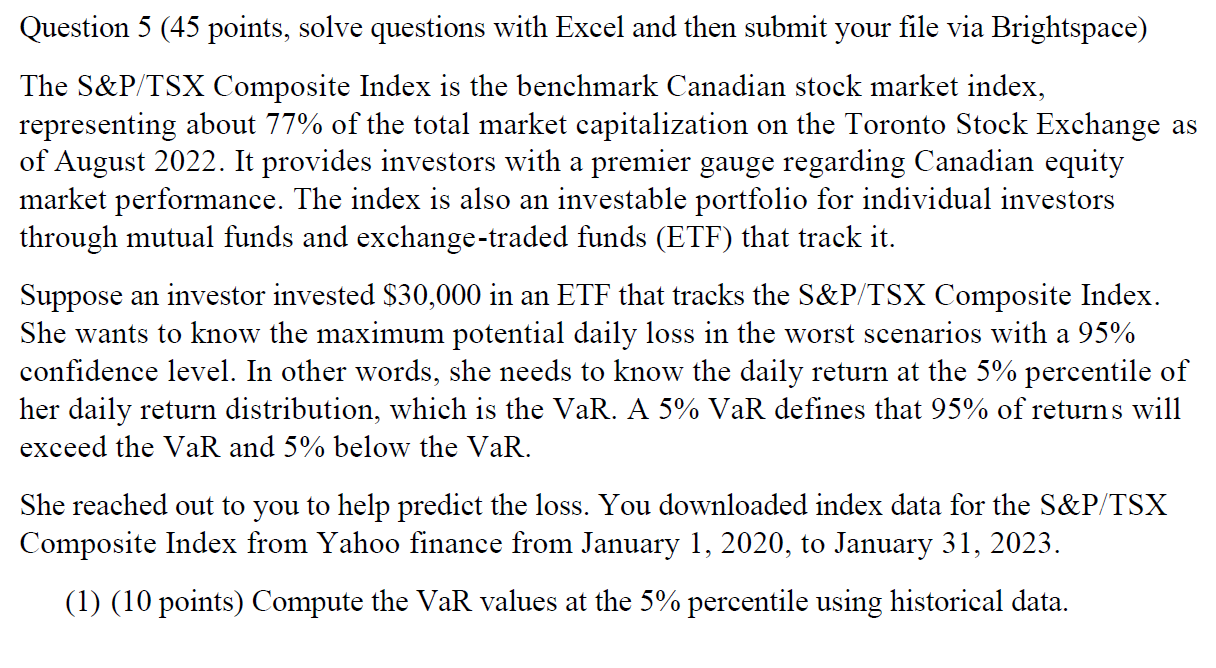
Question 5 (45 points, solve questions with Excel and then submit your file via Brightspace) The S&P/TSX Composite Index is the benchmark Canadian stock market index, representing about 77% of the total market capitalization on the Toronto Stock Exchange as of August 2022. It provides investors with a premier gauge regarding Canadian equity market performance. The index is also an investable portfolio for individual investors through mutual funds and exchange-traded funds (ETF) that track it. Suppose an investor invested $30,000 in an ETF that tracks the S&P/TSX Composite Index. She wants to know the maximum potential daily loss in the worst scenarios with a 95% confidence level. In other words, she needs to know the daily return at the 5% percentile of her daily return distribution, which is the VaR. A 5% VaR defines that 95% of returns will exceed the VaR and 5% below the VaR. She reached out to you to help predict the loss. You downloaded index data for the S&P/TSX Composite Index from Yahoo finance from January 1, 2020, to January 31, 2023. (1) (10 points) Compute the VaR values at the 5% percentile using historical data. (2) (10 points) Assuming the daily returns of S&P/TSX Composite Index are normally distributed, re-computing the 5% VaR. (3) (5 points) What is the 10% expected shortfall? (4) (10 points) Compute the lower partial standard deviation. (5) (10 points) Are the daily returns of the index normally distributed? Using Histogram to describe the data distribution. Hints: you need to compute the skewness and kurtosis of the returns and compare them with the values of a standard normal distribution. Hint: the daily index return is computed by r = In, where P and Po are prices of consecutive Po days when the market closed. That is, we assume stock returns are distributed normally, and stock prices are distributed log-normally. You need to use three years of data to compute the mean and daily volatility. 1 2 3 4 5 6 7 8 9 10 11 12 13 14 15 16 17 18 19 20 21 22 2222782 23 24 25 26 29 Date A B Open High 17100 17100 17033.2 17066.1 17066.1 17041.2 17105.5 17105.5 17110.3 17168.1 17168.1 02/01/2020 17131.6 17164.6 17043.5 03/01/2020 17054.8 17105.7 06/01/2020 17042.3 17105.5 07/01/2020 17119.6 17178 08/01/2020 17172.7 17229.9 17164.6 17167.8 17167.8 09/01/2020 17205.9 17255.5 17201.3 17235.6 17235.6 10/01/2020 17223.2 17254.1 17187.2 17234.5 17234.5 13/01/2020 17237.6 17301.8 17198.9 17293.4 17293.4 14/01/2020 17288.6 17356.5 17281.3 17352.9 17352.9 17364.8 17421.7 17345.1 17415.2 17415.2 17443.5 17489.6 17438.5 17484.8 17484.8 17502.4 17559 17559 15/01/2020 16/01/2020 17/01/2020 17507.7 20/01/2020 17548.1 17572.2 17620.2 17538.4 17597.4 17597.4 21/01/2020 17551.5 17572.3 17572.3 17589.5 17536.3 17666.5 22/01/2020 17570.3 17558 17599.9 17599.9 23/01/2020 17564.8 17621.8 17540.8 17621.8 17621.8 24/01/2020 17629.4 17646.4 17514.7 17565.3 17565.3 27/01/2020 17376.8 17466.1 17360 17442.5 17442.5 28/01/2020 17475 17519 17500.9 17500.9 17456.1 17496.7 17511.8 17511.8 29/01/2020 17547.5 17561.9 30/01/2020 17429.6 17502.9 17395.9 17490.6 17490.6 17442.3 17450.7 17272.7 17318.5 17318.5 17441.6 17351 17379.8 17379.8 04/02/2020 17548.8 17493.8 17512.7 17512.7 31/01/2020 03/02/2020 17351 17504.6 05/02/2020 17629.4 17674 17606.1 17651.6 17651.6 06/02/2020 17686.1 17758.5 17670.6 17757.5 17757.5 07/02/2020 17705.4 17716.7 17633 17655.5 10/02/2020 17646.6 17743.6 17646.6 17740.6 17740.6 17655.5 ^GSPTSE (1) Low D E Close F Adj Close Volume G 156213500 185492100 195351800 171935800 246980100 222501200 192514100 268086800 235495600 207645200 261420600 224673300 111821100 241563100 213329700 330914300 193689100 203774000 198139800 169412800 191070300 239157000 196331500 235045300 223399700 199327500 209827800 210735600 H Question 5 (45 points, solve questions with Excel and then submit your file via Brightspace) The S&P/TSX Composite Index is the benchmark Canadian stock market index, representing about 77% of the total market capitalization on the Toronto Stock Exchange as of August 2022. It provides investors with a premier gauge regarding Canadian equity market performance. The index is also an investable portfolio for individual investors through mutual funds and exchange-traded funds (ETF) that track it. Suppose an investor invested $30,000 in an ETF that tracks the S&P/TSX Composite Index. She wants to know the maximum potential daily loss in the worst scenarios with a 95% confidence level. In other words, she needs to know the daily return at the 5% percentile of her daily return distribution, which is the VaR. A 5% VaR defines that 95% of returns will exceed the VaR and 5% below the VaR. She reached out to you to help predict the loss. You downloaded index data for the S&P/TSX Composite Index from Yahoo finance from January 1, 2020, to January 31, 2023. (1) (10 points) Compute the VaR values at the 5% percentile using historical data. (2) (10 points) Assuming the daily returns of S&P/TSX Composite Index are normally distributed, re-computing the 5% VaR. (3) (5 points) What is the 10% expected shortfall? (4) (10 points) Compute the lower partial standard deviation. (5) (10 points) Are the daily returns of the index normally distributed? Using Histogram to describe the data distribution. Hints: you need to compute the skewness and kurtosis of the returns and compare them with the values of a standard normal distribution. Hint: the daily index return is computed by r = In, where P and Po are prices of consecutive Po days when the market closed. That is, we assume stock returns are distributed normally, and stock prices are distributed log-normally. You need to use three years of data to compute the mean and daily volatility. 1 2 3 4 5 6 7 8 9 10 11 12 13 14 15 16 17 18 19 20 21 22 2222782 23 24 25 26 29 Date A B Open High 17100 17100 17033.2 17066.1 17066.1 17041.2 17105.5 17105.5 17110.3 17168.1 17168.1 02/01/2020 17131.6 17164.6 17043.5 03/01/2020 17054.8 17105.7 06/01/2020 17042.3 17105.5 07/01/2020 17119.6 17178 08/01/2020 17172.7 17229.9 17164.6 17167.8 17167.8 09/01/2020 17205.9 17255.5 17201.3 17235.6 17235.6 10/01/2020 17223.2 17254.1 17187.2 17234.5 17234.5 13/01/2020 17237.6 17301.8 17198.9 17293.4 17293.4 14/01/2020 17288.6 17356.5 17281.3 17352.9 17352.9 17364.8 17421.7 17345.1 17415.2 17415.2 17443.5 17489.6 17438.5 17484.8 17484.8 17502.4 17559 17559 15/01/2020 16/01/2020 17/01/2020 17507.7 20/01/2020 17548.1 17572.2 17620.2 17538.4 17597.4 17597.4 21/01/2020 17551.5 17572.3 17572.3 17589.5 17536.3 17666.5 22/01/2020 17570.3 17558 17599.9 17599.9 23/01/2020 17564.8 17621.8 17540.8 17621.8 17621.8 24/01/2020 17629.4 17646.4 17514.7 17565.3 17565.3 27/01/2020 17376.8 17466.1 17360 17442.5 17442.5 28/01/2020 17475 17519 17500.9 17500.9 17456.1 17496.7 17511.8 17511.8 29/01/2020 17547.5 17561.9 30/01/2020 17429.6 17502.9 17395.9 17490.6 17490.6 17442.3 17450.7 17272.7 17318.5 17318.5 17441.6 17351 17379.8 17379.8 04/02/2020 17548.8 17493.8 17512.7 17512.7 31/01/2020 03/02/2020 17351 17504.6 05/02/2020 17629.4 17674 17606.1 17651.6 17651.6 06/02/2020 17686.1 17758.5 17670.6 17757.5 17757.5 07/02/2020 17705.4 17716.7 17633 17655.5 10/02/2020 17646.6 17743.6 17646.6 17740.6 17740.6 17655.5 ^GSPTSE (1) Low D E Close F Adj Close Volume G 156213500 185492100 195351800 171935800 246980100 222501200 192514100 268086800 235495600 207645200 261420600 224673300 111821100 241563100 213329700 330914300 193689100 203774000 198139800 169412800 191070300 239157000 196331500 235045300 223399700 199327500 209827800 210735600 H
Expert Answer:
Answer rating: 100% (QA)
To compute the Value at Risk VaR at the 5 percentile using historical data you would follow these st... View the full answer

Related Book For 

Data Analysis and Decision Making
ISBN: 978-0538476126
4th edition
Authors: Christian Albright, Wayne Winston, Christopher Zappe
Posted Date:
Students also viewed these accounting questions
-
Susan Norman seeks your financial advice. She wants to know how long it will take for her to become a millionaire. She tells you that she has $1,330 today and wants to invest it in an aggressive...
-
Jannie is your first client. She wants to know about some tax-related provisions and practices. She asks some questions - what are the legal provision related to Taxable income, Medicare levy, and...
-
She wants to know the average performance score for entry level employees (job level 1) that work at the california location. Which formula should she use? Assume there that the dataset she is...
-
You want to short a 6-month forward contract on a stock. You contacted your bank and were offered a forward price of $39.85 [Note: This forward price is available only to customers who want to take a...
-
The top surface of a plate, including its grooves, is maintained at a uniform temperature of T, = 200C. The lower surface is at T2 = 20C, the thermal conductivity is 15 W/m K, and the groove spacing...
-
What is an annuity? How is it defined? What is the difference between an ordinary annuity and an annuity due?
-
The primary goal of financial management should be to: a. Maximize the owner's equity account on the balance sheet. b. Maximize the number of shares of stock. c. Maximize firm profit. d. None of the...
-
The Web sites for Lenovo (China; www.lenovo.com), Nokia (Finland; www.nokia.com ), and Banco do Brasil (Brazil; www.bb.com.br, click on English) contain substantial information about how these firms...
-
Using the financial data provided for McDonald's Corporation, calculate the following tax-related figures: Item Amount (in millions) Total Income Before Taxes $10,000 Total Income Tax Expense $2,500...
-
1. What is the cost of debt for Sunrise Bakery? 2. What is their cost of equity? 3. What is the WACC? 4. Which cost of capital should be used to evaluate the feasibility of the oven purchase? 5....
-
OA pr ON OC D OL QUESTION 40 New Owls - growth in gestionable; ma result, the company expects to pay annual dividends of 50.55, 50.8, and a liquidating dividend of $1.1 per share, respectively e next...
-
1. Each day, the number of customers who come to the Bookstore is approximately Poi(11). Approxi- mate the probability that, after the quarter ends (9 7 = 63 days), that we had over 700 customers.
-
1. Simba Company manufactures two paint products: Paint A and Paint B. The company uses the same processing equipment to product both products. Between batches, the processing equipment must be...
-
Peppers Lockdown produces keys for homes and cars. As Peppers planned for next year's production, the company decided to implement a high-low system to forecast future costs. With total production of...
-
John and Sarah are in a history class. At the end of the semester, after 5 exams, Josh has a mean of 50 and standard deviation of 10 for exams. Sarah has a mean of 50 and a standard deviation of 3...
-
Troy Instruments uses ten units of Part Number S1798 each month in the production of scientific equipment. The unit cost to manufacturing one unit of S1798 is presented below. Directmaterials$4,000...
-
3. The DE partnership is equally owned by Diane and Emily. Diane's fiscal year ends on March 31, and Emily's fiscal year ends on August 31. (5 points) a) Please name or describe the three tests/tiers...
-
A sprinkler head malfunctions at midfield in an NFL football field. The puddle of water forms a circular pattern around the sprinkler head with a radius in yards that grows as a function of time, in...
-
In the Great Threads model, the production quantities in row 16 were not constrained to be integers. Presumably, any fractional values could be safely rounded to integers. See whether this is true....
-
The lifetime of a certain manufacturers washing machine is normally distributed with mean 4 years. Only 15% of all these washing machines last at least 5 years. What is the standard deviation of the...
-
Use @RISK to draw a uniform distribution from 400 to 750. Then answer the following questions. a. What are the mean and standard deviation of this distribution? b. What are the 5th and 95th...
-
The following information is provided for Shaq Co. for the new product it recently introduced. Total unit cost \($30\) Desired ROI per unit \($10\) Target selling price \($40\) What would be Shaq...
-
Sprague Company is considering developing a new product. The company has gathered the following information on this product. Expected total unit cost Estimated investment for new product Desired ROI...
-
Bristle Brush Company operates in a state where corporate taxes and workers' compensation insurance rates have recently doubled. Bristle's president has just assigned you the task of preparing an...

Study smarter with the SolutionInn App