

Excel has significant capabilities including the statistical analysis of data. The purpose of this assignment is...
Fantastic news! We've Found the answer you've been seeking!
Question:
Transcribed Image Text:
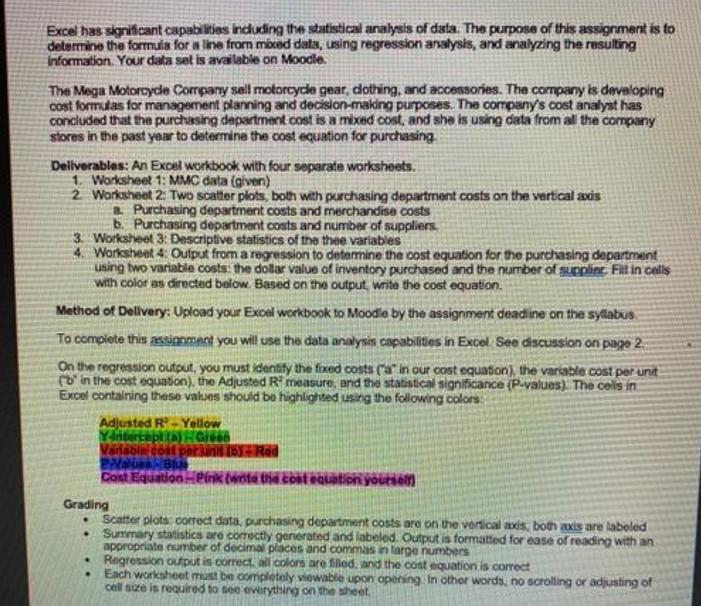
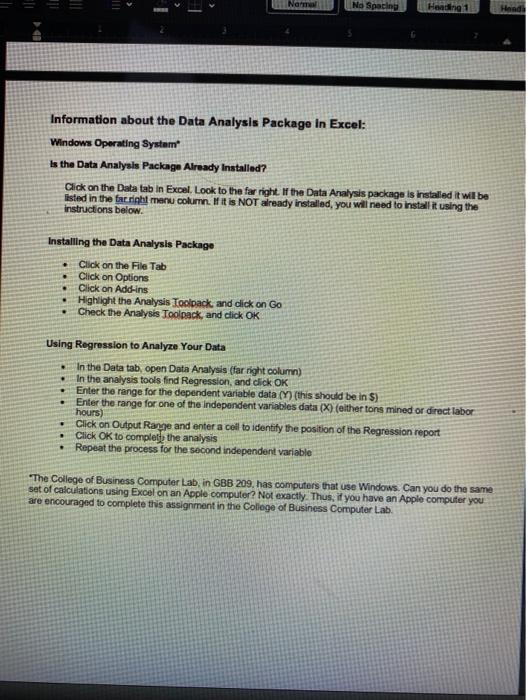
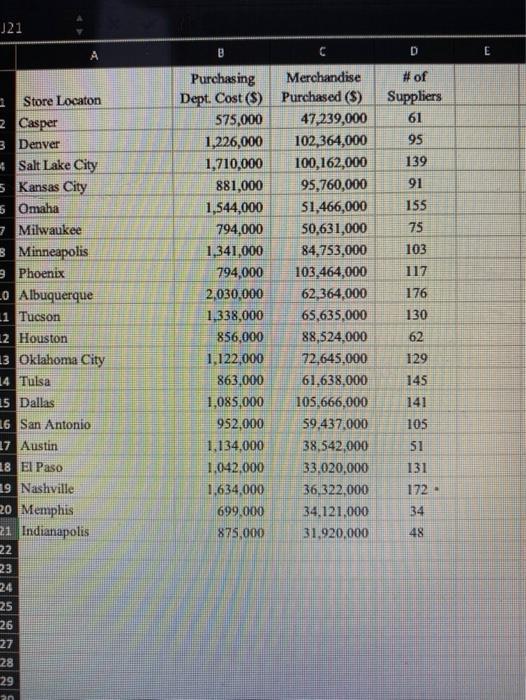
Excel has significant capabilities including the statistical analysis of data. The purpose of this assignment is to determine the formula for a line from mixad data, using regression analysis, and analyzing the resulting information. Your data set is available on Moodle. The Mega Motorcyde Cormpany sell motorcycle gear, dothing, and accessories. The company is developing cost formulas for management planning and decision-making purposes. The company's cost analyst has concluded that the purchasing department cost is a mixed cost, and she is using data from all the company stores in the past year to determine the cost equation for purchasing Deliverables: An Excel workbook with four separate worksheets. 1. Worksheet 1: MMC data (given) 2 Worksheet 2: Two scatter plots, both with purchasing department costs on the vertical axis a Purchasing department costs and merchandise costs b. Purchasing department costs and number of suppliers 3. Worksheet 3: Descriptive statistics of the thee variables Worksheet 4: Output from a regression to determine the cost equation for the purchasing department using two variable costs: the dollar value of inventory purchased and the number of supplinr. Fit in cells with color as directed below. Based on the output, write the cost equation. Method of Delivery: Upload your Excel workbook to Moodle by the assignment deadine on the syllabus To complete this assignment you will use the data analysis capabilities in Excel See discussion on page 2. On the regression output, you must identify the fixed costs (a" in our cost equation), the variable cost per unit (b in the cost equation), the Adjusted R measure, and the statistical significance (P-values) The cells in Excel containing these values should be highlighted using the following colors Adjusted R-Yellow Vaifablni cont phrkin 16)Rød Cost Equationeink (wite the costeqiation yoursel Grading Scatter plots correct data, purchasing department costs are on the vertical ais, both axis are laboled • Sumenary statistics are correctly generated and labeled. Output is formatted for ease of reading with an appropriate number of decimal places and commas in large numbers Regression output is correct, all colors are filled, and the cost equation is correct Each worksheet must be completely viewable upon opening In other words, no scrolling or adjusting of cell size is reQuired to see everything on the sheet. Nerma No Spacing Heading 1 Information about the Data Analysis Package in Excel: Windows Operating Systam is the Data Analysis Package Already Installed? Click on the Data tab in Excel. Look to the far right If the Data Analysis package is installed it will be isted in the farright menu column. If it is NOT already installed, you will need to install it using the instructions below. Installing the Data Analysis Package • Click on the File Tab Click on Options Click on Add-ins • Highlight the Analysis Toolpack, and dlick on Go Check the Analysis Toolpack, and click OK Using Regression to Analyze Your Data In the Data tab, open Data Analysis (far right column) In the analysis tools find Regression, and cick OK Enter the range for the dependent variable data (Y) (this should be in $) .Enter the range for one of the independent variables data (X) (elther tons mined or direct labor hours) Click on Output Range and enter a cell to identify the position of the Regression report Click OK to complett the analysis • Repeat the process for the second independent variable The College of Business Computer Lab, in GBB 209, has computers that use Windows. Can you do the same set of calculations using Excel on an Apple computer? Not exactly. Thus, if you have an Apple computer you are encouraged to complete this assignment in the College of Business Computer Lab. 121 A # of Suppliers Purchas ing Dept. Cost ($) Purchased ($) 575,000 1,226,000 1,710,000 Merchandise a Store Locaton 47,239,000 61 2 Casper 3 Denver 4Salt Lake City 5 Kansas City 5 Omaha Milwaukee 102,364,000 95 100,162,000 139 95,760,000 51,466,000 881,000 91 155 1,544,000 794,000 1,341,000 794,000 50,631,000 75 8 Minneapolis 9 Phoenix 84,753,000 103 103,464,000 117 LO Albuquerque 1 Tucson 2,030,000 62,364,000 176 1,338,000 65,635,000 130 2 Houston 13 Oklahoma City 856,000 88,524,000 62 1,122,000 72,645,000 129 14 Tulsa 5 Dallas 863,000 61,638,000 145 1,085,000 105,666,000 59,437,000 141 16 San Antonio 17 Austin 18 El Paso 952,000 105 1.134,000 38,542,000 51 1,042,000 33,020,000 131 19 Nashville 20 Memphis 21 Indianapolis 1,634,000 699,000 36,322,000 172 - 34,121,000 34 875,000 31.920,000 48 22 23 24 25 26 27 28 29 Excel has significant capabilities including the statistical analysis of data. The purpose of this assignment is to determine the formula for a line from mixad data, using regression analysis, and analyzing the resulting information. Your data set is available on Moodle. The Mega Motorcyde Cormpany sell motorcycle gear, dothing, and accessories. The company is developing cost formulas for management planning and decision-making purposes. The company's cost analyst has concluded that the purchasing department cost is a mixed cost, and she is using data from all the company stores in the past year to determine the cost equation for purchasing Deliverables: An Excel workbook with four separate worksheets. 1. Worksheet 1: MMC data (given) 2 Worksheet 2: Two scatter plots, both with purchasing department costs on the vertical axis a Purchasing department costs and merchandise costs b. Purchasing department costs and number of suppliers 3. Worksheet 3: Descriptive statistics of the thee variables Worksheet 4: Output from a regression to determine the cost equation for the purchasing department using two variable costs: the dollar value of inventory purchased and the number of supplinr. Fit in cells with color as directed below. Based on the output, write the cost equation. Method of Delivery: Upload your Excel workbook to Moodle by the assignment deadine on the syllabus To complete this assignment you will use the data analysis capabilities in Excel See discussion on page 2. On the regression output, you must identify the fixed costs (a" in our cost equation), the variable cost per unit (b in the cost equation), the Adjusted R measure, and the statistical significance (P-values) The cells in Excel containing these values should be highlighted using the following colors Adjusted R-Yellow Vaifablni cont phrkin 16)Rød Cost Equationeink (wite the costeqiation yoursel Grading Scatter plots correct data, purchasing department costs are on the vertical ais, both axis are laboled • Sumenary statistics are correctly generated and labeled. Output is formatted for ease of reading with an appropriate number of decimal places and commas in large numbers Regression output is correct, all colors are filled, and the cost equation is correct Each worksheet must be completely viewable upon opening In other words, no scrolling or adjusting of cell size is reQuired to see everything on the sheet. Nerma No Spacing Heading 1 Information about the Data Analysis Package in Excel: Windows Operating Systam is the Data Analysis Package Already Installed? Click on the Data tab in Excel. Look to the far right If the Data Analysis package is installed it will be isted in the farright menu column. If it is NOT already installed, you will need to install it using the instructions below. Installing the Data Analysis Package • Click on the File Tab Click on Options Click on Add-ins • Highlight the Analysis Toolpack, and dlick on Go Check the Analysis Toolpack, and click OK Using Regression to Analyze Your Data In the Data tab, open Data Analysis (far right column) In the analysis tools find Regression, and cick OK Enter the range for the dependent variable data (Y) (this should be in $) .Enter the range for one of the independent variables data (X) (elther tons mined or direct labor hours) Click on Output Range and enter a cell to identify the position of the Regression report Click OK to complett the analysis • Repeat the process for the second independent variable The College of Business Computer Lab, in GBB 209, has computers that use Windows. Can you do the same set of calculations using Excel on an Apple computer? Not exactly. Thus, if you have an Apple computer you are encouraged to complete this assignment in the College of Business Computer Lab. 121 A # of Suppliers Purchas ing Dept. Cost ($) Purchased ($) 575,000 1,226,000 1,710,000 Merchandise a Store Locaton 47,239,000 61 2 Casper 3 Denver 4Salt Lake City 5 Kansas City 5 Omaha Milwaukee 102,364,000 95 100,162,000 139 95,760,000 51,466,000 881,000 91 155 1,544,000 794,000 1,341,000 794,000 50,631,000 75 8 Minneapolis 9 Phoenix 84,753,000 103 103,464,000 117 LO Albuquerque 1 Tucson 2,030,000 62,364,000 176 1,338,000 65,635,000 130 2 Houston 13 Oklahoma City 856,000 88,524,000 62 1,122,000 72,645,000 129 14 Tulsa 5 Dallas 863,000 61,638,000 145 1,085,000 105,666,000 59,437,000 141 16 San Antonio 17 Austin 18 El Paso 952,000 105 1.134,000 38,542,000 51 1,042,000 33,020,000 131 19 Nashville 20 Memphis 21 Indianapolis 1,634,000 699,000 36,322,000 172 - 34,121,000 34 875,000 31.920,000 48 22 23 24 25 26 27 28 29
Expert Answer:
Answer rating: 100% (QA)
MCC data Store Location Purchasing DeptCost Merchandise Purchased of Suppliers Casper 575000 4723900... View the full answer

Related Book For 

Business Statistics in Practice
ISBN: 978-0077404741
6th edition
Authors: Bruce Bowerman, Richard O'Connell
Posted Date:
Students also viewed these finance questions
-
Lina Aragon started a new business and completed the following transactions during December Dec I Lina transferred $65,000 cash from a personal savings account to a checking account in the name of...
-
Using the financial statement provided (an Excel spreadsheet with the data is available on Blackboard),. prepare a complete Statement of Cash Flows that shows both the direct method and the indirect...
-
The balance sheet for Zeta Corporation is shown below in market value terms. There are 1.000 shares outstanding. Market value balance sheet Cash 200 Equity 11000 Liabilities 11200 Total Non-current...
-
The bank portion of the bank reconciliation for Langer Company at November 30, 2017, was as follows. The bank statement contained two memoranda: 1. A credit of $5,285 for the collection of a $5,140...
-
A random sample of 50 units is drawn from a production process every half hour. The fraction of nonconforming product manufactured is 0.02. What is the probability that be p 0.04 if the fraction...
-
In Exercises find the derivative of the function. (x) = arcsec 2x
-
\(\frac{9}{\sqrt{35}}\) Rationalize the denominators of the fractions, and then simplify.
-
Hiatt Textile Corporation is planning to expand its current plant facilities and is in the process of obtaining a loan at City Bank. The bank has requested audited financial statements. Hiatt has...
-
Exercise 12-3 Make or Buy A Component Given: Climate-Control, Inc., manufactures a variety of heating and air conditioning units. The company is currently manufacturing all of its own component...
-
The Kreeger Grocery Store chain has bought out a competing grocery store chain. However, it now has too many stores in close proximity to each other in certain cities. In Roanoke the chain has 10...
-
Columbia LLC only purchased one asset this year. Columbia LLC was placed in service on July 9, 2021, with machinery (seven-year property) with a purchase cost of $2,650,000 and an installation cost...
-
Brockney Incorporated bases its manufacturing overhead budget on budgeted direct labor-hours. The variable overhead rate is $1.30 per direct labor-hour. The company's budgeted fixed manufacturing...
-
Given the function 2x+1 x < 2 f(x) = x+2 x 2 Calculate the following values: f(-3)= f(2) = f(4) = Sketch a graph of f(x).
-
Find lower and upper bounds for the area between the x-axis and the graph of f(x) = x + 3 over the interval [0, 2] by calculating left-endpoint and right-endpoint Riemann sums with 4 subintervals....
-
This lab practices with inheritance and function overriding by having you create characters from the game "Among Us". We provide a very basic gameplay in main.cc, and you do not need to edit this...
-
The following are historical demand data: ACTUAL YEAR 2011 SEASON DEMAND Spring 205 Summer 151 Fall 379 Winter 560 2012 Spring 481 Summer 268 Fall Winter 679 959 Use regression analysis on...
-
The audit report on the financial statements expresses an opinion on whether the financial statement present, in accordance with GAAP, the entity's: Multiple select question. internal controls....
-
Willingness to pay as a measure of a person's value for a particular good measures the maximum a person would be willing to pay requires that payment actually be made depends on the satisfaction that...
-
In the July 29, 2001 issue of the Journal News (Hamilton, Ohio), Lynn Elber of the Associated Press reported that "while 40 percent of American families own a television set with a V-chip installed...
-
Recall that in Exercise 10.32 (page 417) we compared preexposure and postexposure attitude scores for an advertising study by using a paired difference / test. The data obtained and related Excel...
-
National Motors has equipped the ZX-900 with a new disk brake system. We define p to be the mean stopping distance (from a speed of 35 mph) of all ZX-900s. National Motors would like to claim that...
-
In Equation (3.153), we saw a linear version of an epidemic model. The commonly used nonlinear SIR model is given by \[\begin{align*} \frac{d S}{d t} & =-\beta S I \\ \frac{d I}{d t} & =\beta S...
-
The Michaelis-Menten kinetics reaction is given by \[E+S \underset{k_{1}}{\stackrel{k_{3}}{\longrightarrow}} E S \underset{k_{2}}{\longrightarrow} E+P\] The resulting system of equations for the...
-
Each business day, on average, a company writes checks totaling \($25,000\) to pay its suppliers. The usual clearing time for the checks is four days. Meanwhile, the company is receiving payments...

Study smarter with the SolutionInn App