

The following case study has been extracted from IATA (2008) report on Air Travel Demand. According...
Fantastic news! We've Found the answer you've been seeking!
Question:
Transcribed Image Text:
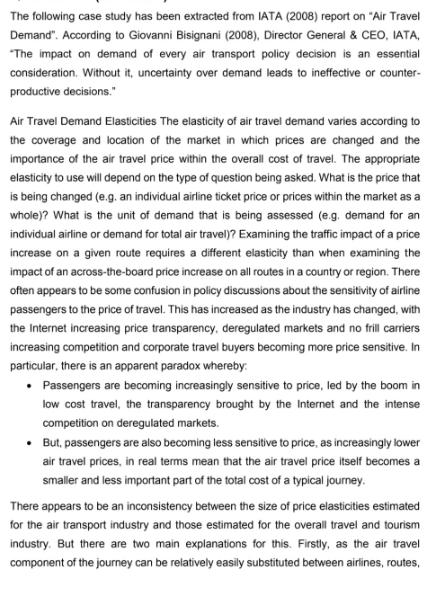
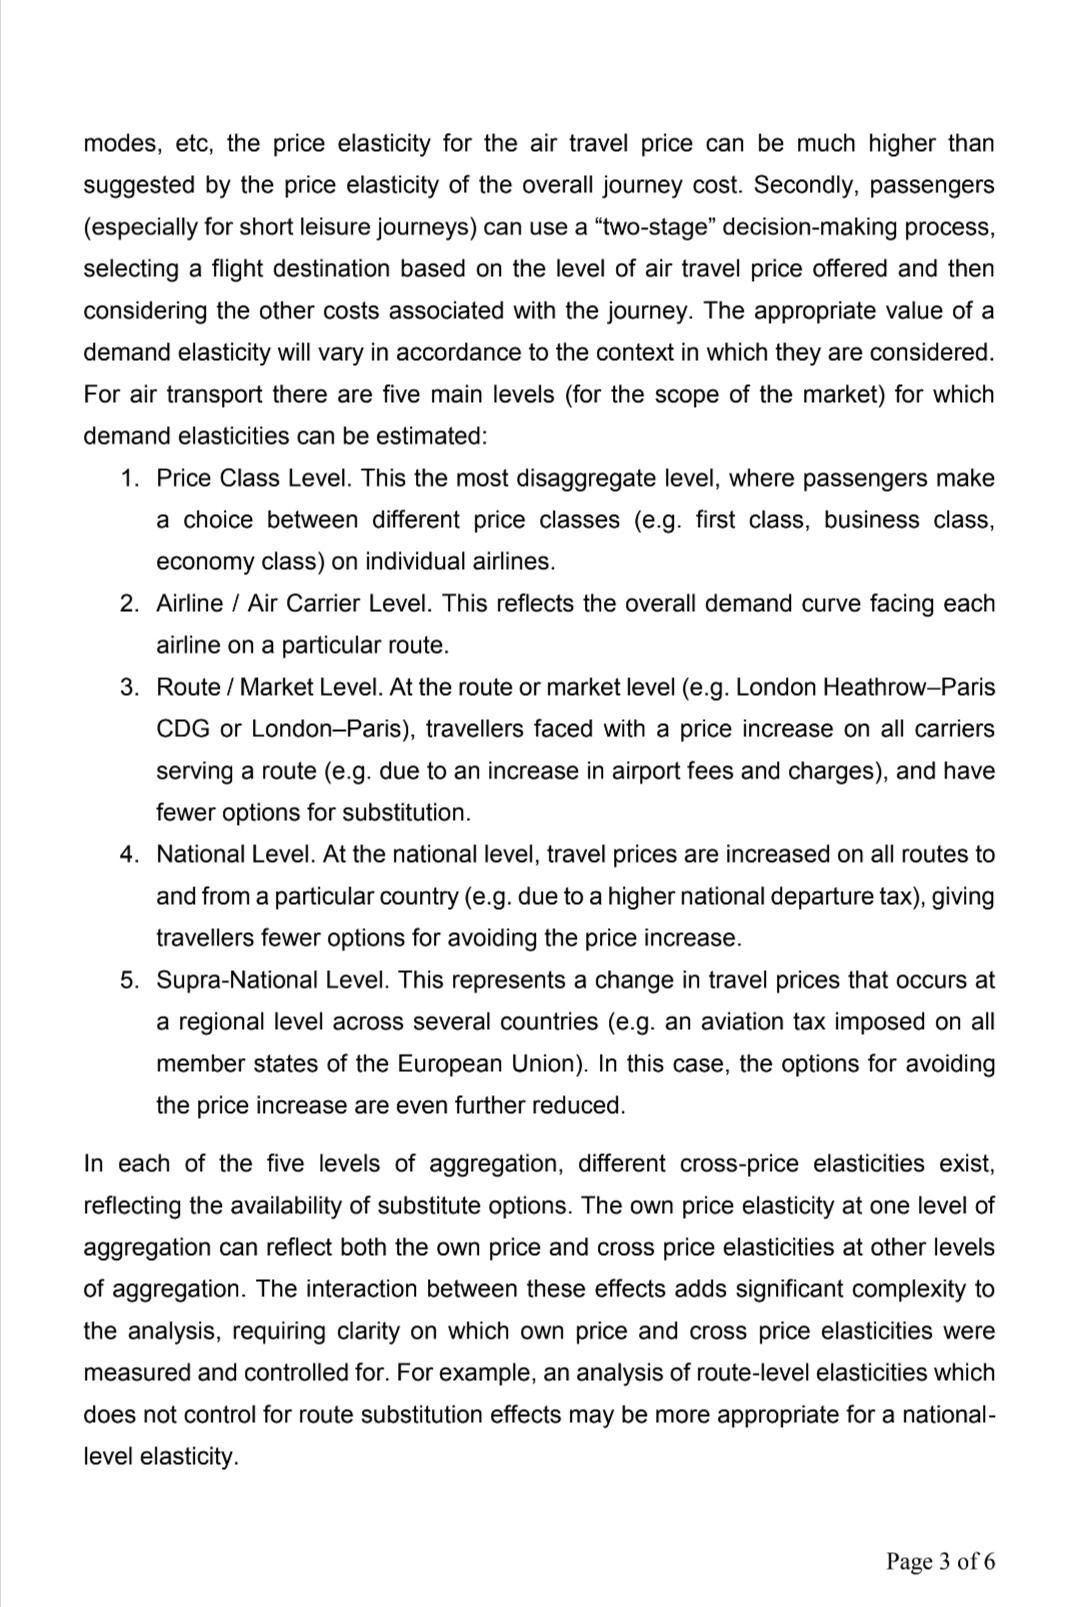
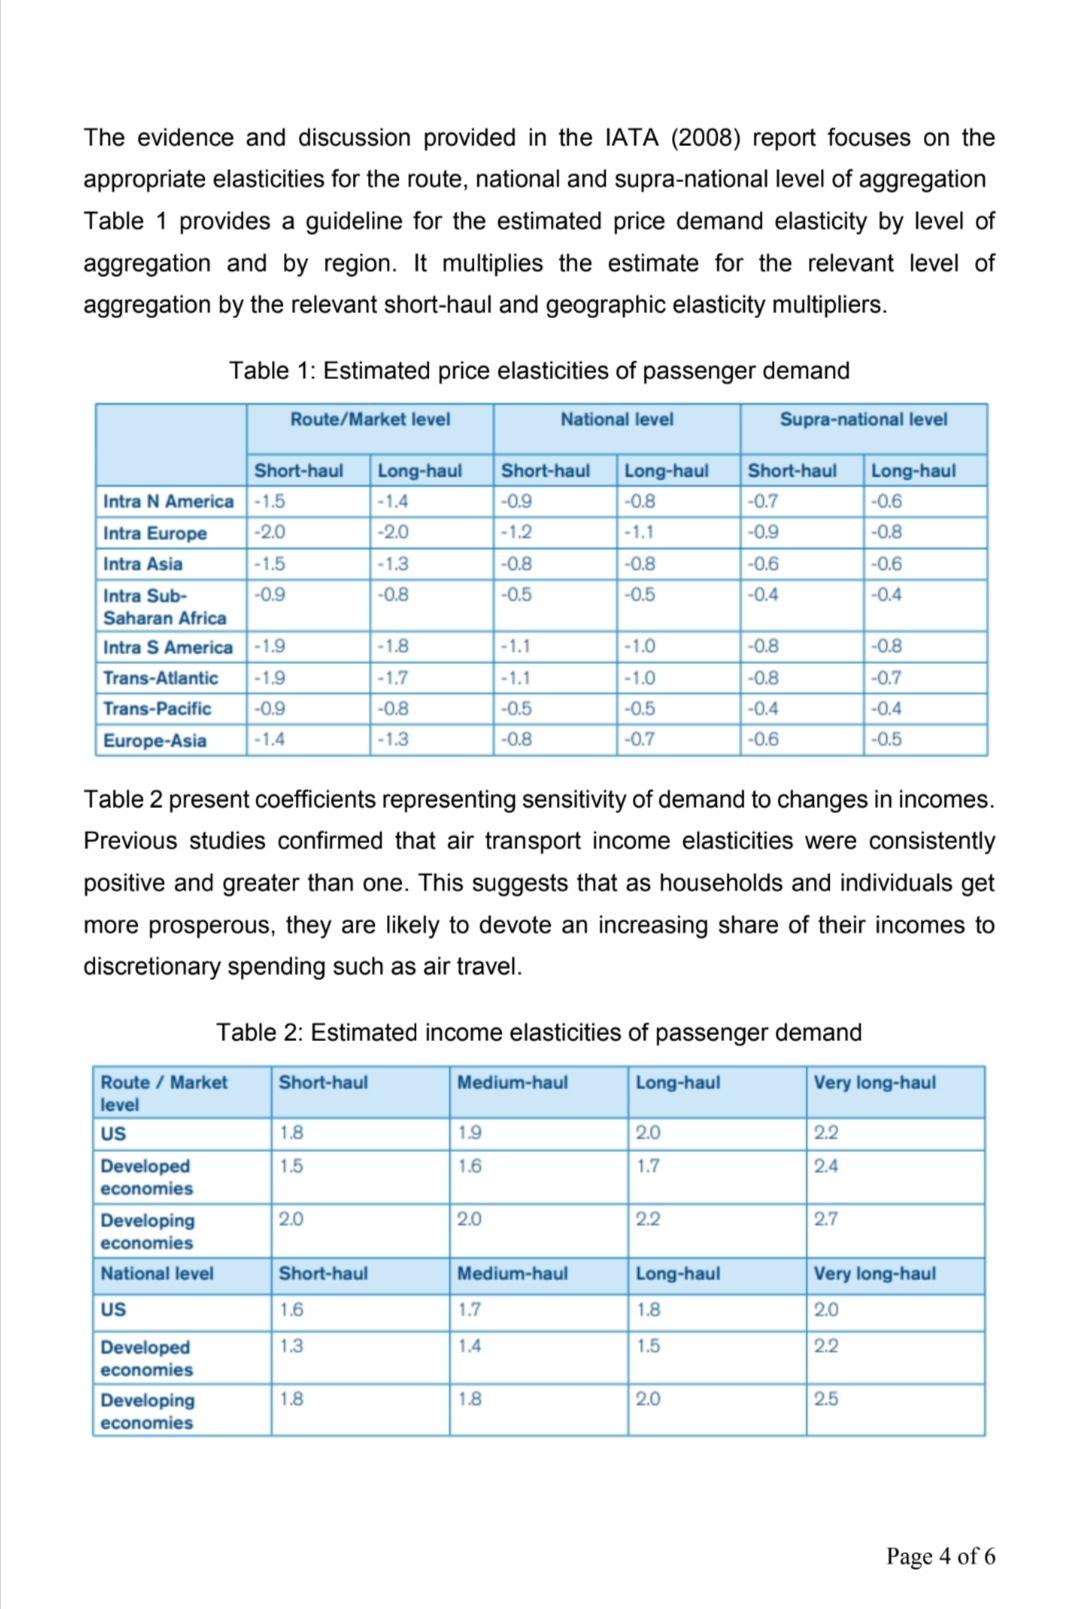
The following case study has been extracted from IATA (2008) report on "Air Travel Demand". According to Giovanni Bisignani (2008), Director General & CEO, IATA, "The impact on demand of every air transport policy decision is an essential consideration. Without it, uncertainty over demand leads to ineffective or counter- productive decisions." Air Travel Demand Elasticities The elasticity of air travel demand varies according to the coverage and location of the market in which prices are changed and the importance of the air travel price within the overall cost of travel. The appropriate elasticity to use will depend on the type of question being asked. What is the price that is being changed (e.g. an individual airline ticket price or prices within the market as a whole)? What is the unit of demand that is being assessed (e.g. demand for an individual airline or demand for total air travel)? Examining the traffic impact of a price increase on a given route requires a different elasticity than when examining the impact of an across-the-board price increase on all routes in a country or region. There often appears to be some confusion in policy discussions about the sensitivity of airline passengers to the price of travel. This has increased as the industry has changed, with the Internet increasing price transparency, deregulated markets and no frill carriers increasing competition and corporate travel buyers becoming more price sensitive. In particular, there is an apparent paradox whereby: • Passengers are becoming increasingly sensitive to price, led by the boom in low cost travel, the transparency brought by the Internet and the intense competition on deregulated markets. • But, passengers are also becoming less sensitive to price, as increasingly lower air travel prices, in real terms mean that the air travel price itself becomes a smaller and less important part of the total cost of a typical journey. There appears to be an inconsistency between the size of price elasticities estimated for the air transport industry and those estimated for the overall travel and tourism industry. But there are two main explanations for this. Firstly, as the air travel component of the journey can be relatively easily substituted between airlines, routes, modes, etc, the price elasticity for the air travel price can be much higher than suggested by the price elasticity of the overall journey cost. Secondly, passengers (especially for short leisure journeys) can use a "two-stage" decision-making process, selecting a flight destination based on the level of air travel price offered and then considering the other costs associated with the journey. The appropriate value of a demand elasticity will vary in accordance to the context in which they are considered. For air transport there are five main levels (for the scope of the market) for which demand elasticities can be estimated: 1. Price Class Level. This the most disaggregate level, where passengers make a choice between different price classes (e.g. first class, business class, economy class) on individual airlines. 2. Airline / Air Carrier Level. This reflects the overall demand curve facing each airline on a particular route. 3. Route / Market Level. At the route or market level (e.g. London Heathrow-Paris CDG or London-Paris), travellers faced with a price increase on all carriers serving a route (e.g. due to an increase in airport fees and charges), and have fewer options for substitution. 4. National Level. At the national level, travel prices are increased on all routes to and from a particular country (e.g. due to a higher national departure tax), giving travellers fewer options for avoiding the price increase. 5. Supra-National Level. This represents a change in travel prices that occurs at a regional level across several countries (e.g. an aviation tax imposed on all member states of the European Union). In this case, the options for avoiding the price increase are even further reduced. In each of the five levels of aggregation, different cross-price elasticities exist, reflecting the availability of substitute options. The own price elasticity at one level of aggregation can reflect both the own price and cross price elasticities at other levels of aggregation. The interaction between these effects adds significant complexity to the analysis, requiring clarity on which own price and cross price elasticities were measured and controlled for. For example, an analysis of route-level elasticities which does not control for route substitution effects may be more appropriate for a national- level elasticity. Page 3 of 6 The evidence and discussion provided in the IATA (2008) report focuses on the appropriate elasticities for the route, national and supra-national level of aggregation Table 1 provides a guideline for the estimated price demand elasticity by level of aggregation and by region. It multiplies the estimate for the relevant level of aggregation by the relevant short-haul and geographic elasticity multipliers. Table 1: Estimated price elasticities of passenger demand Route/Market level National level Supra-national level Short-haul Long-haul Short-haul Long-haul Short-haul Long-haul Intra N America -1.5 -1.4 -0.9 -0.8 -0.7 -0.6 Intra Europe -2.0 -2.0 -1.2 -1.1 -0.9 -0.8 Intra Asia -1.5 -1.3 -0.8 -0.8 -0.6 -0.6 Intra Sub- Saharan Africa -0.9 -0.8 -0.5 -0.5 -0.4 -0.4 Intra S America -1.9 -1.8 -1.1 -1.0 -0.8 -0.8 Trans-Atlantic -1.9 -1.7 -1.1 -1.0 -0.8 -0.7 Trans-Pacific -0.9 -0.8 -0.5 -0.5 -0.4 -0.4 Europe-Asia -1.4 -1.3 -0.8 -0.7 -0.6 -0.5 Table 2 present coefficients representing sensitivity of demand to changes in incomes. Previous studies confirmed that air transport income elasticities were consistently positive and greater than one. This suggests that as households and individuals get more prosperous, they are likely to devote an increasing share of their incomes to discretionary spending such as air travel. Table 2: Estimated income elasticities of passenger demand Route / Market Short-haul Medium-haul Long-haul Very long-haul level US 1.8 1.9 2.0 2.2 Developed economies 1.5 1.6 1.7 2.4 Developing 2.0 2.0 2.2 2.7 economies National level Short-haul Medium-haul Long-haul Very long-haul US 1.6 1.7 1.8 2.0 Developed economies 1.3 1.4 1.5 2.2 Developing 1.8 1.8 2.0 2.5 economies Page 4 of 6 Required: (a) Discuss the main implications for (i) price elasticities, and (ii) income elasticities of passenger demand. [1000 words] (10 marks) (b) As regards price discrimination and/or exploitation, what factors are most significant in determining pricing strategy according to the case study? [1000 words] (15 marks) (c) According to you, what additional factors can be considered in order to better measure price and income elasticities of passenger demand. [1000 words] (15 marks) The following case study has been extracted from IATA (2008) report on "Air Travel Demand". According to Giovanni Bisignani (2008), Director General & CEO, IATA, "The impact on demand of every air transport policy decision is an essential consideration. Without it, uncertainty over demand leads to ineffective or counter- productive decisions." Air Travel Demand Elasticities The elasticity of air travel demand varies according to the coverage and location of the market in which prices are changed and the importance of the air travel price within the overall cost of travel. The appropriate elasticity to use will depend on the type of question being asked. What is the price that is being changed (e.g. an individual airline ticket price or prices within the market as a whole)? What is the unit of demand that is being assessed (e.g. demand for an individual airline or demand for total air travel)? Examining the traffic impact of a price increase on a given route requires a different elasticity than when examining the impact of an across-the-board price increase on all routes in a country or region. There often appears to be some confusion in policy discussions about the sensitivity of airline passengers to the price of travel. This has increased as the industry has changed, with the Internet increasing price transparency, deregulated markets and no frill carriers increasing competition and corporate travel buyers becoming more price sensitive. In particular, there is an apparent paradox whereby: • Passengers are becoming increasingly sensitive to price, led by the boom in low cost travel, the transparency brought by the Internet and the intense competition on deregulated markets. • But, passengers are also becoming less sensitive to price, as increasingly lower air travel prices, in real terms mean that the air travel price itself becomes a smaller and less important part of the total cost of a typical journey. There appears to be an inconsistency between the size of price elasticities estimated for the air transport industry and those estimated for the overall travel and tourism industry. But there are two main explanations for this. Firstly, as the air travel component of the journey can be relatively easily substituted between airlines, routes, modes, etc, the price elasticity for the air travel price can be much higher than suggested by the price elasticity of the overall journey cost. Secondly, passengers (especially for short leisure journeys) can use a "two-stage" decision-making process, selecting a flight destination based on the level of air travel price offered and then considering the other costs associated with the journey. The appropriate value of a demand elasticity will vary in accordance to the context in which they are considered. For air transport there are five main levels (for the scope of the market) for which demand elasticities can be estimated: 1. Price Class Level. This the most disaggregate level, where passengers make a choice between different price classes (e.g. first class, business class, economy class) on individual airlines. 2. Airline / Air Carrier Level. This reflects the overall demand curve facing each airline on a particular route. 3. Route / Market Level. At the route or market level (e.g. London Heathrow-Paris CDG or London-Paris), travellers faced with a price increase on all carriers serving a route (e.g. due to an increase in airport fees and charges), and have fewer options for substitution. 4. National Level. At the national level, travel prices are increased on all routes to and from a particular country (e.g. due to a higher national departure tax), giving travellers fewer options for avoiding the price increase. 5. Supra-National Level. This represents a change in travel prices that occurs at a regional level across several countries (e.g. an aviation tax imposed on all member states of the European Union). In this case, the options for avoiding the price increase are even further reduced. In each of the five levels of aggregation, different cross-price elasticities exist, reflecting the availability of substitute options. The own price elasticity at one level of aggregation can reflect both the own price and cross price elasticities at other levels of aggregation. The interaction between these effects adds significant complexity to the analysis, requiring clarity on which own price and cross price elasticities were measured and controlled for. For example, an analysis of route-level elasticities which does not control for route substitution effects may be more appropriate for a national- level elasticity. Page 3 of 6 The evidence and discussion provided in the IATA (2008) report focuses on the appropriate elasticities for the route, national and supra-national level of aggregation Table 1 provides a guideline for the estimated price demand elasticity by level of aggregation and by region. It multiplies the estimate for the relevant level of aggregation by the relevant short-haul and geographic elasticity multipliers. Table 1: Estimated price elasticities of passenger demand Route/Market level National level Supra-national level Short-haul Long-haul Short-haul Long-haul Short-haul Long-haul Intra N America -1.5 -1.4 -0.9 -0.8 -0.7 -0.6 Intra Europe -2.0 -2.0 -1.2 -1.1 -0.9 -0.8 Intra Asia -1.5 -1.3 -0.8 -0.8 -0.6 -0.6 Intra Sub- Saharan Africa -0.9 -0.8 -0.5 -0.5 -0.4 -0.4 Intra S America -1.9 -1.8 -1.1 -1.0 -0.8 -0.8 Trans-Atlantic -1.9 -1.7 -1.1 -1.0 -0.8 -0.7 Trans-Pacific -0.9 -0.8 -0.5 -0.5 -0.4 -0.4 Europe-Asia -1.4 -1.3 -0.8 -0.7 -0.6 -0.5 Table 2 present coefficients representing sensitivity of demand to changes in incomes. Previous studies confirmed that air transport income elasticities were consistently positive and greater than one. This suggests that as households and individuals get more prosperous, they are likely to devote an increasing share of their incomes to discretionary spending such as air travel. Table 2: Estimated income elasticities of passenger demand Route / Market Short-haul Medium-haul Long-haul Very long-haul level US 1.8 1.9 2.0 2.2 Developed economies 1.5 1.6 1.7 2.4 Developing 2.0 2.0 2.2 2.7 economies National level Short-haul Medium-haul Long-haul Very long-haul US 1.6 1.7 1.8 2.0 Developed economies 1.3 1.4 1.5 2.2 Developing 1.8 1.8 2.0 2.5 economies Page 4 of 6 Required: (a) Discuss the main implications for (i) price elasticities, and (ii) income elasticities of passenger demand. [1000 words] (10 marks) (b) As regards price discrimination and/or exploitation, what factors are most significant in determining pricing strategy according to the case study? [1000 words] (15 marks) (c) According to you, what additional factors can be considered in order to better measure price and income elasticities of passenger demand. [1000 words] (15 marks)
Expert Answer:
Answer rating: 100% (QA)
This report has revealed that there are different price elasticities associated with different uses When consumers are choosing between airlines on a route or even between destinations for holidays co... View the full answer

Related Book For 

Intermediate Accounting
ISBN: 978-0324300987
10th Edition
Authors: Loren A Nikolai, D. Bazley and Jefferson P. Jones
Posted Date:
Students also viewed these economics questions
-
The following trial balance has been extracted from the ledger of Andrea Howell, a sole trader, as at 31 May 20X3, the end of her most recent financial year. The following additional information as...
-
The following information has been extracted from the draft financial statements of TEX, a manufacturing entity: TEX - Income statement for the year ended 30 September 2003 September 2003...
-
The following information has been extracted from the accounting records of the Atwood Corporation: 1. Cash on hand (undeposited sales receipts) ............ $ 1,020 2. Certificates of deposit...
-
Find the struggles faced by business (printed t-shirts) with suppliers? Explain what would be the communication plan for each stakeholder and how you'll implement the decision you have taken?
-
Identify the major participants in the U.S. monetary system.
-
A computer IC chip consumes 10 W of power, which is dissipated as heat. The chip measures 4 cm by 4 cm on a side and is 0.5-cm thick. Currently the IC chip is packaged into an electronic device as...
-
Which of the following is/are methods of reducing fraud losses once fraud has occurred? (There may be more than one right answer.) a. insurance b. regular backup of data and programs c. contingency...
-
David Barnes and his fiancee Valerie Shah are visiting Hawaii. There are 20 guests registered for orientation. It is announced that 12 randomly selected registered guests will receive a free lesson...
-
Suppose a stock had an initial price of \ ( \ $ 5 8 \ ) per share, paid a dividend of \ ( \ $ 1 . 8 7 \ ) per share during the year, and had an ending share price of \ ( \ $ 3 4 \ ) . Compute the...
-
Below is review of the books and records at December 31 for East West College. The review has identified the matters that may need addressing. Record any adjustments required to complete the year end...
-
On July 1, 2021, Susan opened a business supply store. Prior to opening the business, she incurred the following costs: Purchase of fixtures $ 600 Accounting fees related to setting up the business...
-
What would you observe in procedural step 2 under Flow chart tests if 6 M were used in place of 6 M ?
-
Probability coin flip 1 lands heads = Probability coin flip 2 lands heads=12 1 X 2 1 1 2 4 The probability that both coins land heads up is 4, or a 25% chance. These probabilities can be applied to...
-
Kayaks!Incorporated manufactures a line of sea kayaks and accessories in a make-to-stock environment. These products are sold to boat dealers and major depart ment stores throughout North America,...
-
What are the differences between a finance lease and an operating lease? Why is the cost of replacement tires being ignored in the lease v buy analysis? Tori's textbook states that when making a...
-
Under what circumstances would a system administrator lose access to an instance of SQL Server? Give an example.
-
2. According to the manufacturer of M&M's, 30% of the produced M&M's are brown. John buys a large family size bag and Karen buys a small (standard) bag. Which bag is more likely to have more than 50%...
-
Cobb Manufacturing Company uses a process cost system and average costing. The following production data is for the month of June 2011. Production Costs Work in process, beginning of the month:...
-
On November 21, 2007 a fire at Hodge Companys warehouse caused severe damage to its entire inventory of Product Tex. Hodge estimates that all usable damaged goods can be sold for $10,000. The...
-
You are auditing the financial records of a company and you are aware that it has grown quickly in the last few years by acquiring other companies. You look up the disclosure in last years annual...
-
What is a bond? Define face value, maturity date, contract rate, bond certificate, and bond indenture.
-
The proportion of income received by the richest 5 percent of Americans has a. edged upward since the 1980s. b. held steady since the 1980s. c. decreased slightly since the 1980s. d. decreased...
-
Which of the following are overrepresented among those with low incomes? a. College students working toward their graduate degrees b. Single-parent families c. Young, inexperienced workers d. All of...
-
What has happened to income distribution since 1935?

Study smarter with the SolutionInn App