

Perform the vertical and horizontal analysis and calculate the ratios as instructed (40 points) Fill the...
Fantastic news! We've Found the answer you've been seeking!
Question:
Transcribed Image Text:
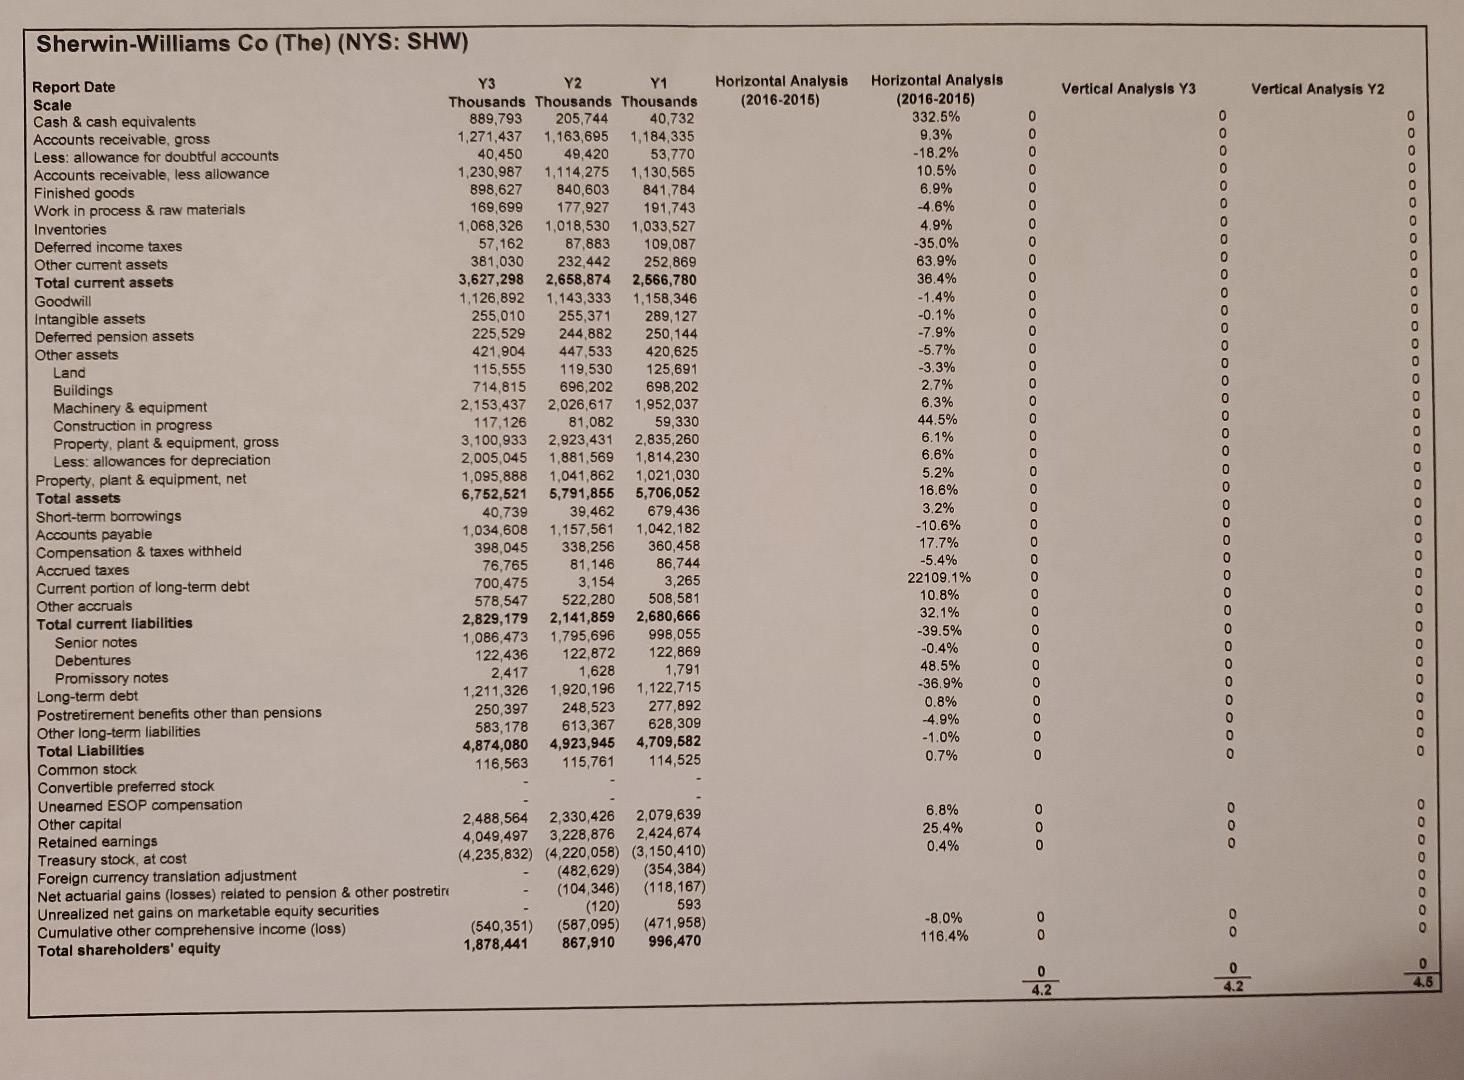
Perform the vertical and horizontal analysis and calculate the ratios as instructed (40 points) Fill the grey cells by using Excel formulas or cells referencing NOT hardcoding. You will not earn credit for hardcoding (entering the figures manually). You are a financial analyst. Based on your analysis of Sherwin-Williams Co (SW) financial statements, provide a report to guide investors whether SW is a buy (keep) or sell stock. Your report should include the following (60 points): a. An interpretation of trends illustrated by supportive ratios, horizontal and vertical analysis and focus on the main ratios that "tell the story". (a minimum of two pages-not to exceed 3 pages, single space, 12 font size). otes i. Horizontal and vertical analysis (Balance Sheet)-10 points Vertical Analysis (Income Statement)-10 points ii. iii. Ratio Analysis- 20 points b. What additional information do you suggest could influence the investment decision? Do some research about the company. (1 paragraph) 10 points C. Your informed recommendation (buy or sell) about SW with justifications. What is your general impression about SW? Support your conclusion (1-2 paragraph) 10 points structions: Show good understanding of what each analysis and each ratio is measuring. Make sure that every claim is justified by an analysis of the company's financials. Ensure that the report tells a coherent story about the company. Groups will receive zero credit for plagiarism Vertical analysis: expresses the items of each statement for the period relative to a base figure. For B/S, you express each item of the B/S as a percentage of total assets whereas for I/S, each item of the I/S is expressed as a percentage of total sales. Hint for EBIT calculation: net income income tax+ interest expense Horizontal analysis: evaluates the trends (rate of change) over a period of time. For example, the rate of change of each item of the B/S from 2020 to 2021 is calculated as follows: (Amount in 2021-Amount in 2020)/amount in 2020. Sherwin-Williams Co (The) (NYS: SHW) Report Date Scale Cash & cash equivalents Accounts receivable, gross Less: allowance for doubtful accounts Accounts receivable, less allowance Finished goods Work in process & raw materials Inventories Deferred income taxes Other current assets Total current assets Goodwill Intangible assets Deferred pension assets Other assets Land Buildings Machinery & equipment Construction in progress Property, plant & equipment, gross Les allowances for depreciation Property, plant & equipment, net Total assets Short-term borrowings Accounts payable Compensation & taxes withheld Accrued taxes Current portion of long-term debt Other accruals Total current liabilities Senior notes Debentures Promissory notes Long-term debt Postretirement benefits other than pensions Other long-term liabilities Total Liabilities Common stock Convertible preferred stock Unearned ESOP compensation Y2 Y1 Y3 Thousands Thousands Thousands 889,793 205,744 40,732 1,271,437 1,163,695 1,184,335 53,770 1,114,275 1,130,565 49,420 40,450 1,230,987 898,627 840,603 841,784 169,699 177,927 191,743 1,068,326 1,018,530 1,033,527 57,162 87,883 109,087 381,030 232,442 252,869 3,627,298 2,658,874 2,566,780 1,158,346 1,126,892 1,143,333 255,010 255,371 225,529 244,882 289,127 250,144 421,904 447,533 420,625 115,555 119,530 125,691 696,202 698,202 714,815 2,153,437 117,126 2,026,617 1,952,037 59,330 81,082 2,923,431 2,835,260 3,100,933 2,005,045 1,881,569 1,814,230 Other capital Retained earnings Treasury stock, at cost Foreign currency translation adjustment Net actuarial gains (losses) related to pension & other postretire Unrealized net gains on marketable equity securities Cumulative other comprehensive income (loss) Total shareholders' equity 1,095,888 1,041,862 1,021,030 6,752,521 5,791,855 5,706,052 679,436 40,739 39,462 1,034,608 1,157,561 398,045 1,042,182 338,256 360,458 76,765 81,146 86,744 700,475 3,154 3,265 578,547 522,280 2,829,179 2,141,859 1,086,473 1,795,696 122,872 122,436 2,417 1,211,326 1,920,196 1,122,715 1,628 277,892 613,367 628,309 250,397 248,523 583,178 4,874,080 4,923,945 4,709,582 116,563 115,761 114,525 508,581 2,680,666 998,055 122,869 1,791 2,488,564 2,330,426 2,079,639 4,049,497 3,228,876 2,424,674 (4,235,832) (4,220,058) (3,150,410) (482,629) (354,384) (104,346) (120) (118,167) 593 (540,351) (587,095) (471,958) 1,878,441 867,910 996,470 Horizontal Analysis (2016-2015) Horizontal Analysis (2016-2015) 332.5% 9.3% -18.2% 10.5% 6.9% -4.6% 4.9% -35.0% 63.9% 36.4% -1.4% -0.1% -7.9% -5.7% -3.3% 2,7% 6.3% 44.5% 6.1% 6.6% 5.2% 16.6% 3.2% -10.6% 17.7% -5.4% 22109.1% 10.8% 32.1% -39.5% -0.4% 48.5% -36.9% 0.8% -4.9% -1.0% 0.7% 6.8% 25,4% 0.4% -8.0% 116.4% 0 0 0 0 0 0 0 0 0 0 0 0 0 0 0 0 0 0 0 0 0 0 0 0 0 0 ooooooooo 0 0 O O O 0 0 0 0 0 4.2 Vertical Analysis Y3 0 0 0 0 0 0 0 0 0 0 0 0 0 0 0 0 0 0 0 0 oooooooooo 0 0 0 0 000 0 4.2 Vertical Analysis Y2 00000 0 0 0 0 0 0 0 0 0 0 0 0 0 0 0 0 0 0 0 0 0 0 0 0 0 0 0 0 0 000 0 0 0 0 0 0 0 0 0 4.5 Perform the vertical and horizontal analysis and calculate the ratios as instructed (40 points) Fill the grey cells by using Excel formulas or cells referencing NOT hardcoding. You will not earn credit for hardcoding (entering the figures manually). You are a financial analyst. Based on your analysis of Sherwin-Williams Co (SW) financial statements, provide a report to guide investors whether SW is a buy (keep) or sell stock. Your report should include the following (60 points): a. An interpretation of trends illustrated by supportive ratios, horizontal and vertical analysis and focus on the main ratios that "tell the story". (a minimum of two pages-not to exceed 3 pages, single space, 12 font size). otes i. Horizontal and vertical analysis (Balance Sheet)-10 points Vertical Analysis (Income Statement)-10 points ii. iii. Ratio Analysis- 20 points b. What additional information do you suggest could influence the investment decision? Do some research about the company. (1 paragraph) 10 points C. Your informed recommendation (buy or sell) about SW with justifications. What is your general impression about SW? Support your conclusion (1-2 paragraph) 10 points structions: Show good understanding of what each analysis and each ratio is measuring. Make sure that every claim is justified by an analysis of the company's financials. Ensure that the report tells a coherent story about the company. Groups will receive zero credit for plagiarism Vertical analysis: expresses the items of each statement for the period relative to a base figure. For B/S, you express each item of the B/S as a percentage of total assets whereas for I/S, each item of the I/S is expressed as a percentage of total sales. Hint for EBIT calculation: net income income tax+ interest expense Horizontal analysis: evaluates the trends (rate of change) over a period of time. For example, the rate of change of each item of the B/S from 2020 to 2021 is calculated as follows: (Amount in 2021-Amount in 2020)/amount in 2020. Sherwin-Williams Co (The) (NYS: SHW) Report Date Scale Cash & cash equivalents Accounts receivable, gross Less: allowance for doubtful accounts Accounts receivable, less allowance Finished goods Work in process & raw materials Inventories Deferred income taxes Other current assets Total current assets Goodwill Intangible assets Deferred pension assets Other assets Land Buildings Machinery & equipment Construction in progress Property, plant & equipment, gross Les allowances for depreciation Property, plant & equipment, net Total assets Short-term borrowings Accounts payable Compensation & taxes withheld Accrued taxes Current portion of long-term debt Other accruals Total current liabilities Senior notes Debentures Promissory notes Long-term debt Postretirement benefits other than pensions Other long-term liabilities Total Liabilities Common stock Convertible preferred stock Unearned ESOP compensation Y2 Y1 Y3 Thousands Thousands Thousands 889,793 205,744 40,732 1,271,437 1,163,695 1,184,335 53,770 1,114,275 1,130,565 49,420 40,450 1,230,987 898,627 840,603 841,784 169,699 177,927 191,743 1,068,326 1,018,530 1,033,527 57,162 87,883 109,087 381,030 232,442 252,869 3,627,298 2,658,874 2,566,780 1,158,346 1,126,892 1,143,333 255,010 255,371 225,529 244,882 289,127 250,144 421,904 447,533 420,625 115,555 119,530 125,691 696,202 698,202 714,815 2,153,437 117,126 2,026,617 1,952,037 59,330 81,082 2,923,431 2,835,260 3,100,933 2,005,045 1,881,569 1,814,230 Other capital Retained earnings Treasury stock, at cost Foreign currency translation adjustment Net actuarial gains (losses) related to pension & other postretire Unrealized net gains on marketable equity securities Cumulative other comprehensive income (loss) Total shareholders' equity 1,095,888 1,041,862 1,021,030 6,752,521 5,791,855 5,706,052 679,436 40,739 39,462 1,034,608 1,157,561 398,045 1,042,182 338,256 360,458 76,765 81,146 86,744 700,475 3,154 3,265 578,547 522,280 2,829,179 2,141,859 1,086,473 1,795,696 122,872 122,436 2,417 1,211,326 1,920,196 1,122,715 1,628 277,892 613,367 628,309 250,397 248,523 583,178 4,874,080 4,923,945 4,709,582 116,563 115,761 114,525 508,581 2,680,666 998,055 122,869 1,791 2,488,564 2,330,426 2,079,639 4,049,497 3,228,876 2,424,674 (4,235,832) (4,220,058) (3,150,410) (482,629) (354,384) (104,346) (120) (118,167) 593 (540,351) (587,095) (471,958) 1,878,441 867,910 996,470 Horizontal Analysis (2016-2015) Horizontal Analysis (2016-2015) 332.5% 9.3% -18.2% 10.5% 6.9% -4.6% 4.9% -35.0% 63.9% 36.4% -1.4% -0.1% -7.9% -5.7% -3.3% 2,7% 6.3% 44.5% 6.1% 6.6% 5.2% 16.6% 3.2% -10.6% 17.7% -5.4% 22109.1% 10.8% 32.1% -39.5% -0.4% 48.5% -36.9% 0.8% -4.9% -1.0% 0.7% 6.8% 25,4% 0.4% -8.0% 116.4% 0 0 0 0 0 0 0 0 0 0 0 0 0 0 0 0 0 0 0 0 0 0 0 0 0 0 ooooooooo 0 0 O O O 0 0 0 0 0 4.2 Vertical Analysis Y3 0 0 0 0 0 0 0 0 0 0 0 0 0 0 0 0 0 0 0 0 oooooooooo 0 0 0 0 000 0 4.2 Vertical Analysis Y2 00000 0 0 0 0 0 0 0 0 0 0 0 0 0 0 0 0 0 0 0 0 0 0 0 0 0 0 0 0 0 000 0 0 0 0 0 0 0 0 0 4.5
Expert Answer:
Answer rating: 100% (QA)
Here is the analysis of SherwinWilliams Co SW financial statements Horizontal Analysis Balance Sheet Item 2021 2020 Change Cash and cash equivalents 1504 1342 120 Accounts receivable 5634 4897 147 Inv... View the full answer

Related Book For 

Posted Date:
Students also viewed these accounting questions
-
?? . Analysis and Interpretation of Profitability Balance sheets and income statements for 3M Company follow. Consolidated Statements of Income Years ended December 31 ($ millions) Net sales...
-
The Walt Disney Company, together with the subsidiaries through which businesses are conducted (the Company), is a diversified worldwide entertainment company with operations in the following...
-
Honda Motor Co. and its subsidiaries (collectively Honda) develop, manufacture, distribute and provide financing for the sale of its motorcycles, automobiles and power products. The consolidated...
-
Casey Motors recently reported the following information: Net income = $850,000. Tax rate = 40%. Interest expense = $200,000. Total investor-supplied operating capital employed = $9 million. ...
-
Amfac Company manufactures a single product. The company keeps careful records of manufacturing activities from which the following information has been extracted: The companys manufacturing overhead...
-
Phosphorus trichloride (PCl 3 ) reacts with chlorine gas (Cl 2 ) to produce phosphorus pentachloride (PCl 5 ) as per the following reversible gas phase reaction: The initial and equilibrium...
-
Explain why finance has been globalised over the past 20 years.
-
Market Star is a marketing services firm that creates advertising copy for clients and places the advertising in television, magazines, and other media. Accounts receivable represent amounts owed by...
-
Great Electronics is a video game store that sells refurbished games for older systems. How much is net income for the month of September? Great Electronics buys $500 of games on account from...
-
The bank reconciliation prepared by Village-on-the-Lake Condos on May 31, 2020, is shown below: The Cash account in the general ledger appeared as follows on June 30: A list of deposits made and...
-
22.) Find the first-order rate constant for the disappearance of A in the gas reaction A -1.6R if the volume of the reaction mixture, starting with pure A, increases by 50% in 4 min. The total...
-
Find output int[][] array1 = {{1,2,3,4), {5,6,7,8}, {9,10,11,12}, {13,14,15,16}}; for (int i = 0; i
-
At the Gilroy Garlic Festival in California, you can sample avariety of food dishes prepared from fresh garlic, including garlicice cream and garlic cheesecake. The characteristic flavor andaroma of...
-
How many grams of glucose (C_6H_12O_6) are required to prepare 1.75 liters of 0.233 M glucose solution? a) How many mL of 2.85 M MgCl_2 are needed to prepare 7.50 liters of 0.125 M MgCl_2? b) How...
-
Did Christopher Columbus discover America? Explain. Is America truly a "land of opportunity in the 18th century? Explain. How did geography affect the development of colonial America? Would you have...
-
One serving of Monster energy drink contains 86 mg of caffeine (C3H10N402). How many moles of caffeine is in one serving?
-
Yellow Sticker Company's variable expenses are 40% of sales. The company has monthly fixed expenses of $15,000 and sells each unit for $0.50. The monthly target operating income is $7,500. a. What is...
-
How does Kant answer Humes bundle theory of self? Do you think he is successful?
-
Orion Corp.'s financial data for 2019 and 2018 included the following: Required: Calculate Orion's dividend payout ratio for 2019? 2019 2018 Net income $120,000 $135,000 Cash dividends paid on common...
-
The inventory accounting records for Lee Enterprises contained the following data: Beginning inventory .......... 1,400 units at $12 each Purchase 1, Feb. 26 ......... 2,400 units at $16 each Sale 1,...
-
Augusta Corporation reported the following information: 35,000 shares of $3 par value common stock authorized, 30,000 shares common stock issued, 10,000 shares treasury stock. Required: 1. What is...
-
When incomes rise, the demand for health care _________ because health care is a _________ good.
-
_________ exists in health care when insurance makes a person more likely to engage in more risky behavior and less likely to take preventative measures against illness.
-
Third-party payers attempt to reduce moral hazard problems with _________ and _________.

Study smarter with the SolutionInn App